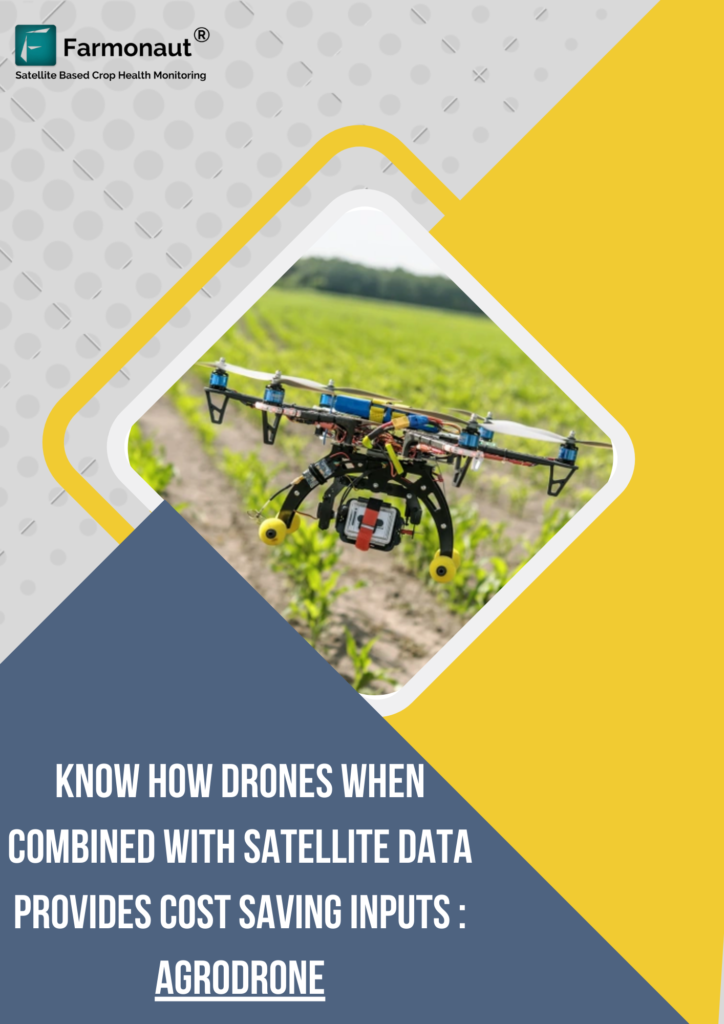
Month: August 2022

INTRODUCTION

Agrodrone is an Israel based company with a great experience of UAVs (Unmanned Aerial Vehicles commonly known as Drones). The company is currently associated with the application of UAVs in the field of agriculture to help farmers with the help of satellite images and airborne equipment.

They have also been certified operational by CAAI (Civil Aviation Authority of Israel). Agrodrone has looked forward to the safety and effective working of the drones by managing to get certified drone pilots and certified drones as well.

EMERGING UAVs IN AGRICULTURE

Drones were commercially used since the 1980s, due to the vast applications in various fields it has built an impact on the world. As a result, many companies are creating various business opportunities through UAVs. For better understanding, it has been named as precision agriculture in modern terms.

However, AgroDrone has been working for the farmers of Israel having large farm areas i.e, >100 hectares. Farmers with large land holdings have had many use cases of the UAVs which has many opportunities for the farmers to lead a better way towards increasing their productivity and income as well. There has been many applications of drones in the agriculture field as mentioned below:

  • Crop health monitoring
  • Weed identification
  • Soil and field analysis
  • Cattle monitoring
  • Spraying
  • Planting
  • Irrigation

LIMITATIONS OF UAVs

Agriculture applications drones also do have some drawbacks which need to be solved for precise farming.

  • Requires trained operators for drones: For flying the drones the pilot must take license from the country Government.
  • Less flight time: Due to battery backup drones don’t have enough flight time to scan large farms.
  • Less range: there are different range drones: small, medium and large. The large drones are expensive for the farmers and less range drones aren’t much useful for large farmers.
  • More features drones are expensive: More features in machinery gets at higher prices.
  • Can cause accidents with manned armed aircrafts.
  • Difficult to operate in extreme conditions: Changing weather conditions can disrupt the flying of drones which can affect the data driven from it.

Due to the drawbacks mentioned above, drones solely cannot be used for precision farming.

SATELLITE DATA

Due to various drawbacks of drones, satellites can be of great use to capture data of the farmland. Satellites capture the data based on the concept of NDVI (normalized Difference vegetative index) that states the stressed areas and dry/wet areas too.. It also provides information such as crop health, soil health, vegetation index, etc.

HYBRID APPROACH AS A SOLUTION

In order to overcome the problem faced by drones in agriculture, Agrodrone has been opting for a hybrid solution. Hybrid Approach is basically a combination of satellite data and drones to find a feasible solution to the farming problems.

With the similar approach Daybest, an India based company, is carrying the same use case on the large scale. Daybest also uses UAVs and satellite data in different sectors including Agriculture for precise results.

As mentioned above, usage of only drones leads to scalability issues as well as is not feasible for large farms to locate the issues. Apart from it, it does bend towards the expensive side.

How does it WORK?

To start with, Agrodrone inserts the locations of the farms of their clients(farmers) on the Farmonaut’s platform. Hence, whenever the satellite passes over the locations it collects data on the information of vulnerability of the areas on the farms. Satellite data would help to decrease the drone flight time and cover a large range in a very short time.

In spite of flying the drone over the whole land area, it can be flown over the vulnerable areas where the satellite has indicated risk for the farms. The information from satellites and drones is processed which is used to report to the growers/farmers and help them in the management of the farms through machinery. Therefore, the farmers owning the drones can easily manage the areas through satellite data and drone usage.

BENEFITS OF THE APPROACH

The usage of drones with the satellite images have helped the Agrodrone to make their client’s farm more advanced and increase the productivity. The benefits of this approach would be that it would be less expensive than using drones only. Apart from that the data can be gained in the extreme weather conditions also. Also, it becomes more feasible for farmers to adopt the technology and it is easy to understand.

CONCLUSION

Agrodrone being the UAVs expert tried applying it to the field of agriculture to overcome the limitations of Drones in agriculture. They have been combining the drone technology with the satellite data to benefit the large farmers in Israel. This combination has various benefits such as it would be less expensive as compared to only using drones. Also it would decrease the flight time of drones and as the range of inexpensive drones is low satellite plays a major role in finding the data. The satellite data is gained when Agrodrone locates the farm on the Farmonaut platform.

INTRODUCTION: CROP AREA ESTIMATION

The two components of agricultural production estimation are crop area and yield estimation. In order to estimate yield, Producers generally measure the amount of a particular crop harvested in a sample area to estimate crop yield. The harvested crop is then weighed, and the entire crop production of the area is approximated from the sample.

A method for estimating and forecasting termed as a crop estimation allows analysts or farm owners to predict or calculate the potential tonnage of a particular crop. The estimation of the crop can be done at different levels such as village level, taluka level, district level, state level and national level. To obtain the most accurate results, it is advisable to estimate the crop area at distinct periods all across the season.

“WHY IS IT NECESSARY?”

Planning and resource allocation for the progress of the agricultural sector mainly rely on data on crop area, yield, and production. The planners and policymakers are incharge of formulating effective agricultural policies and making critical decisions on procurement, storage, public distribution, import, export, and other similar matters rely on accurate and timely information on crop area, yield, and production.

Crop area estimation also ensures global or national food security and helps in making reasonable import/export policies, as well as for adjusting food prices effectively.

“METHODS FOR CROP AREA ESTIMATION”

The best measuring technique for estimating crop area is determined by a number of operational parameters, such as land design, field shape, type of crop, cropping pattern, and available skills and resources.

Farmer assessment of crop area: In this method, the farmers are asked to estimate their field area by visiting the farmers’ field. However, this method is less time consuming and inexpensive. In contrast, this method is subjective and requires knowledge and experience.

GPS: GPS provides location and time information anywhere on earth. This method gives rapid and feasible measurements. But this method has a drawback that data would be missing for fields located in the remote areas and data could be affected due to weather conditions.

Rope and Compass method: this has been the traditional method majorly used. To its advantage, it provides accurate area measurements and errors can be evaluated on spot. However, it is a laborious and expensive method.

Remote Sensing and GIS: Remote sensing helps to collect data through satellite that helps to estimate crop area. The satellite images used give accurate results for the crop area estimation. For large areas such as district level, state level, this method works precisely. It is also useful in estimating hilly areas and the areas that are inaccessible. Farmonaut Technologies provides crop area estimation services to various agencies by Remote sensing method majorly for decision-making.

USE CASES OF CROP AREA ESTIMATION FOR DIFFERENT REGIONS

  • Soybean Processors Association Of India (SOPA)

SOPA has been performing Crop Area Estimation in 50 districts of Madhya Pradesh, Maharashtra and Rajasthan. Soybean being the high valued oilseed crop requires information on the crop production to understand the crop sown. For the estimation of crop area and yield, optical remote sensing data source was used. Crop leaves being sensitive to the visible and infrared regions helps to estimate accurately. With the help of optical satellite images and Synthetic Aperture Radar (SAR) the kharif season crop could be mapped. SAR has the ability of operating wavelengths that can access data during cloud cover too.

This estimation method helped SOPA to determine Crop Area Sown, Crop Identification, Tracking of Sowing and harvesting patterns of the producers. All this information helps them in suggesting the prices of soybean oilseeds, export/import decisions and storage and distribution of oilseeds.

For more information on Project: Click here

  • Rice Yield Calculation in Saharsa (Bihar)- 2021

The research was carried out in the rice crop in Saharsa, Bihar at the final stage of vegetation (i.e., 10-30 days before harvesting). For forecasting the yield of paddy, the data from Sentinel-2 satellite and Farmonaut’s Satellite based crop monitoring system. The yield was calculated using the NDVI (Normalized Difference Vegetation Index) and the Farmonaut platform helped in field mapping.

As a result the prediction of average yield was approximately similar to the data from the KVK (Krishi Vigyan Kendra). The yield forecasting with remote sensing gives less errors.

For more information on Project: Click here

  • Makhana Area and Yield Calculation in Saharsa (Bihar) – 2022

Bihar being the largest producer of fox nuts, commonly known as makhana. Makhana is grown in stagnant water of wetlands or ponds. The study was conducted for the estimation of Makhana crop acreage using remote sensing. Sentinel-2 satellite data was used to determine the area with the parameters such as NDVI and LSWI (Land Surface Wetness Index).

As a result, the makhana area calculation is feasible. However, the accuracy of which can be improved by using different models. Also, it was found that depth of the pond also affects the accuracy therefore must be considered.

For more information on Project: Click here

  • Potato Yield Estimation

Estimation of potato crop yield before the harvest period would be useful in making marketing decisions. Also, the early estimation of yield can help in detection of problems and help them reduce the losses.

According to the survey, it can be concluded that estimation of yield of potatoes using Remote sensing is a very tough process. In order to calculate yield various indices like NDVI, EVI, VCI, NDWI can be used.

For more information on Project: Click here

  • Wheat yield Calculation in Saharsa(Bihar) – 2022

Using remote sensing data and specific algorithms with different vegetation indices, Farmonaut estimated wheat yield in the Saharsa district of Bihar during the Rabi season 2020-21.

Similar to the other crop estimation, Sentinel-2 was used in mapping the fields and the area and yield were calculated using NDVI and LAI (Leaf Area Index). In the procedure the estimation was done by using the LAI with WTGROWS model for mapping yield. If the weather conditions seem normal then the yield achieved would have less error. In the estimation, weather parameters do play an important role.

For more information on Project: Click here

CONCLUSION

Crop area estimation at different levels from village level to national level has been of great importance to agencies. Remote Sensing has been used as a tool for accurate and precise estimation of crop area and yield. The various regions of India have been using this technique with the help of Farmonaut Technologies to estimate crop area and yield of different crops. The results are obtained through the various indices used such as NDVI, LAI, NDWI and SAR. As a result, crop area and yield estimation helps in planning and allocation of resources, deciding government policies, maintaining national food security and many more benefits for the decision making.

INTRODUCTION Zr3i is a digital agricultural platform that provides data to the small farmers, agriculture businesses and all workers in the agriculture sector. Zr3i has developed a website and an android application for Egypt and the Arab World that are available in Arabic language for better understanding for local farmers. “Zr3i’s main objective is to provide detailed information/reports to farmers regarding soil data, vegetation cover indicators which are necessary for increasing productivity.” The platform works on API between the Zr3i and Farmonaut (as a service provider). Hence, the developed platform majorly depends on Farmonaut Technologies. PROBLEMS FACED IN AGRICULTURE SECTOR Farmers face many problems during each stage of farming, from cultivation to harvesting. Being unaware of various weather parameters and soil parameters that affect the quality and quantity of production and decreases profit. Due to the use of traditional methods problems mainly faced are: Water Stress, Carbon level and usage of chemicals. HOW DOES ZR3I WORKS? Zr3i helps the user in providing relevant important services which would be helpful to get rid of all the problems faced during farming operations. It provides crop health analytics, weather data analytics and reports in more than 50+ languages including Arabic. Detailed Reports includes The Farmonaut helps the user of Zr3i to have detailed reports of the farm that are created by their system directly. Everytime a user visits, the system creates a detailed report which helps the farm owner to monitor all activities going on in his/her farm. The reports are generated with the help of satellite images which helps to determine the crop health and weather conditions of the farm. The crop health can easily be estimated through image colors:
  1. Light/dark Green: healthy crops.
  2. Yellow: crops that need attention.
  3. Red: Barren land.
Through this color, farmers can easily open GPS and track their field using the images. The images can also be provided in the two color coding based on the height of the vegetation:
  1. Colormap 1: It is used for vegetation attending normal height.
  2. Colormap 2: It is used for vegetation having 2-3 inches height.
Zr3i also provides the NDVI images, EVI images, SAVI images and AVI images that helps in the early growth stages of crops. Whereas, NDRE images are useful in the later stage of crop growth. The images helps as per following:
  • NDVI (Normalised difference vegetative index): NDVI images help to differentiate the bare soil from forests or grassland, detect plants under stress and know the different crops and crop stages.
  • AVI (Advanced Vegetation Index): AVI is used to study the changes in the crops and forests over time. It helps farmers through the satellite images about the various vegetation indicators.
  • EVI (Enhanced Vegetation Index): EVI index uses additional wavelengths of light to correct NDVI errors. However, the NDVI results are very accurate in estimating crop health; there are few errors at atmospheric or ground level that affect the field results.Hence, the errors at atmospheric and ground level are corrected through EVI images.
  • SAVI (Soil Adjusted Vegetation Index): SAVI is used to correct the NDVI index for the soil brightness in areas where vegetative cover is low. Hence, with the help of SAVI to know the soil health, schedule crop irrigation, monitor evaporation, drought and transpiration of the crops.
  • NDRE (Normalized difference red edge) images: NDRE indexes are mainly used at the later growth stages of plants when they are mature and ready to harvest. It helps to know the amount of chlorophyll in the plants.
The images such as NDWI (Normalized Difference Water index) are also provided which can be used to monitor changes in the water content and help control irrigation in real time. From the satellite images, the difference between the water level in the current soil and the water level in the actual soil is discovered and the difference between each of them is calculated to address the defect. The report also includes Carbon data also known as soil organic carbon. It helps to know which part of the farm has a low level of carbon so that required treatment can be applied. The report also helps in providing time series data. Time series data gives a sequence of data points collected over an interval of time. For example, if we need the NDWI index for the past 10 days. It can easily be accessed by providing the dates. However, the data will be displayed as values change per time. It also gives precise information if needed. If a farmer having 10,000 m2 land wants to know areas having NDVI 0.6-0.7, it can easily be obtained for increasing productivity. Farmers can also have access to the field images by just knowing the latitudes and longitudes of the farmland. Apart from this the user can also request for the historical data of the area. ACHIEVEMENTS
  • Zr3i was shortlisted in top 10 finalist among 160 Egyptian StartUps for GDEXA | Mentoring and Skilling “Social Up for StartUp”.
  • Zr3i is featured on a regional level across the Arab World.
  • Zr3i is also starting digitization of the agriculture industry in Egypt with the German Government and Ministry of Agriculture.
  • Zr3i has secured a place in the list of 9 most innovative Egyptian based Companies and Startups.
  • Zr3i was announced as the Finalist at Northern African StartUp Awards 2021.