Cloud Coverage Analysis From Satellite Imagery

Cloud coverage essentially means the fraction of sky covered with clouds. In this article, we will illustrate a technique to find cloud cover percentage explicitly for beginners in image processing and discuss the limitations of the technique.

Naturally, the first question that comes into mind is why do we need to find the cloud cover percentage? Why is it so important? Lets review some of the reasons.

The most basic reason, is that cloud reflects roughly 90 percent of radiation back into space and at the same time it traps the outgoing radiation, which is known as the greenhouse effect. Hence, cloud cover has a large influence on the climate.

Climate change in turn can be the reason of natural hazards. Global warming decreases the temperature difference between the poles and the equator and hence, can increase the number of intense storms.

In conclusion, cloud cover distribution affects the weather system, heat situation of the surface, atmospheric conditions and other factors therefore, making it important for us to keep a check on it.

himalayan clouds

METHOD

Cloud cover percentage of a satellite image can be found basic python codes and a decent amount of manual work.

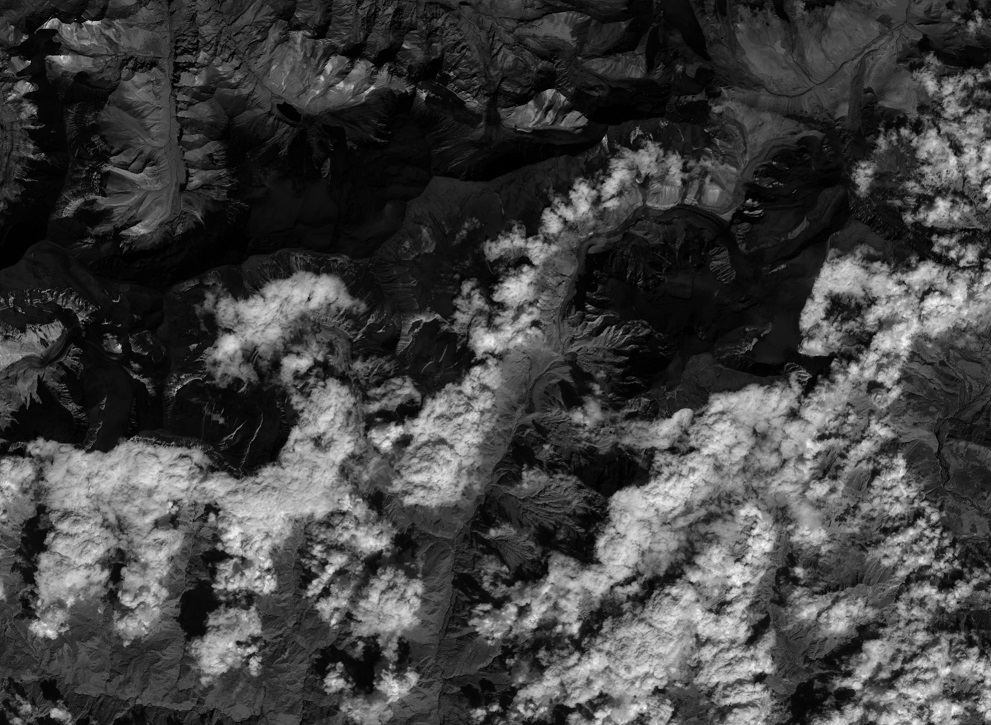
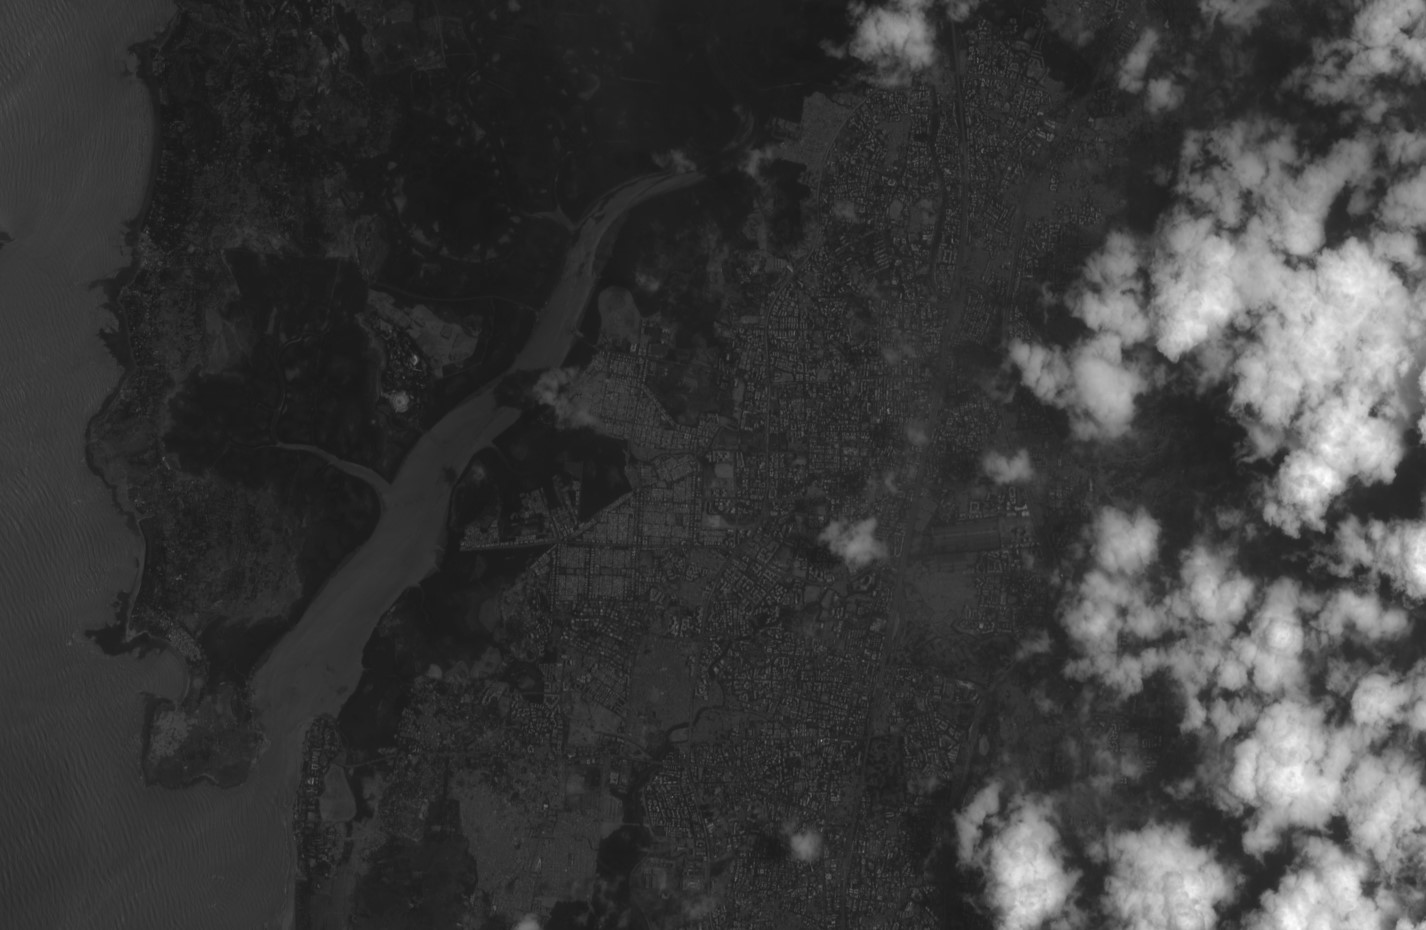
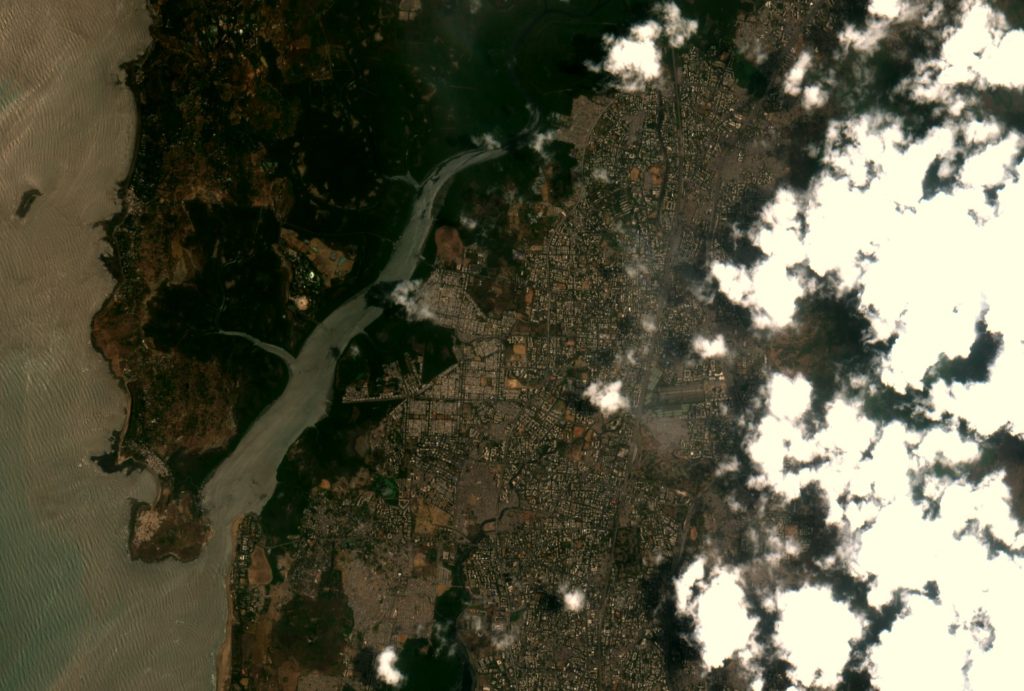
Consider a satellite image with a fair cloud coverage. First of all, we need to check the pixel values of the cloudy area in the image in order to narrow down the range of pixel values of the cloud.

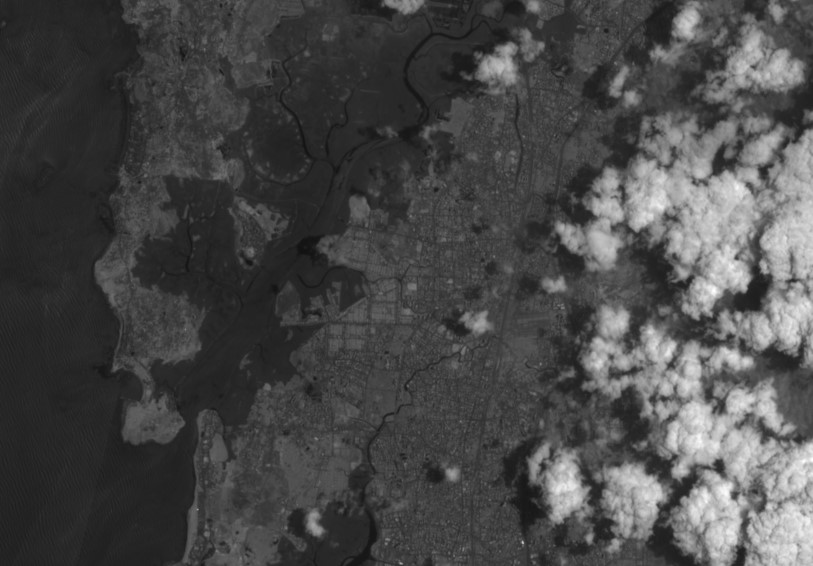
It is important to pass a grayscale image, so that instead of dealing with three values for each pixel in an RGB image, you get equivalent one pixel value in the grayscale image. Since the clouds are white in color, the closer the pixel value is to 255, greater is the intensity of the cloud.

Since the density of cloud may be thick and thin in different regions, the intensity of whiteness at different regions will be different as well. Hence, the generated pixel values are to be interpreted and we need to find the range of pixel values the cloud region lies within. The estimated upper and lower limit values will be a rough range to identify any pixel as cloudy or not.

Although this part is quite cumbersome and lengthy, it is important to find the right pixel range of cloud to get an accurate cloud cover percentage.

Once we have the range, finding the cloud cover percentage is straight forward.

Following are some pseudo codes to perform the above.

Pseudo Code #1

The program will allow user to print pixel values of a grayscale image.

#import the libraries

#read a grayscale image

#access the pixel value in the range of the height and width of the image

#print pixel values

Pseudo Code #2

2. The program will allow user to calculate cloud cover percentage

#import the libraries

#read a grayscale image

#access the pixel value in the range of the height and width of the image

#use if statement to iterate through pixel values that lie between the selected range

#add the number of such pixel values

# use the mathematical expression to find the percentage

# print the result

STUDY AND OBSERVATION

We processed the satellite images of Thaltej, Ahmedabad of 2nd june, 2018. We captured Band 3 ,Band 4, Band 5, Band 11 and ETCI image. The estimated cloud coverage of that day is 16.7579%.

We performed the operations and for each bandwidth we found out the cloud cover percentage.


After analyzing the pixel value of the image, we considered the pixel range of cloud to be between 86-255. Following are the results we calculated.


BAND

BAND 3

BAND 4

BAND 5

BAND 11

ETCI

CLOUD COVER %

16.105

15.169

14.011

20.34

27.38


The clear observation here is that we are getting varying results from each bandwidth. Since the penetration level of each bandwidth is different, we see the difference in each image. Lets go through each bandwidth briefly.


Band 3: The Green Band

It is used for imaging peak vegetation and water structures that can penetrate up to 90 feet deep in clear water.

Band 4: The Red Band

It is used for discriminating the vegetation slopes.

Band 5:

It is used primarily for imaging vegetation.

Band 11 :Thermal 2

It measures the heat of the ground instead of temperature of air. The ground temperature is often more hotter.


The idea is to go through all the results and find an estimated result. One method is that results can be referred with SWIR result to get a proper estimation. SWIR can give more accurate results as SWIR can penetrate through clouds.


 LIMITATIONS

The variation in results infers that the cloud cover technique has limitations.

Sometimes the overly bright surfaces such as some desert surfaces and sands, having higher pixel value gets considered in the cloud coverage is one reason for inaccurate result.

 The SWIR results can be referred with to get a proper estimation. The limitation here is that resolution of SWIR is low which makes this method not so ideal.

It is also possible that sometimes the darker or smaller “popcorn” clouds go undetected.

Another reason is that snow and clouds are hard to differentiate and very often results in inaccurate results.

In the next article, we will be focusing on differentiating between snow and clouds and discussing the importance and techniques to achieve the desired result.

We will keep posting about any such informative information on to our blogs, to help as many people as possible. Farmonaut is built upon a vision to bridge the technological gap between farmers and strives to bring state-of-the-art technologies in the hands of each and every farmer. For any queries/suggestions, please contact us at [email protected].

We have some more interesting articles coming up soon. Stay tuned!

Wait!!

Before that…

Follow us at:

Scroll to Top