Remote Sensing data are of different types for different use cases in agriculture. Farmonaut is providing around 18 different satellite data parameters for examining your farms. The data must be understood first to take necessary or required actions. Satellite data for different problems are:
- For crop health monitoring: NDVI, EVI, SAVI, NDRE, VARI
- For irrigation: NDWI, NDMI, Evapotranspiration, DEM
- For Cloud Cover: RVI
- For Soil health: SOC
Problem:
Majority of individual farmers in India have less knowledge on using smartphones. However, there are few farmers which own smartphones but aren’t aware of the features or operations that can be performed. Due to the lack of educated farmers it can be difficult for them to understand all the different satellite data provided by us. Imposing the use of multiple satellite images can overwhelm the early adopter of the technology.
To tackle the problem faced, Farmonaut has come up with images known as “Hybrid image/analysis.”
What is a Hybrid Image?
“Hybrid image includes all the parameters of crop health, irrigation, soil and cloud cover in a single image for easy understanding of new farmers.” Not compromising on the quality of data, the Farmonaut system processes the data into a hybrid image, making it readable and accessible. One image makes it easier for beginners to get used to the technology and understand it as well.
Need of Hybrid Image
- New farmer friendly: Analyzing multiple images for a new user/ farmer can overburden the farmer to process the needed information. Hence,
- Easy to interpret: Undereducated farmers can easily access and interpret the hybrid images rather than multiple images. The color coding analysis scale available gives a simplified explanation of the image.
- Always Handy: Hybrid images can be seen on the web, smartphone app and also can be shared.
Access and Understand Hybrid Image
Step 1: Farmers must login to the application to access the data.
Step 2: After logging, the fields already marked are seen in the My fields icon. Click on “My Fields”.
Step 3: A page showing the map opens. Select the field you want to get an image of.
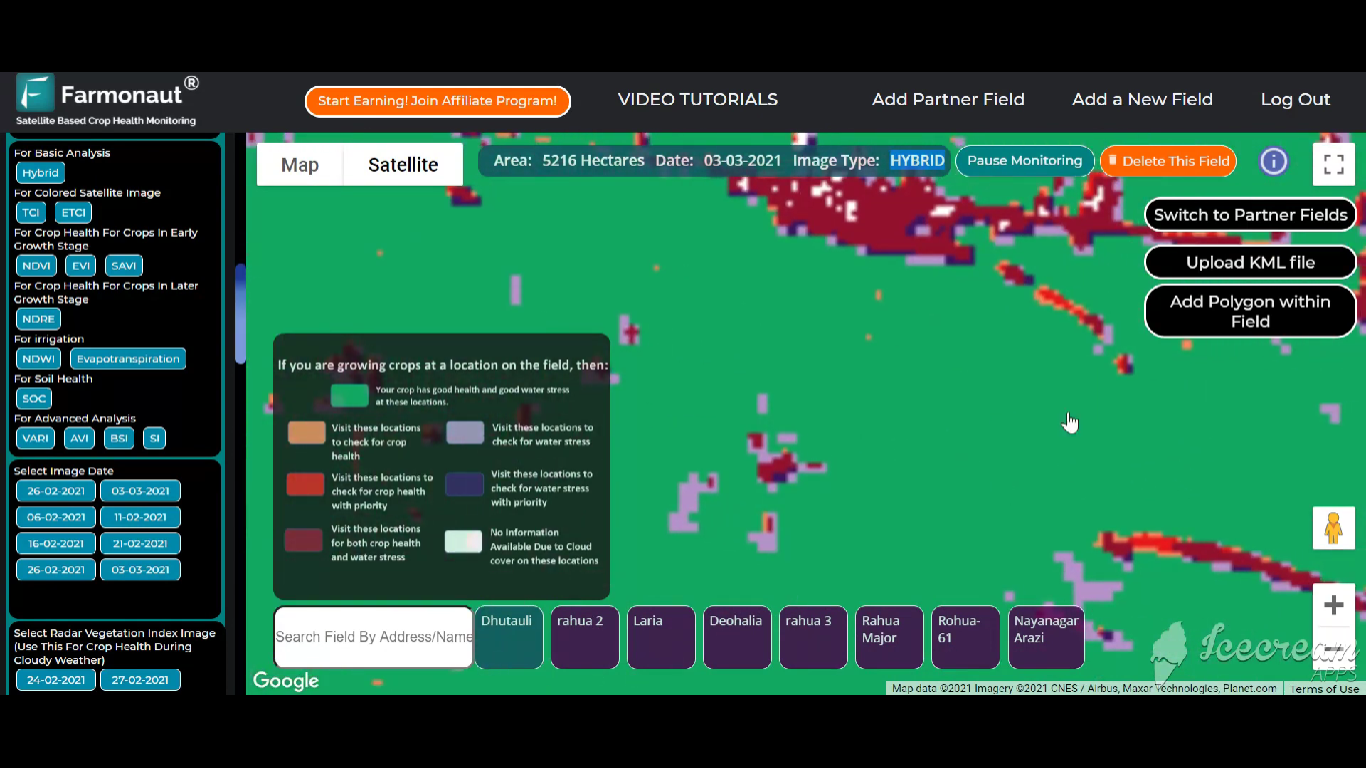
Step 4: The field visible will be shown with a hybrid image. The Hybrid image of the field is shown by default.
Step 5: The analysis scale is provided at bottom of the page as shown in figure. The analysis can be obtained in any desired language for local farmers to understand. Different colors indicate different issues caused.
Once you get along with the Hybrid images, we encourage you to use all the images and parameters provided by us for better health of your crops.
Tutorial of web app: