
Problem #1: Inefficiency due to human factors.
Problem arises when the Company doesn’t receive yield as per the efforts and investment made by them. Due to various human factors throughout the chain the estimated yield is not received by the company.
Solution: By providing satellite data to monitor farms at different levels.
Farmonaut has provided satellite data to reduce the human errors at different levels such as clusters, region and farmer level. The various satellite parameters help to track consistent actions taken on the field which examines the inefficiencies.
Problem #2: Burdensome Machinery Management at large scale.
The management issues caused are also due to human malfunction. Company’s Unawareness regarding the usage of machinery creates chaos which leads to loss in the capital invested by the company.
Solution: By Tracking each and every machinery through GPS for various data.
GPS trackers help to capture data every 10 secs and pass on to the systems. Hence, the data captured can be used for multiple benefits such as performance evaluation, to know oil usage, work done, capacity of machinery, etc.
PROBLEMS & SOLUTIONS
Farmonaut has been providing solutions to farmers and businesses at large scale to solve different problems faced in the agriculture sector.
We have managed to monitor over 10 million hectares of land world-wide and mapped over 1 lakh farms globally benefiting more than 50,000 farmers.
We are also working with 25+ large scale businesses including Coromandel International, Torforte Innovation based in Australia, Zr3i.com in Egypt, ITC, Godrej Agrovet, Mulpuri Group and many more.
ABOUT US
Satellite data captured are being processed and segregated by the Farmonaut system which makes them easy to understand. Monitoring large numbers of farms can be inaccurate and tedious. The Farmonaut system captures the data and generates reports according to the clusters. The dashboard, data and reports can be obtained in Uzbek language which makes it more convenient for the locals.
WHY FARMONAUT..???
SATELLITE BASED CROP HEALTH MONITORING:
It is a technique which helps companies to manage and organize their vehicles. In order to manage machinery Farmonaut provides a system which monitors and tracks each and every machinery.
How does it work?
GPS devices are installed on each and every machinery of TTG. The devices are connected to Farmonaut’s servers. The data is captured by devices and it is received on the server every 10 seconds. There are many different parameters that are captured by the devices such as Coordinates (Latitude Longitude), Speed, Angle, Stopped or Working, oil container is open or not, etc.
- FLEET MANAGEMENT
- Field mapping
- Mapping of farms at large scale can be done with ease and accurately.
- Soil carbon content
- Soil carbon content tracking for better yield and knowing status of necessary actions taken in the soil.
- Satellite based soil health monitoring
- Timely data on diseases and pests would help n tracking whether the required inputs have been given or not.
- Crop area estimation
- It can be helpful to know the areas under which crop is sown and make decisions on contract farming regarding capital and machinery.
- Identifying location requiring irrigation
- Helps to know the location where irrigation is required and track the actions taken by farmers.
| FEATURES | USE |
| Interface to plan jobs for machine based on needs | Can get an expertised driver for a particular region.
Helps in job management effectively |
| Choose accessories for a particular machine. | Can pick equipment as per pocket allowance and based on requirement. |
| Interface for performance tracking based on machine type. | Helps in inventory management, market predictions and knowing future requirements. |
| Dashboard in Uzbek Language | anyone can easily understand. |
| Assigning team member for each machine | Can evaluate performance in different work domains. |
| Estimation of machine capacity. | Helps in overall performance and requirements for long run viability. |
| Generated cumulative data | Helps in estimation of optimal machine performance. |
| Day-to-day data entry datasets | Know underperforming machines
Helps in comparison of planned and actual work |
| Booking machines by our farmers by Android | Easy to book. |
| Introducing payment plans or accounts | Helps in account management of organization |
| See performance of clusters and individual machines. | Helps in evaluating performance at macro level for resource allocation and tackle unforeseen situations. |
| Fuel consumption monitoring | Stops any false reporting or incorrect strategies used by humans. |
Advanced features provided as well as proposed by Farmonaut for Fleet management:
The motion tracking feature and the parameters tracked helps to create insights/visualization of the machinery used on the dashboard as follows:
- Track real-time location of farm machine updated every 10 seconds.
- Track total distance covered by machine on a given day.
- Track total number of hours machine was running.
- Track current speed, maximum speed and average speed of machine.
- Track number of farms visited on a particular day.
- Track the amount of time spent by machine on each farm.
- Track entry time and exit time of the farm machine on each farm it visited.
- Track area of each individual farm.
- Time lapse feature backtracks the path machine travelled through.
- Maintain an accounting record of each field at which machine went.
- Access to the historical data of the machine.
- GPS devices work on any power operated machines.
- Home location fencing.
| Maintenance records of all vehicles and accessories with its expenses. | Helps to know market trends and identify problem areas. |
| Monitor driver attendance and work performance | Helps in effective management of payroll and manage schedules. |
SERVICES CARRIED OUT FOR TTG

For the month of July and August in 2022 for cotton farming, Farmonaut has mapped and monitored 8800 farms contributing to over 2 lakh+ hectares of land. The reports for which were generated through satellite visits every 5 days. Around 12 reports were generated throughout the period of 2 months which were in English and Uzbek language.
Farmonaut has also created a custom account for TTG on the Farmonaut’s platform for access of the data throughout the period.
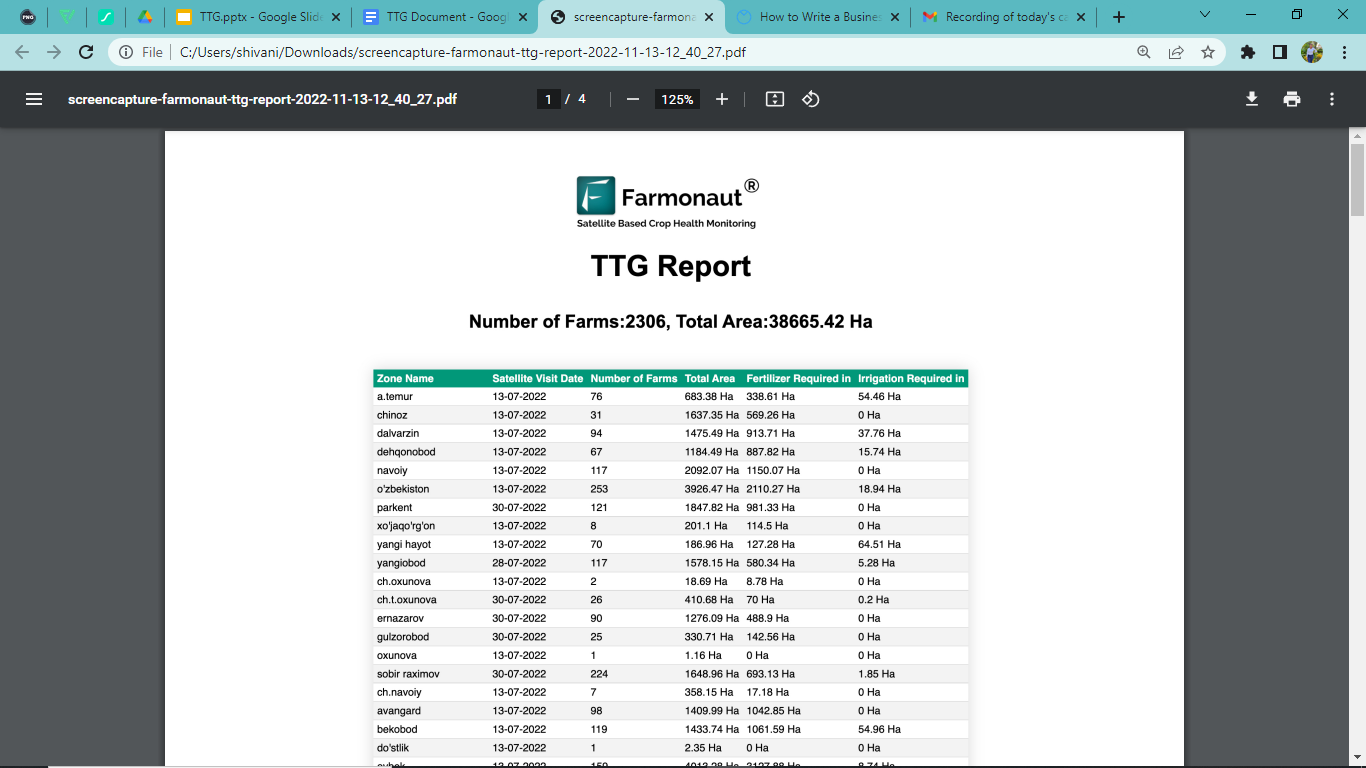
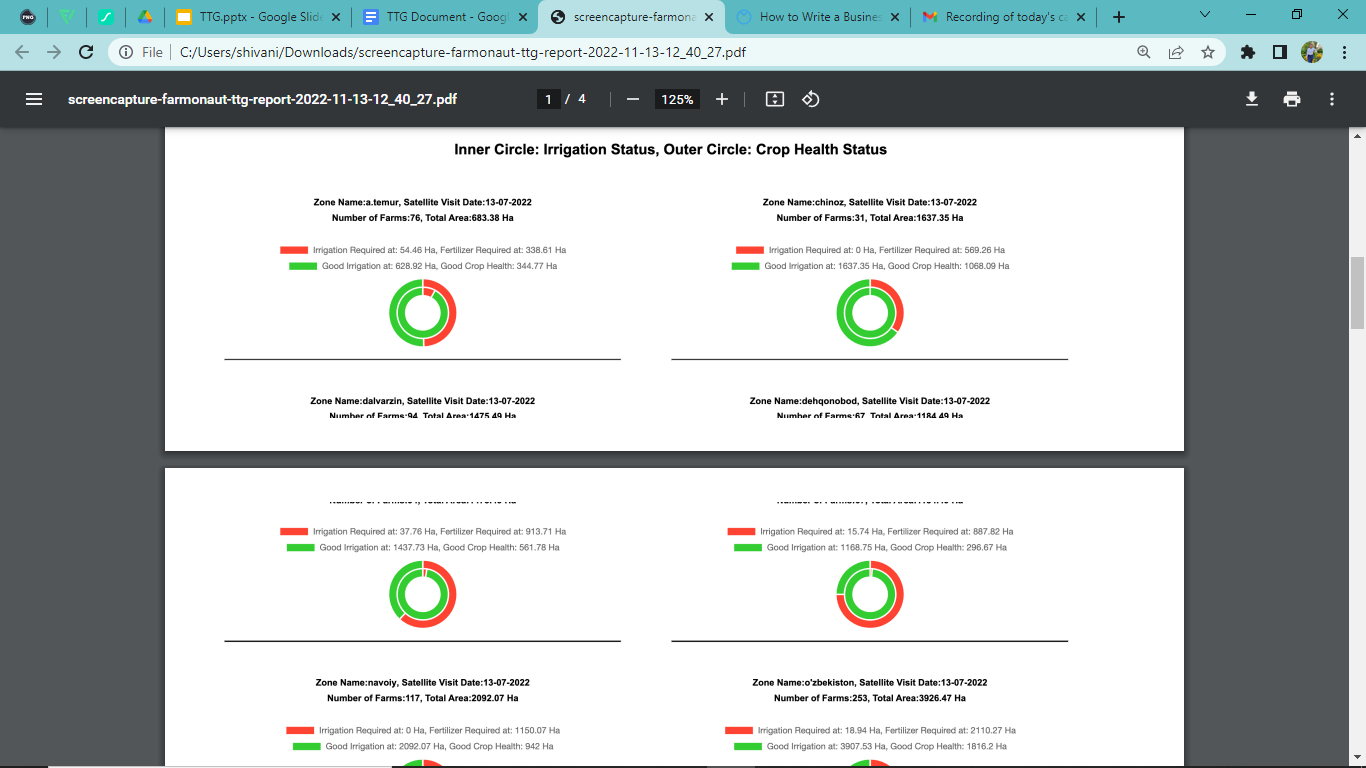
Farmonaut has also created a customized page to access the report in infographics format as shown below.
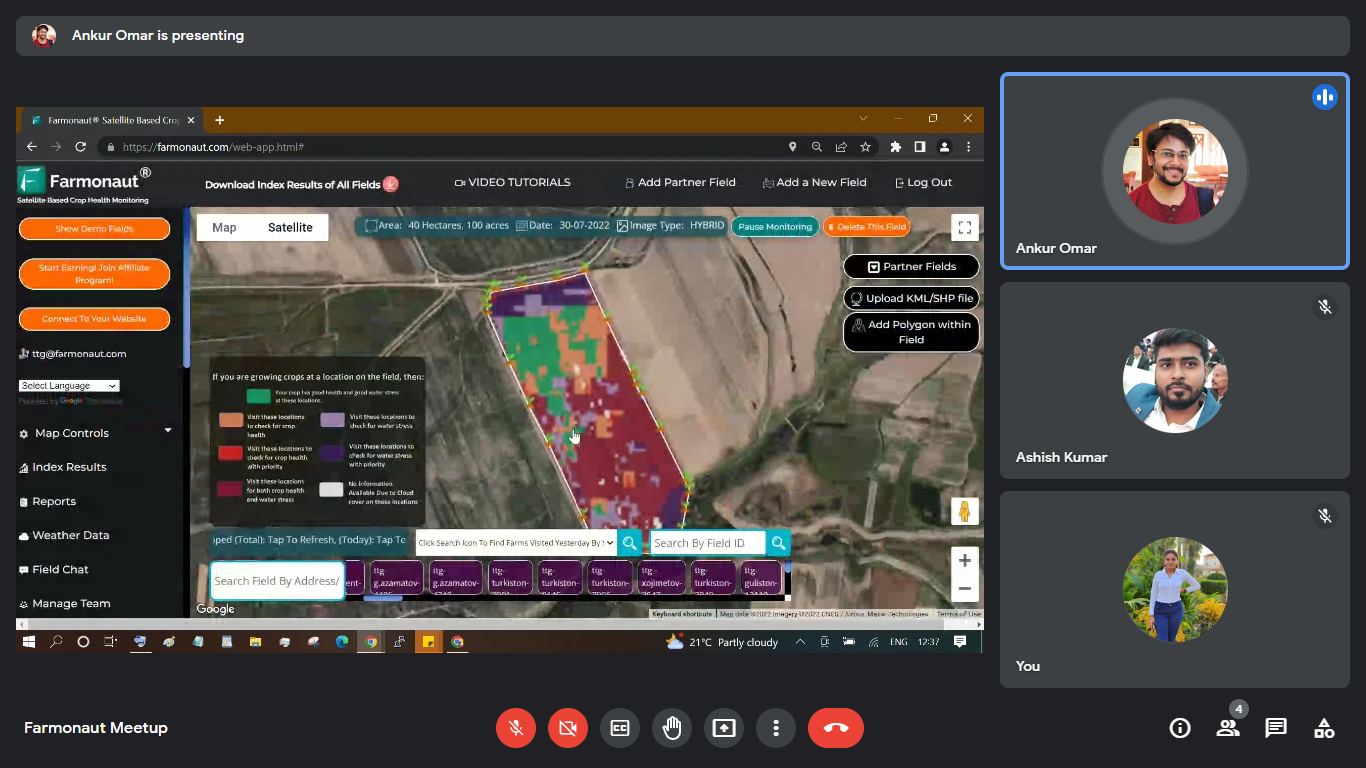
Dashboard in English Language
Dashboard
The dashboard is provided in the Uzbek and English language. It contains various satellite images for crop health, irrigation, soil carbon, etc. the reports for clusters and individual farms can be accessed through the dashboard.
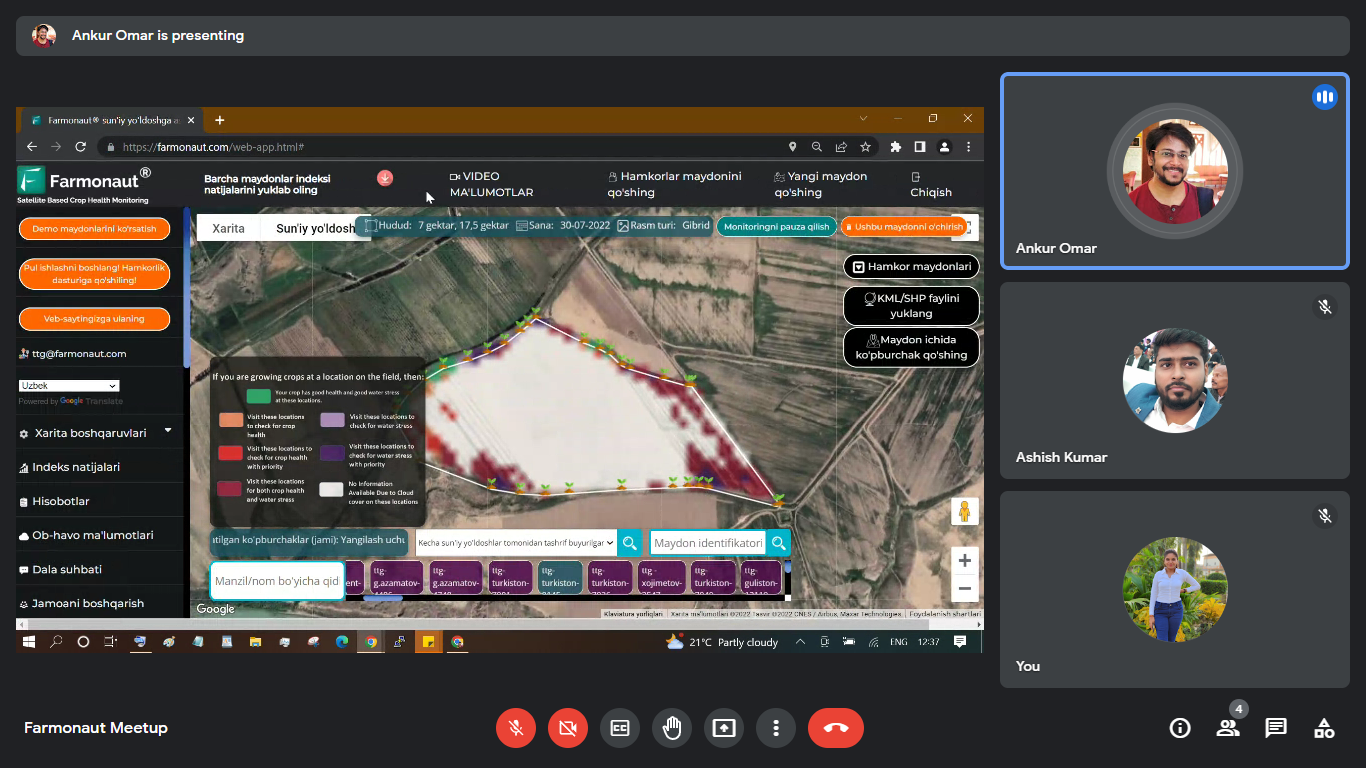
Dashboard in Uzbek Language
Excel Reports
The Excel reports are generated by the system automatically. The parameters obtained in reports are:
- Total Area covered
- Total Good area
- Total Bad Area
- Irrigation required
- Fertilizer required
The report generated is colour coded in red for the data which requires irrigation, fertilizer or are in bad condition.
Farm reports can be downloaded in Uzbek language for easy understanding. The report contains all the satellite images and weather data obtained from weather stations.
Individual Farm Report
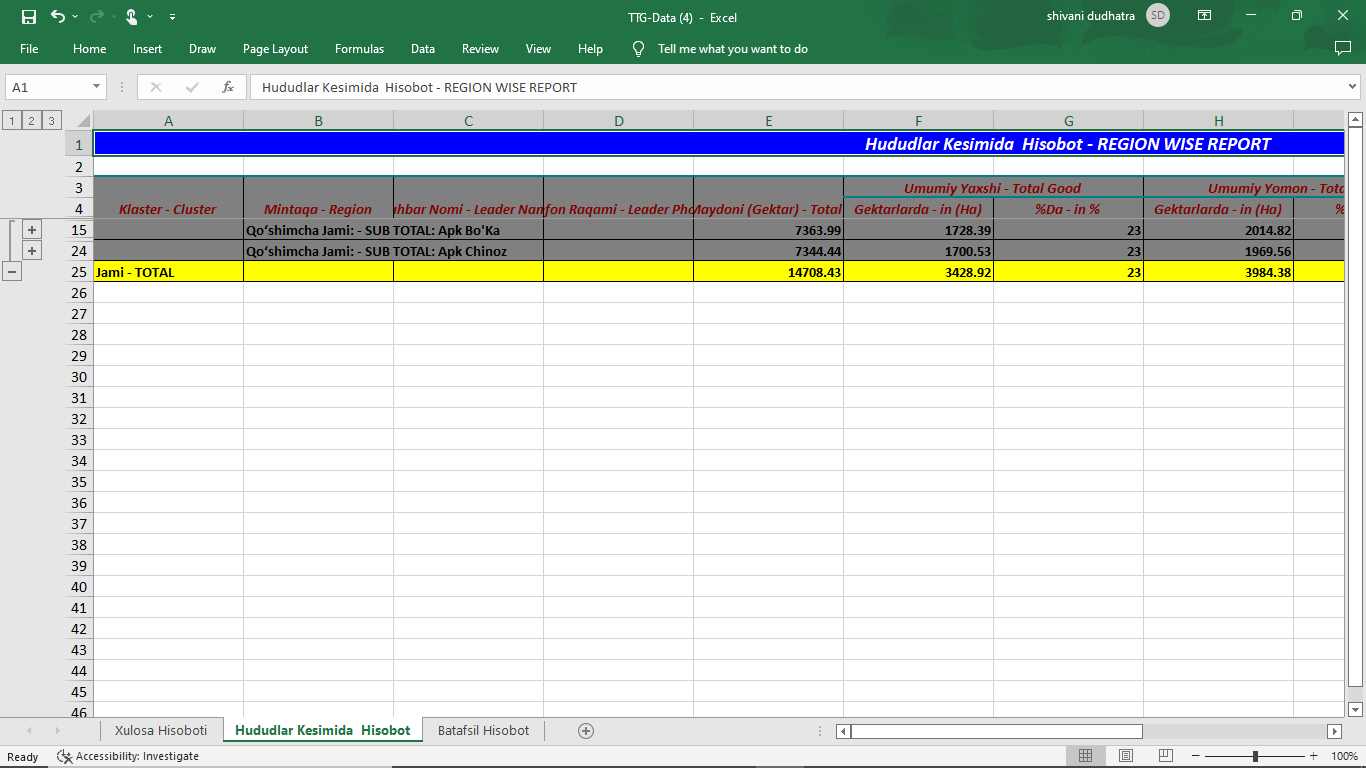
2nd sheet of Excel Report
2nd sheet: the clusters are segregated into regions. It also contains information on region leaders and contact.
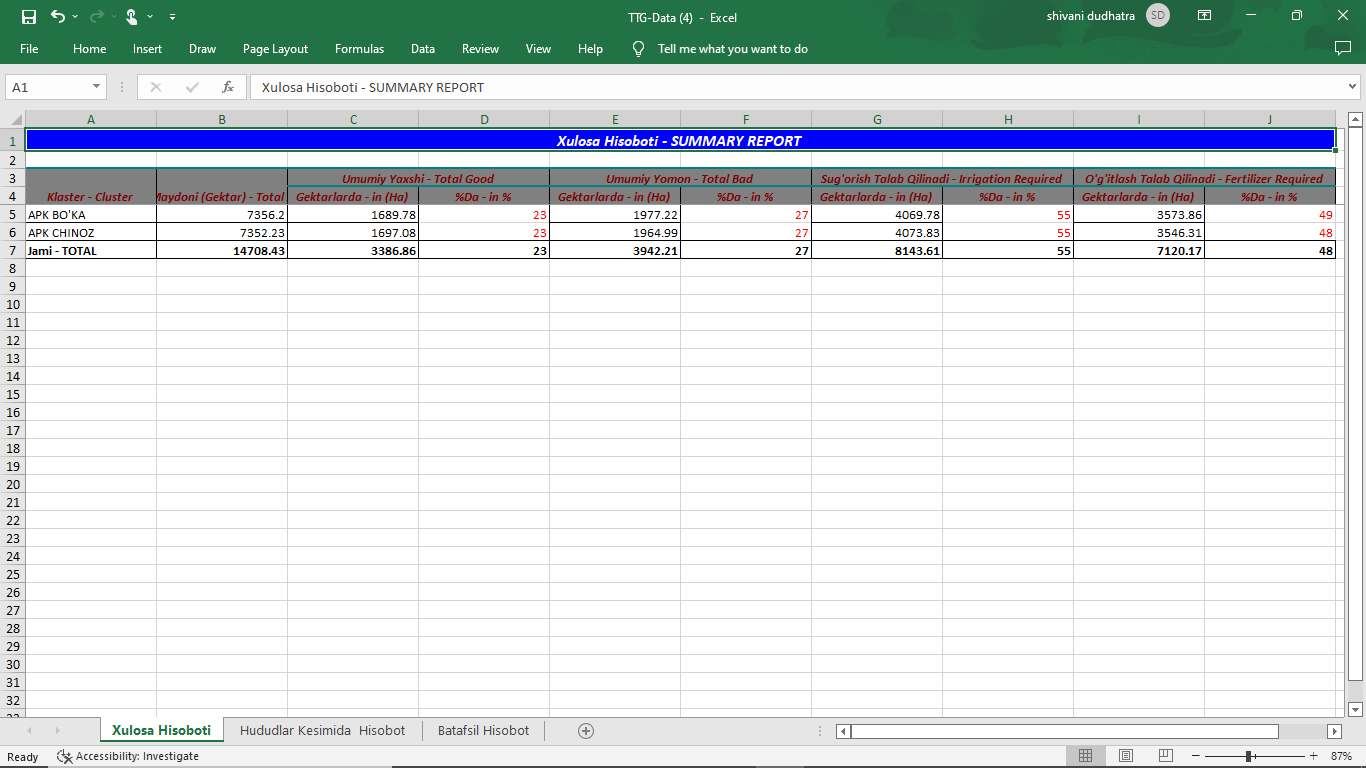
1st sheet of Excel Report
The excel report contains 3 sheets which includes all above mentioned parameters:
1st sheet: shows data of individual clusters collectively.
3rd sheet of excel report showing individual farmers
3rd Sheet: Each individual farm is mentioned under the particular regions. It contains all the information of individual farmers and region leaders such as contact Number. To know the area of an individual farm, the 1st column of the sheet has a Link to Farm stating “See Farm on Map”. It directs the user to the Farmonaut map showing the satellite image on map.
2nd sheet showing Regions expanded
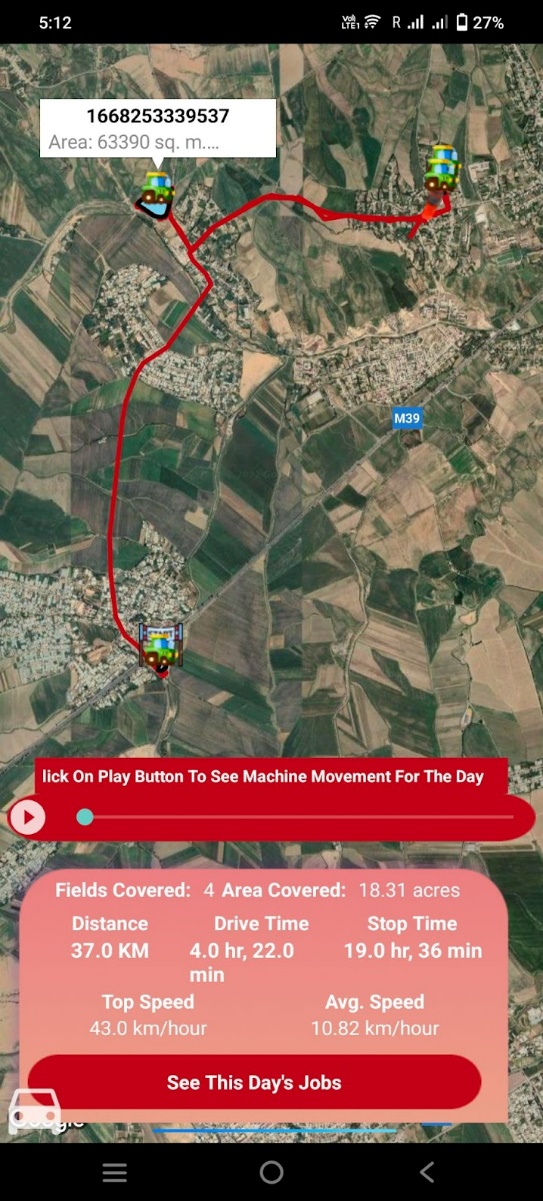
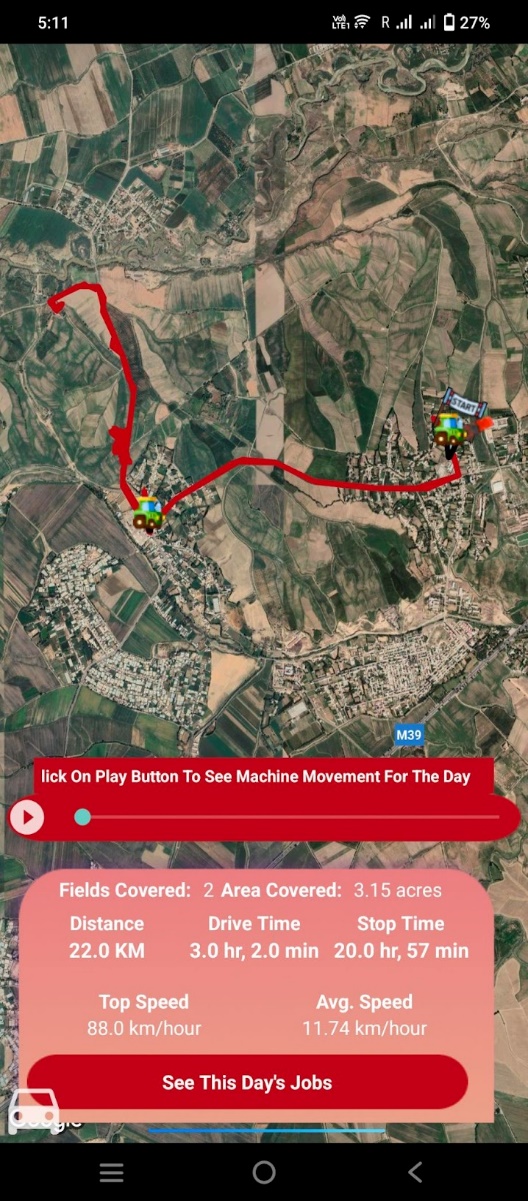
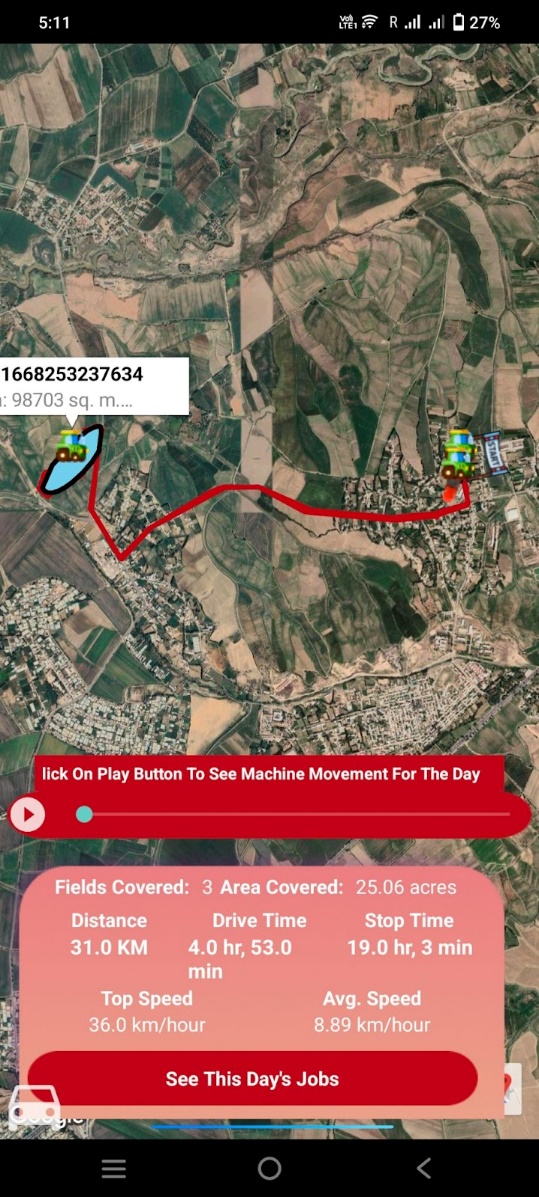
Fleet Management for TTG
Farmonaut has configured a TTG machine for a period of 2 months (July – August 2022). The device installed tracked the machine on daily basis. The testing carried out is still observation and Farmonaut servers still received data on daily basis. The below images show machine tracked. Also, Farmonaut has incorporated the advanced feature as proposed. Hence, we are ready to carry on the work.
Importance / Benefits to TTG
- Can cross verify with farmers for authenticity of action taken on farms for improvement of yield.
- Know areas where irrigation/fertilizers are required.
- Track the chain for knowing at what stage error has occurred.
- Helps in making decisions whether to grant investment to individual farmers.
- Decreases the inefficiency caused by human factors.
- Reports are concise and centralized for trouble-free at macro-level.
- Can access data from cluster level to Farm level.
- INVESTMENT + EFFORTS + TECHNOLOGY = INCREASES YIELD OUTCOME
WHY USE FARMONAUT?
|
|
With Traditional/Manual method | With Farmonaut |
| No. of farms | 8800 farms | 8800 farms |
| Average time required to survey per farm | 15 minutes (0.25 man hours) | 1 minute (0.017 hours) |
| Visits per farm per month | 6 visits | 6 visits |
| Hours required to survey 8800 farms | = 8800*0.25*6
–> 13,200 man hours/ month |
= 8800*0.017*6
–> 900 hours/ month |