On the 3rd of May,2019, Odisha witnessed the strongest April cyclone in 43 years. With winds of more than 200 kmph, Cyclone Fani took over 64 lives and affected the lives of over 1.6 crore people in roughly 18,388 villages and 51 towns.
WHAT MAKES IT DIFFERENT? The disastrous storm started to develop around the equator and moved upwards. It was supposed to hit Tamil Nadu, according to the IMD prediction but the cyclone Fani changed its course and traveled a longer time over the Bay of Bengal, resulting in the increased strength of the cyclone. The cyclone finally made landfall in east India, specifically in Puri , Odisha at 8 am, also affecting Kendrapara, Bhubaneswar, Cuttack, and Khurda. It gradually made its way to Bangladesh which forced the evacuation of over 5 lakh people.
TOTAL LOSS The state government of Odisha estimated a loss of Rs 12,000 crore. About 5,00,000 people have lost their houses and would need reconstruction.
Cyclone Fani uprooted over 10 million trees in total and damaged at least two million trees in Bhubaneswar alone.
The Balukhand wildlife sanctuary , which was home for over 4,000 spotted deer, a large number of wolves and lizards have lost over 4.5 million trees. However, there is no report of large-scale wildlife loss from any other affected districts so far.
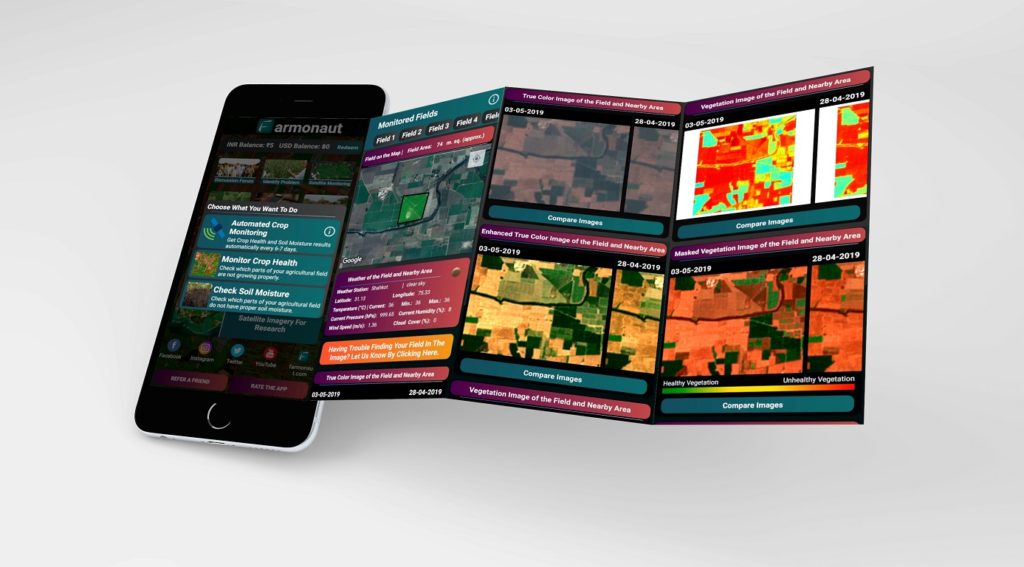
SATELLITE IMAGERY
Cyclone Fani has proved to be profoundly unique from other cyclones which led us to analyse the affected areas of the East India coast line. For the same, we gathered satellite imagery accessible through our website (https://farmonaut.com/satellite-imagery) for two different locations which were the most affected during the cyclone. To perform these observations, we retrieved images of the following bands:
3. MNDVI: Masked Normalized Difference Vegetation Index, Resolution: 10 m
4. NDWI: Normalized Difference Water Index, Resolution:
20 m
3. MNDWI: Masked Normalized Difference Water Index, Resolution: 20 m
KHURDA
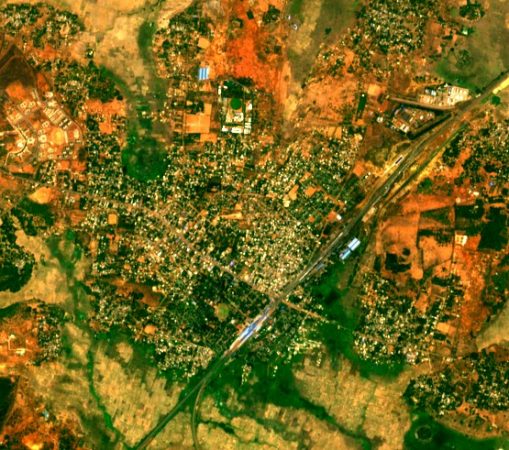
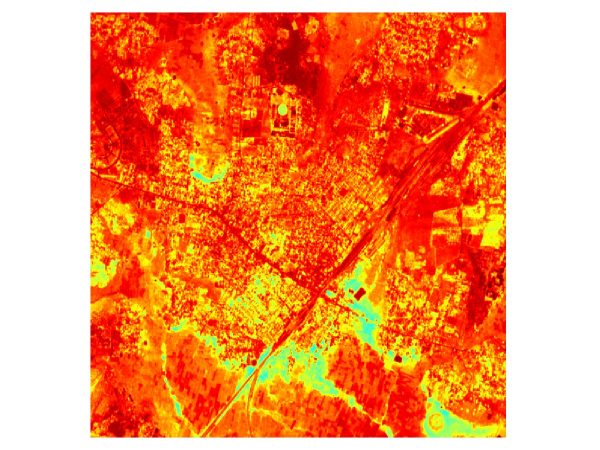
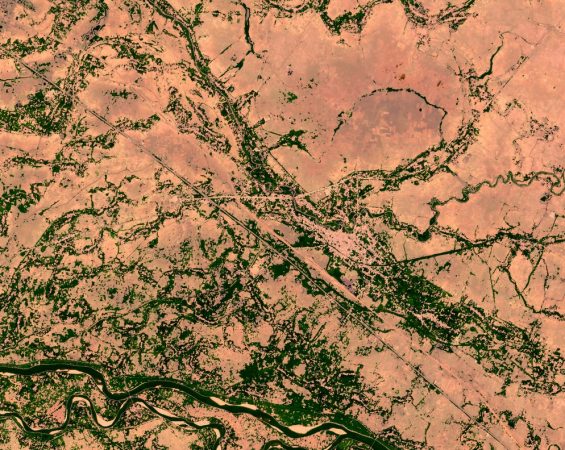
For Khurda, we processed the satellite images from 23rd of April till 8th of May to study the impact of the cyclone. The processed images helps enumerate the total loss and realize the scale of devastation.
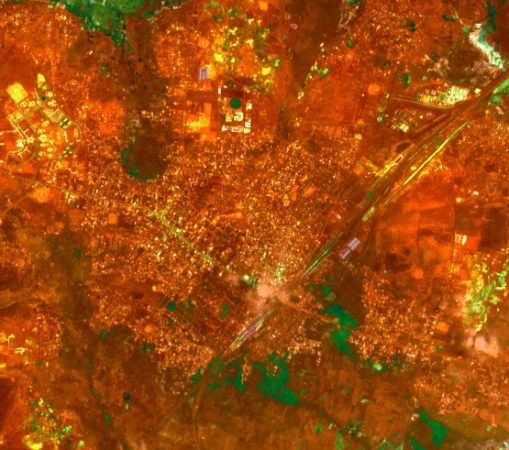
LEFT TO RIGHT :23rd April to 8th May -ETCI
23-April-2019
28-April-2019
08-May-2019
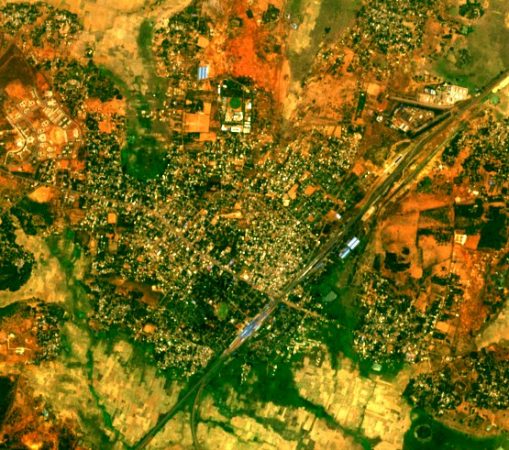
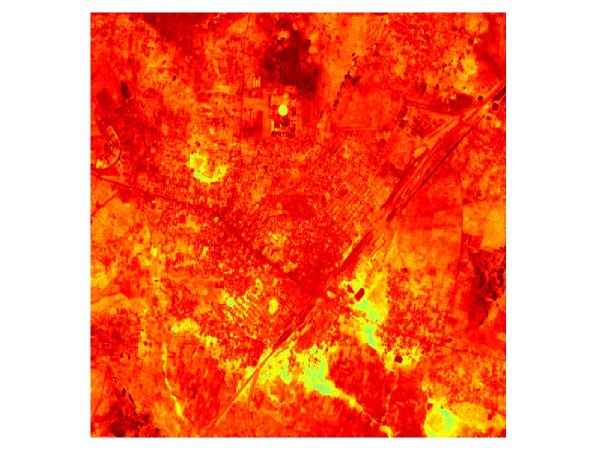
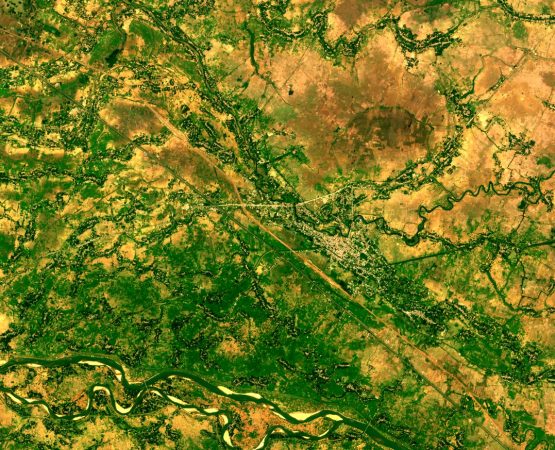
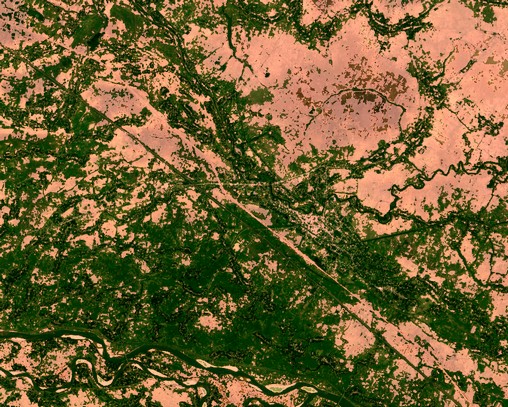
LEFT TO RIGHT :23rd April to 8th May -NDVI
23-April-2019
28-April-2019
08-May-2019
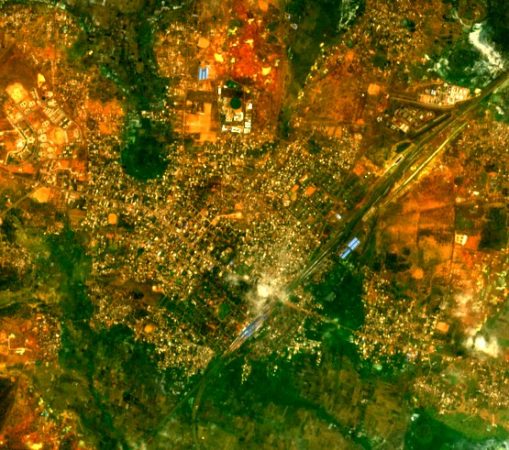
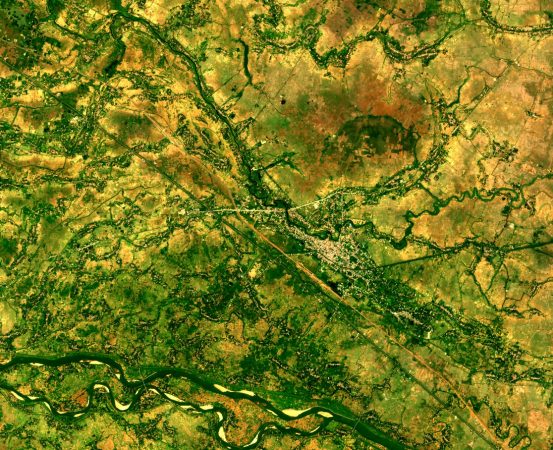
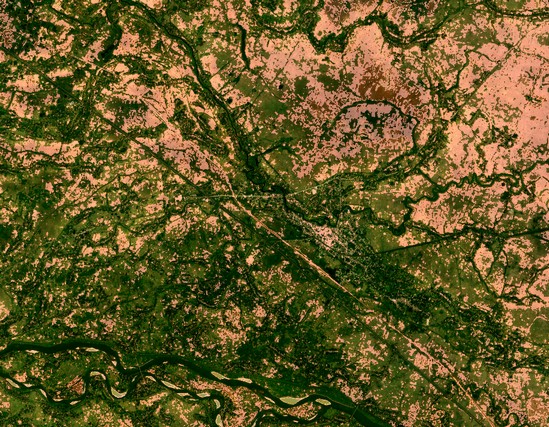
LEFT TO RIGHT :23rd April to 8th May -MNDVI
23-April-2019
28-April-2019
08-May-2019
The green colour in the above images indicates vegetation and the red represents construction and material objects. In the rightmost image we can, very distinctly, notice a lot orange and green at the bottom and some on the top is replaced with brown which represents the destruction of vegetation and construction. This is the purpose of satellite imagery, it is the key to tally the loss in the area after the hazard.
We also processed the images of Kendrapara district, to gather more information about the land.
KENDRAPARA
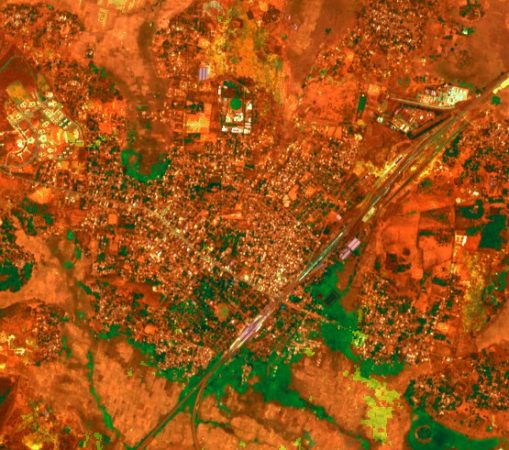
LEFT TO RIGHT :25th April to 15th May -ETCI
25-April-2019
15-May-2019
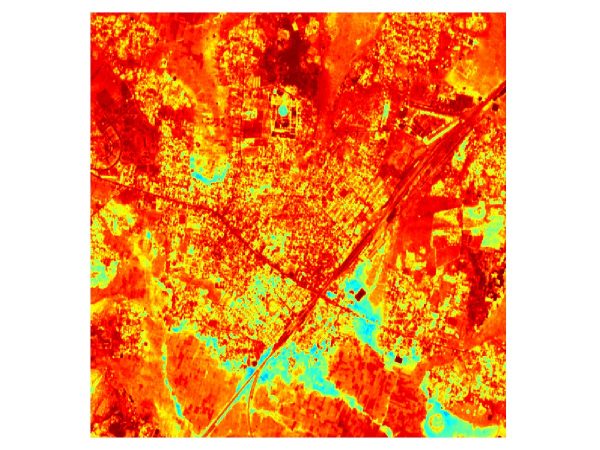
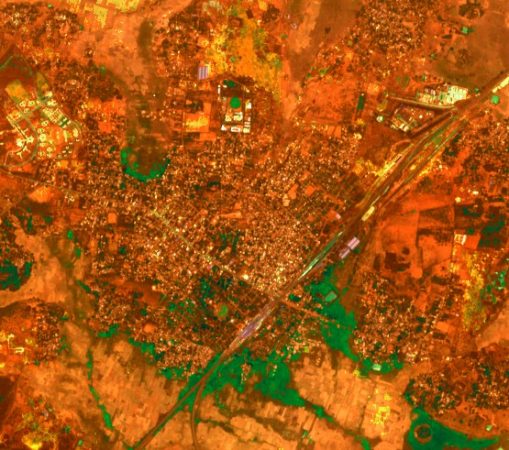
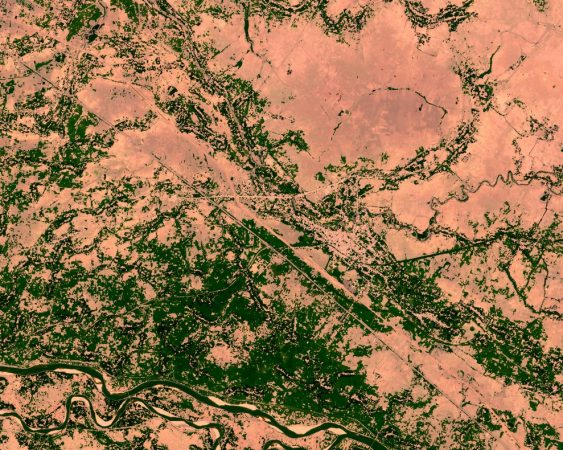
LEFT TO RIGHT :25th April to 15th May -MNDVI
25-April-2019
15-May-2019
In the above images, the green colour represents the vegetation. We can observe in the bottom left corner of the rightmost image i.e after the cyclone, the green colour has faded noticebly which means that area suffered huge vegetation loss.
LEFT TO RIGHT :25th April to 15th May -MNDWI
25-April-2019
15-May-2019
In the above set of images, the green colour represents the water content in the land. The colour green has increased remarkably in the rightmost image which indicates that after the cyclone has occurred, the water content in the land has increased by quite a lot.
WHAT DID THE GOVERNMENT DO?
Around 8 lakh people from low-slung area of Odisha were evacuated before the cyclone had occurred. The helicopters were deployed by the government to enable aerial rescue and for immediate help. Because of inaccessible road connectivity helicopters were responsible for providing relief materials such as food items, medical aid and clothing in inaccessible areas.
Cyclones are common in many coastal areas and quite disastrous. Since precautions against a natural calamity is limited , it is necessary to develop proper plans to reduce the intensity of the destruction. This is when remote sensing comes into picture.
WHAT IS REMOTE SENSING, GIS AND GPS?
Remote sensing and geographic information system(GIS) is an organizing technology used to gather information. Remote sensing and spatial analysis is an effectual way to gather information from previously occurred hazard and implement plans based on that information.
WHY REMOTE SENSING TECHNOLOGY?
• We can obtain vulnerability and risk maps of a calamity that has already happened. Using them, we acquire enough information on which vulnerable parts has less or no cyclone shelters so they can be prioritized to reduce damage of lives and property in the future cyclones.
• It helps find the critical area during hazard which reduces the response time , hence reducing damage.
• The satellite images and aerial shots provides synoptic overview for a wide range of scales. The satellite provide regular images and can be used to detect early stages of the cyclone.
• It helps to monitor the occurrence of the cyclone. GIS or geographical information system is then used for planning evacuation routes and emergency rescue shelters.
• GIS and Global Positioning Systems (GPS) is use to study the left behind damaged area and the information gathered is used to suitably plan and build the disaster prone area accordingly.
Natural hazards are always disastrous and mostly unpredictable. Although hurricanes and cyclones can be tracked one day before they hit the land, it is virtually impossible to predict earthquakes. There is always a need to understand every natural hazard that occurs, and prepare for the next one.
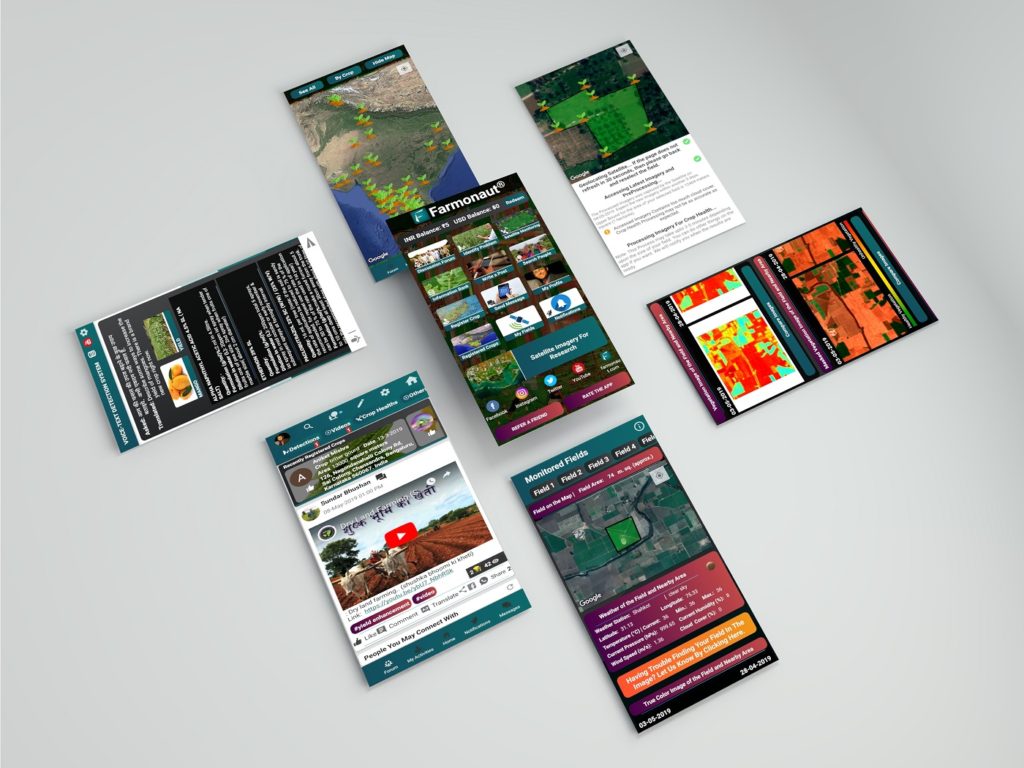
The app is available for android on Google PlayStore:
We will keep posting about any such informative information on to our blogs, to help as many people as possible. Farmonaut is built upon a vision to bridge the technological gap between farmers and strives to bring state-of-the-art technologies in the hands of each and every farmer. For any queries/suggestions, please contact us at [email protected].
We have some more interesting articles coming up soon. Stay tuned!