AI and satellite intelligence for mineral exploration
Satellite Mineral Detection& AI Mineral Exploration
We turn a mining license area into a ranked list of promising, priced exploration targets using AI and satellite data. We combine satellite mineral detection, geological mapping, 3D modelling, drill targeting, and early mine planning — all before any drilling begins.
90% accuracy on ranked zones · 100% reliable delivery ·
clients report savings of USD 25,000–100,000 and up to 6 months per license.
Berks Gold LimitedNanita Company LimitedEnergy and Resources LtdDenkyira Nkoranza ConcessionMwerezi Minerals Company LimitedRiverside Resources LimitedRamani Investments LtdAfrican Venture Partners HoldingComfix & Engineering LimitedCritica Metals LimitedImperial Impex FZECongo Mining SolutionsCIMISCO SARLViahara MiningMining SARLSenGold Invest SASSahel Shipping SASania CorporationSahara MiningEnterprise TakreemSean Mining LimitedSMA Investments LtdNTS Group (Pty) LtdKlusetic Mining InvestmentsMine4AfricaTimestream MiningLithspo Minerals LimitedMulopwe Metals Mining LtdRains of FavourTintina Mining GroupHuckleberry Garnet LLCProcess Metrology LLCWSP Investment CompanyDalgety Minerals Pty LtdVortex Minerals Pty LtdSwati MineralsFaith At Work (Pty) LtdGeotech Mining Solutions plcVulcan International LimitedKidepo AssociatesGKY MiningAlkimy SARLDouble A TradingTipareth MinesGeoticgyGemSprout Metals LimitedSouthbridge & Wess PDC LtdQader GroupIleys General TradingSG Gold Mining LLCVRV Global Pte LtdOmsri International FZEMineral Gulf Transhipment DMCCG.I.T.T.Jaunita Erss LtdAlmosi SARLSRK Consulting
Global presence
33 countries,391,956 acres delivered
Shading represents the number of acres analysed in each country through paid satellite mineral exploration engagements. Africa remains the core market, led by Ghana, Tanzania, the DRC and Zambia, while Asia, the Americas and Oceania are the fastest-growing regions.
Premium+ is the most popular choice, as drill targeting and economic modelling make the results more actionable for exploration decisions.
Both report tiers deliver 90% accuracy on ranked target zones and are designed to support exploration ahead of a JORC or NI 43-101 resource estimate — not replace a formal resource estimate.
Premium
A complete satellite mineral exploration assessment
Ranked Exploration Targets from fused multi-sensor data
Best for — early-stage mineral exploration, prospect validation and investment screening
Premium+
Everything in Premium, plus drill and mine-plan intelligence
TargetMax™ drilling intelligence — optimal angles and depths
Interactive 3D subsurface and vein-structure model
Regularised economic block model with confidence codes
Synthetic drillhole database for programme design
Conceptual pit shell, grade–tonnage curve and LOM schedule
Monte Carlo economics with P10 / P50 / P90
Host-mineral distribution map for precise targeting
Export packages for Leapfrog, Vulcan, Surpac and Datamine
Best for — drill planning, pre-feasibility scoping and high-confidence exploration targeting
Add-ons
White-label reporting under your own name and address
Report translation into the language of your jurisdiction
GIS layer and CSV / GeoJSON data delivery
Surpac STR / DTM and DXF-DWG geological models
Drilling-angle and 3D modules bought on their own
Phased delivery across a multi-license package
All add-ons have been delivered on live engagements — not a wish list.
Minerals & engagement
23 minerals. 4 steps.5 days.
Below are the 23 minerals clients have already paid us to identify. But the technology is mineral-agnostic — anything with a distinct spectral or geophysical signature can be targeted. You provide the exploration license or the concession boundary. We analyse the area and tell you what minerals are likely present, where to drill, and what the potential value could be. The process works for both greenfield and brownfield projects, without requiring a field crew, drone survey, or drilling rig to get the initial exploration results.
The platform can analyse any mineral target with a detectable spectral or geophysical signature — including rare-earth elements, nickel sulphide, quartz, gypsum, dolomite, epidote, rhodium, palladium, and others beyond the current list.
New mineral targets require calibrating the spectral library and relevant geological, density and recovery parameters, then running the same exploration pipeline. Whatever the mineral, we can analyse it.
72 of 189
exploration projects are non-gold
4 steps, delivered inside 5 days
01
You send
The coordinates, a KML / KMZ / GeoJSON file, or the license or concession boundary — along with the country and target minerals.
02
We select the data
We pick multispectral or hyperspectral satellite data and the radar, thermal, magnetic and terrain layers your geology needs.
03
We analyse
Machine-learning multi-sensor fusion produces a per-pixel prospectivity index, a grade model, deposit-type classification and tonnage.
04
You receive
A PDF report, georeferenced maps (KML / GeoTIFF / GeoJSON) and — on Premium+ — 3D models and a conceptual mine plan.
Under 5 days
Standard delivery
Same week
Boundary in, report out
Any size
Single license to portfolio
No drilling
Drones and field crews not required
Turnaround runs from receipt of a usable boundary. Multi-license portfolios are delivered in phases inside the same window.
Already have a license or concession boundary? Put it on the map and start the four steps above.
Satellite imagery for mineral exploration:eight sensor families, matched to your mineral list
No satellite can directly “see” gold underground. Instead, we combine data from eight sensor families — optical, SWIR, radar, thermal, magnetics, terrain, hydrology and land cover — to create a single mineral prospectivity index.
We then match the analysis to the minerals being targeted: multispectral data for broad mineral screening, and hyperspectral data when more detailed spectral signatures are needed to distinguish minerals that look similar in standard satellite imagery.
Best for — rare earths, trace elements and precise mineral speciation
Where the bands actually sit
See the method on a real report
One ranked zone, opened up end to end — which bands fired and why, how the prospectivity score was built, and what the finished report says about grade, depth and tonnage.
Send us the project boundary and the minerals you’re targeting. We’ll come back with the scope, price and expected delivery timeline — within one working day.
Mineral exploration software:9 tools, one browser tab
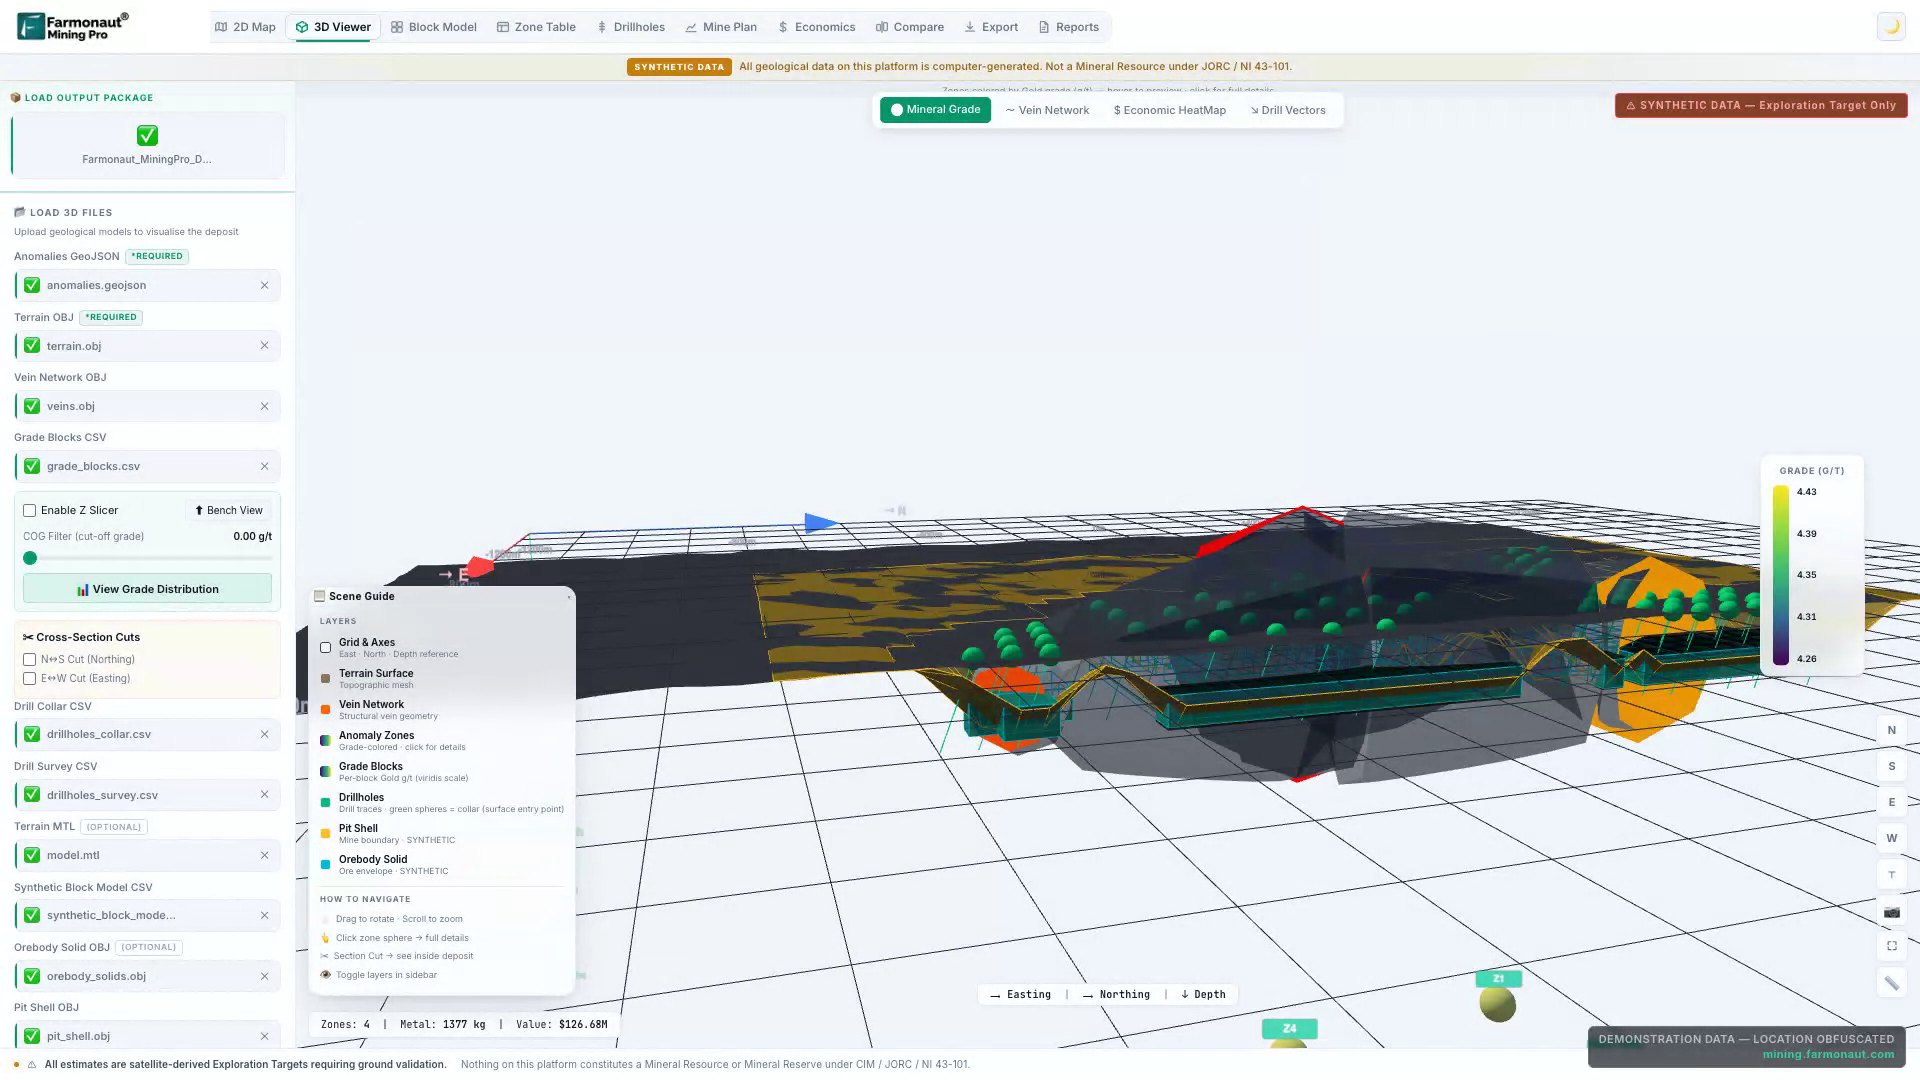
The same technology behind our exploration reports is available as browser-based mineral exploration software. More than 100 mining businesses across 25+ countries use Mining Pro to manage and analyse their exploration work — with no installation or GIS software license required.
On Premium+, the platform goes beyond identifying mineral anomalies. It supports economic block modelling, drillhole databases, floating-cone pit-shell modelling, and life-of-mine scheduling — taking a project from exploration targets to early-stage mine planning, all in one place.
The 9 tools
012D Map
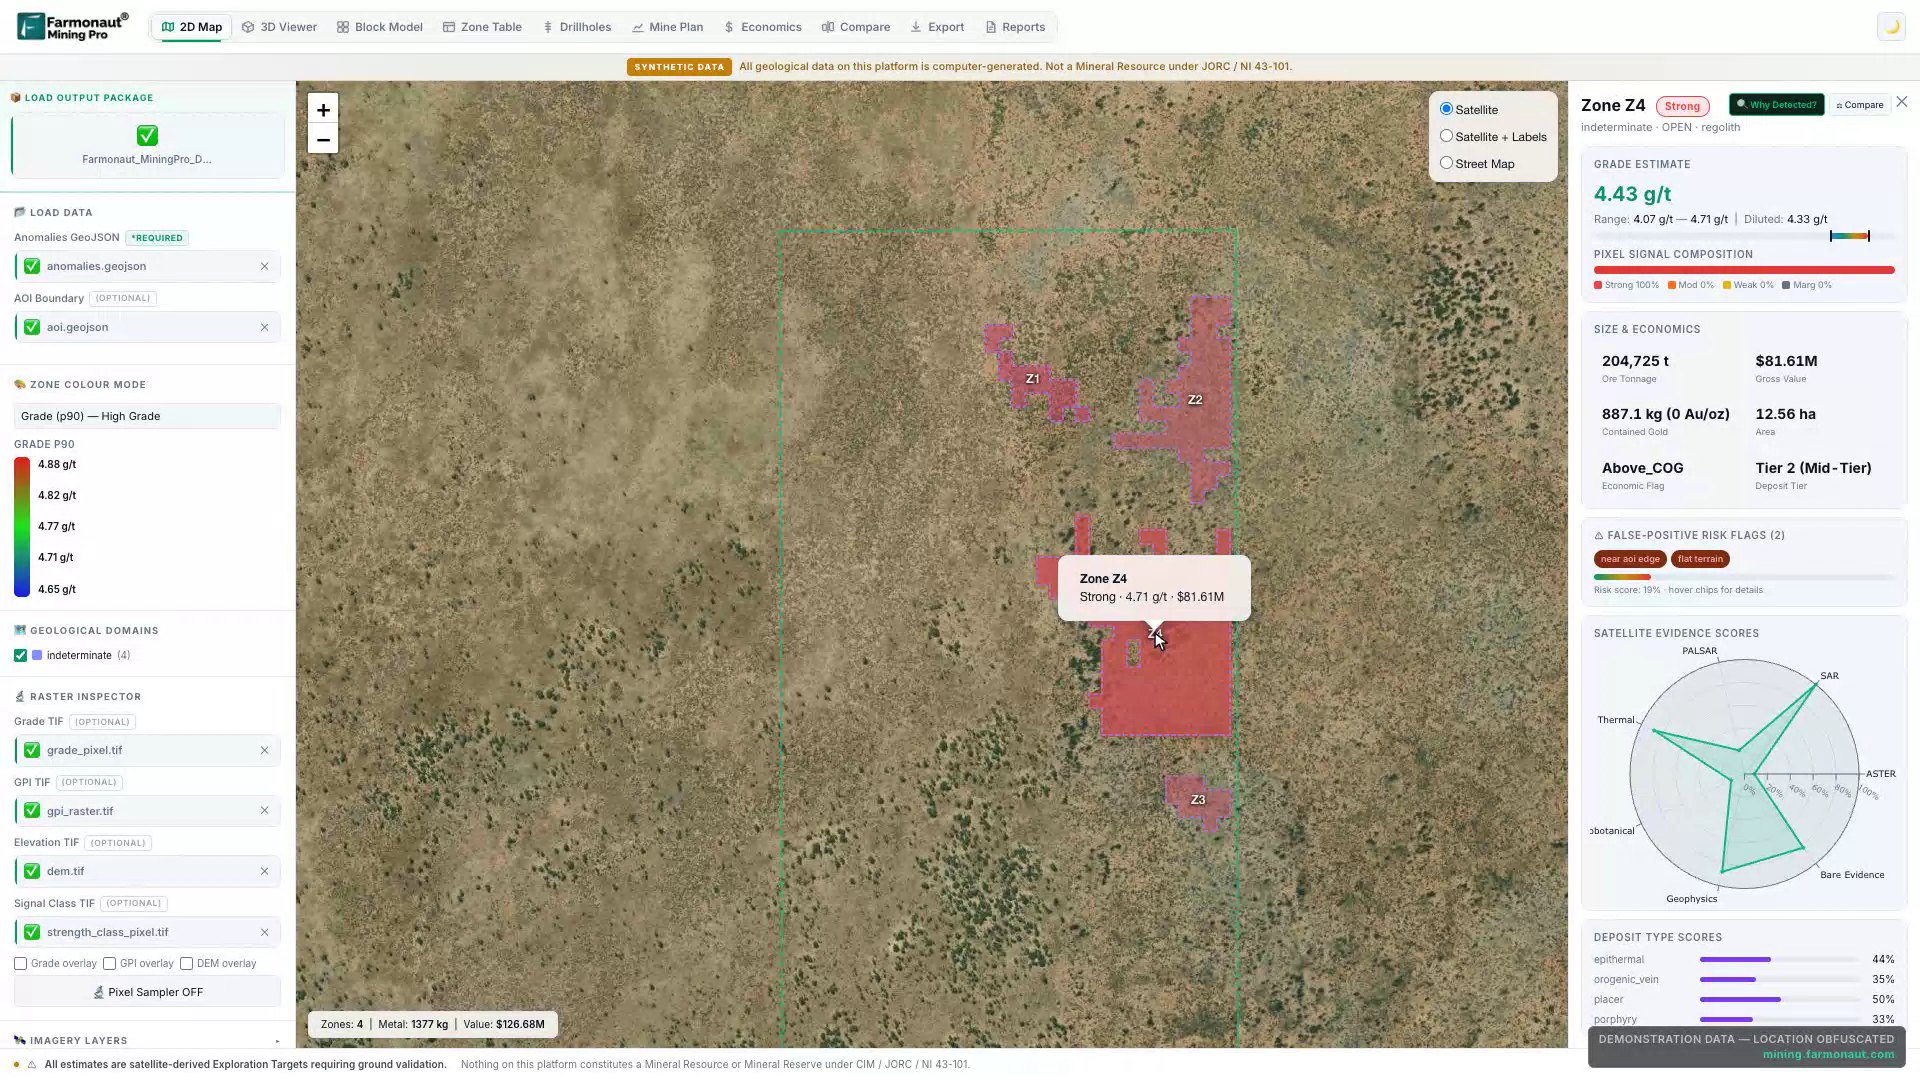
License boundary, ranked anomaly polygons and every raster layer on one map.
02Raster Inspector
Read the evidence pixel by pixel — each input band behind a score.
033D Viewer
Terrain, anomaly solids and vein geometry in a rotatable scene.
04Zone Table
Every zone with grade, tonnage, confidence tier and risk flags — auditable.
05Block Model
Regularised economic blocks with EXPL_TARGET A/B/C confidence codes.
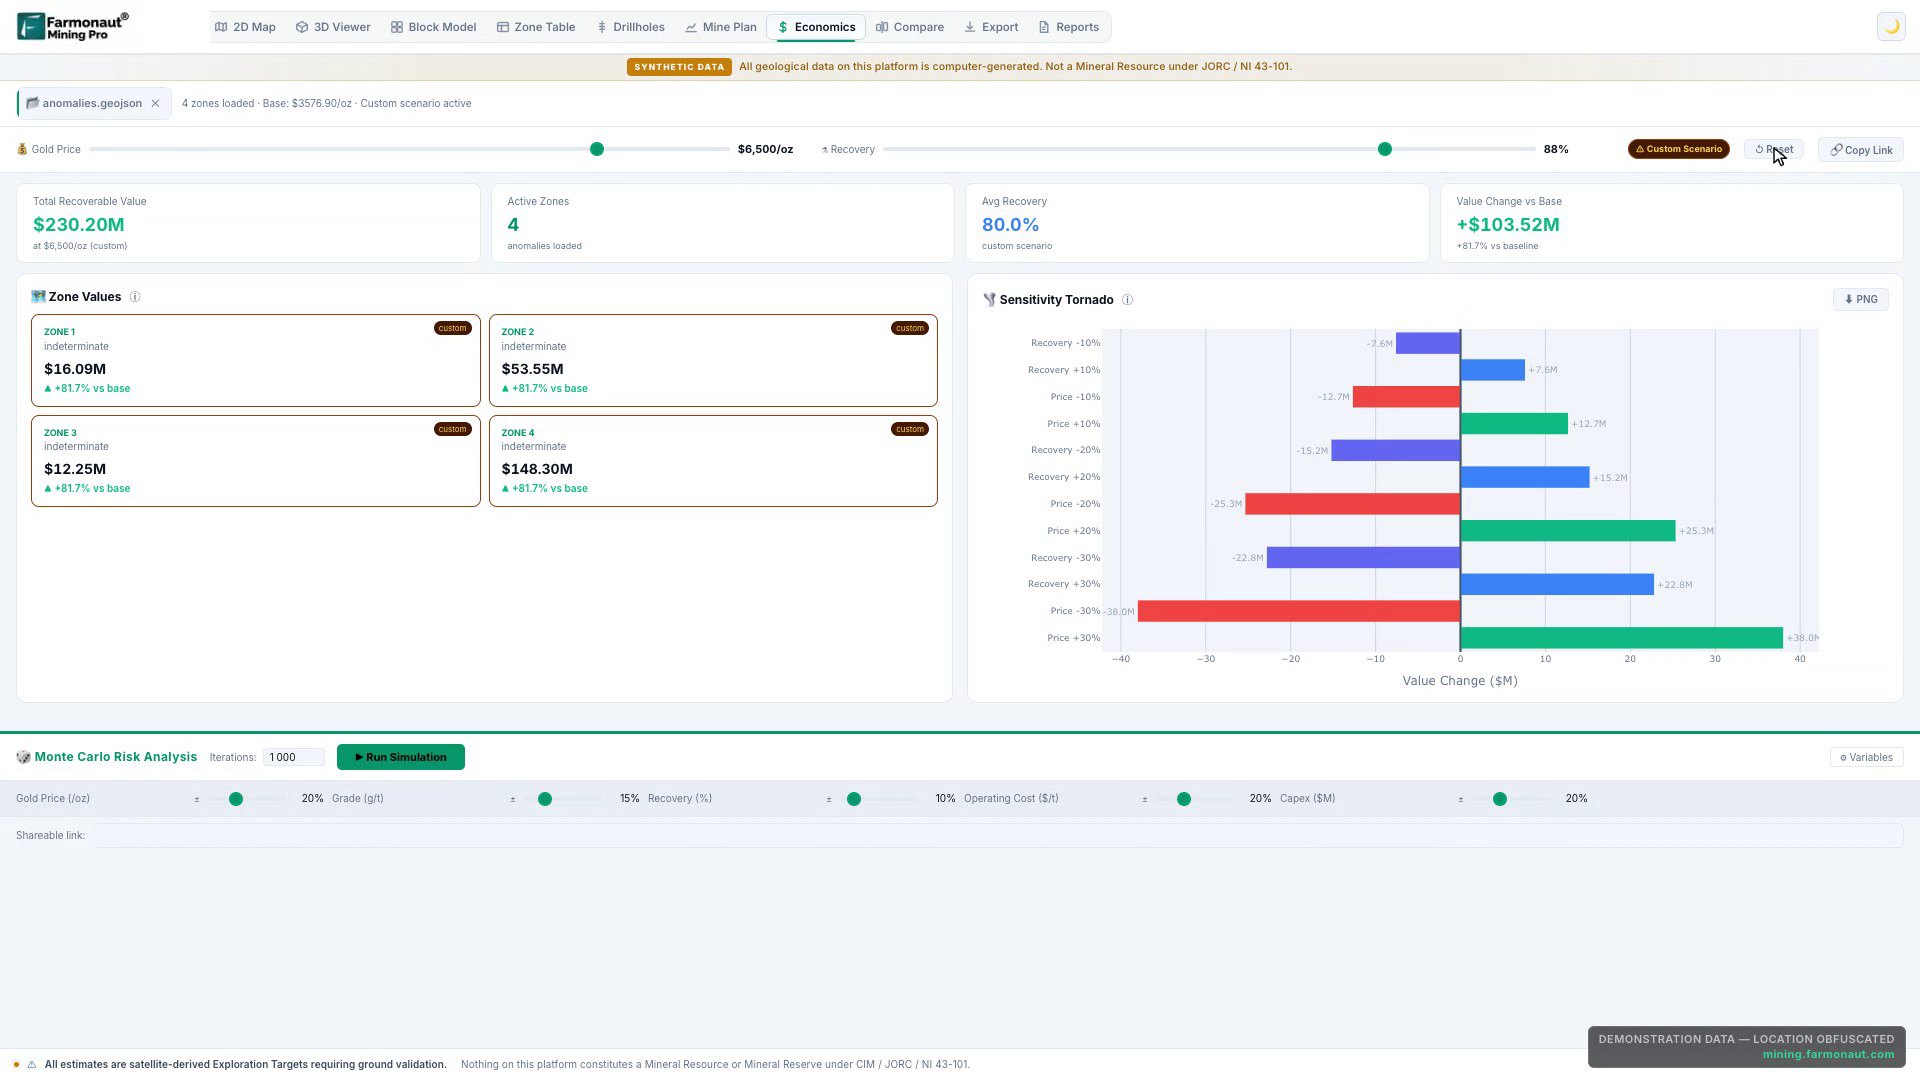
Monte Carlo NPV with P10 / P50 / P90 and price sensitivity.
09Export & Reports
Hand-off packages for Leapfrog, Vulcan, Surpac and Datamine.
On screen
2D Map — ranked anomaly polygons, grade and value per zone3D Viewer — terrain, veins, grade blocks, drill collarsMine Plan — grade–tonnage, bench profile, LOM scheduleEconomics — sensitivity tornado and Monte Carlo risk
Premium+ — 3D geology and a conceptual mine plan
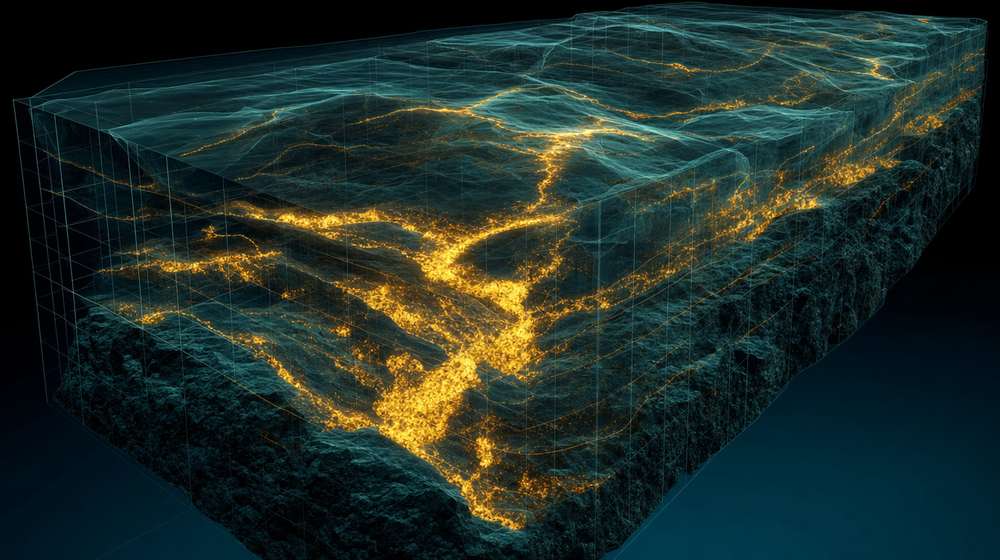
Illustrative rendering of modelled vein geometry inside a block-model volume — not client data.
Economic block model
Regularised blocks carrying grade, density, dilution and an EXPL_TARGET A/B/C confidence code.
Synthetic drillhole set
Collar, survey, assay, lithology and de-survey tables — enough to design a first-pass programme.
Floating-cone pit shell
A conceptual pit generated on the reconciled expected-tonnage basis, not the raw envelope.
Bench & grade–tonnage
Tonnage and grade per bench, and the grade–tonnage curve behind any cut-off you choose.
LOM schedule
A conceptual life-of-mine production schedule with strip ratio by period.
Orebody solids
Wireframe solids per zone, ready to import into your own modelling package.
Learn it before you buy it
See the platform in action through a full 16-chapter video course, recorded live using real survey data.
The course walks through how the exploration workflow works, how satellite data is used to identify mineral targets, how targets are ranked, and how the platform moves from raw data to drill-ready insights — including the more technical parts that are difficult to explain on paper. No geology degree required.
Screens captured from the live platform on the published demonstration dataset — location obfuscated, geology computer-generated.
Proof
Drilled — andthe ground agreed
Five engagements where clients took our targets into the field and drilling, then shared what they found with us. Each case study is published in full and linked below, showing how the satellite-led predictions held up against real-world results.
90%
of ranked zones confirmed by ground or drill evidence
100%
of accepted engagements delivered in full, to scope
5
engagements taken to the field or the drill by the client
Every card links to the published case study at farmonaut.com/mining/project. Time and cost savings as reported by the client in a post-project review. Accuracy is the share of ranked zones confirmed by ground or drill evidence on engagements where the client reported back. Reliability is the share of accepted engagements delivered in full, to scope.
Every zone above was drilled by the client, not by us. Test your own ground the same way.
All 18 satellite-based gold exploration engagements are documented in full, including the methodology used and the outcomes reported by the clients themselves. Each row below links directly to its full case study.
Beyond gold —battery, base and industrial minerals
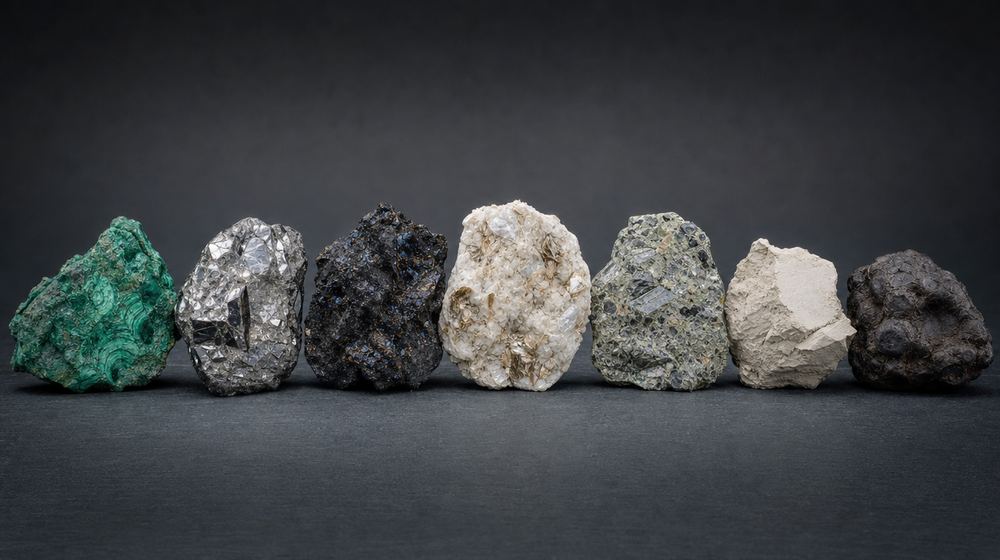
Copper–cobalt, lithium, nickel, silver, diamonds and bentonite: the same satellite mineral mapping pipeline, retuned per mineral with its own spectral signature, density and recovery assumptions.
Copper, tin, cobalt, lithium, kimberlite, bentonite and manganese — each with its own spectral signature.
30,196 acres — the largest single non-gold license delivered
Silver
USA
2,414 acres across a multi-license silver package
Eight of these are published in full at farmonaut.com/mining/project — click a card to open it.
In their words
Feedback from the clients
Real feedback from clients who have used the platform for their exploration projects. Every testimonial is published with the client’s permission and links directly to the full case study behind the engagement.
A diverse client base spanning license holders, exploration consultancies, mining groups, traders and investment firms across 33 countries. Every company listed below represents a paid engagement in FY 2025—26 or FY 2026—27.
Berks Gold Limited
Nanita Company Limited
Energy and Resources Ltd
Denkyira Nkoranza Concession
Mwerezi Minerals Company Limited
Riverside Resources Limited
Ramani Investments Ltd
African Venture Partners Holding
Comfix & Engineering Limited
Critica Metals Limited
Imperial Impex FZE
Congo Mining Solutions
CIMISCO SARL
Viahara Mining
Mining SARL
SenGold Invest SAS
Sahel Shipping SA
Sania Corporation
Sahara Mining
Enterprise Takreem
Sean Mining Limited
SMA Investments Ltd
NTS Group (Pty) Ltd
Klusetic Mining Investments
Mine4Africa
Timestream Mining
Lithspo Minerals Limited
Mulopwe Metals Mining Ltd
Rains of Favour
Tintina Mining Group
Huckleberry Garnet LLC
Process Metrology LLC
WSP Investment Company
Dalgety Minerals Pty Ltd
Vortex Minerals Pty Ltd
Swati Minerals
Faith At Work (Pty) Ltd
Geotech Mining Solutions plc
Vulcan International Limited
Kidepo Associates
GKY Mining
Alkimy SARL
Double A Trading
Tipareth Mines
Geoticgy
GemSprout Metals Limited
Southbridge & Wess PDC Ltd
Qader Group
Ileys General Trading
SG Gold Mining LLC
VRV Global Pte Ltd
Omsri International FZE
Mineral Gulf Transhipment DMCC
G.I.T.T.
Jaunita Erss Ltd
Almosi SARL
SRK Consulting
Company names as recorded on the engagement.
Bringing license holders to us — as a consultancy, agent or geologist? There is a partner programme.
The coordinates, a KML / KMZ / GeoJSON file, or the exploration license or concession boundary — along with the country and target minerals. We’ll come back with the scope, price and expected delivery timeline — within one working day.
Farmonaut / Yuple Inc. 200 Vesey Street, 24th Floor New York, NY 10006
United States
2810 N Church St, PMB 87609 Wilmington, Delaware 19709
Phone · India
+91 63660 26267
+91 78995 27307
+91 89517 51784
WhatsApp
+1 (669) 205-6010
+1 (555) 867-1945
+1 (646) 498-4056
Partner with us
Turn your network into recurring revenue.
You own the client relationship and the conversation — we do the technical work and the delivery. Free to join, commission on every successful project, no technical background needed.
Exploration figures on this page are satellite-derived Exploration Targets — the basis for ranking and costing a drilling programme, and not a classified Mineral Resource or Reserve under JORC, NI 43-101 or SAMREC.
Mineral analysis
Satellite Mineral Intelligence
Find Valuable Minerals Using Satellite Technology
Upload your area of interest and receive satellite-backed insights on mineral potential — fast, non-invasive, and research-backed.
33
Countries
23
Minerals
391,956
Acres Analysed
$1T+
Minerals Found
press Enter ↵
Which of the following describes you the best?
Mining License Owner
Mining Consultant
Investor
Mining Company Employee
Other
Please select an option to continue.
First name is required.
A valid email is required.
Phone number is required.✓ Valid phone number
press Enter ↵
Mention Your Target Minerals *
This field is required.
press Enter ↵
Total Area *
This field is required.
press Ctrl + Enter ↵
Submitting… please wait
Thank You!
Your details have been saved successfully. We will get back to you shortly.
Satellite crop monitoringthat sees every field, every few days.
Farmonaut turns satellite imagery into actionable insights for every field. It reads what satellites see and tells you, field by field, how much water your crops need, which nutrients are lacking, and where pests or diseases may be emerging.
No sensors in the ground. No drones to fly. No field visits. Just satellite data, turned into decisions.
By the time a field looks unhealthy, yield loss may have already begun
Healthy crops absorb red light for photosynthesis and reflect near-infrared light — a part of the spectrum that our eyes cannot see. When plants come under stress, their near-infrared response can change before visible signs appear. Satellite monitoring detects these early changes across the field, helping identify crop stress before it becomes obvious from the ground — when there is still time to act.
The fortnight you lose
What the satellite reads What your eye can see
Schematic, to show the idea — not measured data.
Walking the field cannot close that gap on its own. A scout covers one line across a block. The satellite reads every 10 metres of every field, on the same schedule, whether or not anyone had time this week.
Why the satellite sees it first
A healthy leaf
RED12%
HIDDEN92%
Soaks up red light to feed itself, and throws almost all the hidden light straight back.
A struggling leaf
RED46%
HIDDEN38%
Stops feeding, so it reflects more red and much less hidden light. This change shows first.
The same fortnight on a real field rather than a diagram — what the hidden-light reading does before the colour changes.
What you get, every few days
A complete picture of your crop health — for every field
Every few days, Farmonaut turns satellite imagery, field history and local conditions into clear, actionable answers. You see what’s changing, how much it matters, and what needs your attention — so you can act before a small problem becomes a bigger one.
How it actually works
Step 1
A satellite photographs your field
Two kinds of satellites pass overhead. One captures colour and hidden wavelengths that reveal crop stress. The other sees through cloud, smoke and haze — keeping your field record moving.
Step 2
We turn every image into detailed readings
Greenness. Early stress. Water inside the plant. Soil moisture. Organic matter. Slope. Each reading answers a different question about the same field.
Step 3
We add the context satellites can’t see
We combine satellite data with your soil history, local weather and your crop’s normal calendar — specific to your field and the date.
Step 4
You get clear answers you can act on
Not just a chart or a colour on a map. Get water requirements in millimetres, fertiliser requirements in kilograms, pest risks with probabilities, and the reason behind every recommendation.
The whole advisory for one field, from a real customer’s report. Your worst field opens first.
The fertiliser panel: the dose in kilograms, per nutrient — not a colour.
The pest panel: the species named, and the reasoning that flagged it.
1. How the crop is doing
A clear health map of your field in five levels — healthy, light stress, moderate stress, high stress and very high stress. Zoom in to any area.
Acres in each health level
2. How much water, and when
Get the exact water requirement for your field and the best time to irrigate, based on the crop stage and weather.
Millimetres per day, for the next 7 days
3. What the soil is like
See soil acidity, salinity and organic matter, with simple field-level insights for each reading.
A reading per soil parameter
4. What you will harvest
Get an updated yield estimate as the season progresses, with the reason behind every change.
Yield per acre + expected harvest date
5. What is about to attack
Know the pest or disease risk for your crop, with a probability score and the key conditions behind it.
Risk probability + two control options
6. What fertiliser is short
See which nutrients your crop needs, how much to apply, and when, based on your field’s current condition.
Dose for each of 5 nutrients
One real report walked through panel by panel, including the moment it flagged a fall in yield the farmer had not seen coming.
If the right recommendation is apply nothing, we’ll tell you that too. Across the fields we’ve analysed, some of the biggest savings came from avoiding unnecessary applications.
And you can access it however you work
On your phone
Open it in your browser. Nothing to install.
In your language
Get the report in any of 248 languages you choose.
As a PDF
Download it, print it, or hand it to the person doing the work.
As a link
Share a field directly with your agronomist, farm manager or buyer — no login required.
Map any field you choose and get a fresh set of crop health answers after the next satellite pass.
Farm management software that tells you what to do
16 satellite views of every field — turned into one clear instruction
Get precision farming insights without the cost of precision farming equipment. No GPS kit, soil probes or drones required. Add a field by searching its address, drawing the boundary yourself, or uploading an existing map file.
Then get clear answers on crop health, water, soil, yield, pests and fertiliser — and what to do next. Every number shown below comes from a real customer report.
Sixteen views, each with a note on when it is the right one.
The same field across a season. Watch which way the line is going, not what it did on one day.
Young crop
See early crop growth clearly, even when exposed soil can make standard satellite readings misleading.
Mature crop
See differences within a dense canopy and spot early signs of crop stress, including potential nitrogen shortage.
Water
Know how much water your crop and soil hold, how quickly it is being used, and where your field needs attention.
The ground itself
Understand the fundamentals of your field — organic matter, elevation, slope and what is growing where.
Through cloud
Keep monitoring through monsoon, fog and smoke with radar imagery, so your field record stays continuous.
Compare any two dates side by side, or watch the entire season unfold as a timelapse — one field, captured by satellite and analysed in sixteen different ways.
Feed only what the crop needs
See exactly where each nutrient stands against the crop’s requirement — and get the recommended dose for each one. On one Florida farm, 8 of 25 blocks were told to apply nothing because nutrient levels were already in range. On a Nigerian groundnut field, the recommendation was to skip nitrogen completely — because the crop produces its own.
Protect what needs protecting
Know which pest, disease or weed is putting your crop at risk, why it was flagged, and what you can do about it. Every warning comes with the reasoning behind it, the specific species identified, and two treatment options — organic and chemical. Different fields can get different warnings, even on the same farm.
Where we already work
Satellite crop monitoring in 135 countries
Farmers in 135 countries use satellite data to monitor their fields. The darker the map, the more acres we monitor there. The same technology works across crops, climates and countries — in the language you choose.
Boundaries as recognised by the Government of India. Hover a country for its acreage.Fewer acresMore
Acres by region
Region
Acres
Main markets
North America
20,200
Latin America
27,600
Europe
14,100
Oceania
15,600
Africa & Middle East
56,800
Asia
853,000
Countries with farms, most acres first
Crops we already monitor
One platform. 166 crops. From oil palm to blueberries.
From broad-acre crops to specialised fruits and tree crops, the same satellite monitoring system works across 166 crops. The figures below include only fields where the farmer has identified the crop, so the actual coverage is likely higher. And adding a new crop doesn’t mean building a new system — the same platform can be extended to support it.
166different crops monitored
116,000+acres of oil palm monitored across 35,300+ plots in 11 countries
45countries with apple-growing fields — our most widely monitored tree crop
The largest crops after oil palm
Each column uses its own scale so smaller crops remain easy to see. The acre figure beside each bar shows the actual area monitored.
Apple
17,600
45 countries
Rice
14,100
29 countries
Paddy
11,600
8 countries
Wheat
10,700
36 countries
Cotton
6,670
10 countries
Maize (Corn)
6,480
29 countries
Soybean
6,440
11 countries
Sugarcane
5,860
15 countries
Illustrative. Oil palm is our largest crop — over 35,000 separate farmer plots, each watched on its own.
Beyond these twenty there is a long tail: coffee, potato, blueberry, banana, mango, olive, groundnut, turmeric, chilli, cassava and around 130 more.
Growing a crop that isn’t on the list? Tell us what you grow and where — our system can go beyond these 166 crops.
The next twelve largest crops
Almonds
4,180
22 countries
Cocoa (Cacao)
4,050
8 countries
Cashew
3,900
4 countries
Cabbage
3,730
14 countries
Coconut
3,630
6 countries
Barley
3,140
17 countries
Apricot
2,960
9 countries
Broccoli
2,850
3 countries
Avocado
2,480
17 countries
Grape
2,420
22 countries
Bamboo
2,250
3 countries
Chili
2,040
8 countries
Grouped by crop family
Palms & plantations
9 CROPS
131,000 acres
Cereals & rice
9 CROPS
46,600 acres
Fruit & nut trees
24 CROPS
37,400 acres
Cotton, cane & fibre
5 CROPS
15,200 acres
Vegetables
20 CROPS
14,000 acres
Beans & oilseeds
18 CROPS
10,100 acres
Growing something that is not on the list? Tell us the crop and where it is — the system is not limited to these 166.
One farmer. 25 blocks of blueberries. One consultancy. 10 crops across 3 countries.
Different farms need different answers. Here are two real examples of how Farmonaut is being used to make those decisions clearer. Both are published in full at farmonaut.com/case-study.
John Vansickle
Blueberry farmer · Citrus County, Florida
“Optimised both irrigation and fertiliser use by 30–50%.”
His own words, submitted through our in-app feedback, June 2026
He manages 25 blueberry blocks across 124 acres. Over the week we examined, the reports recommended no water on 78 of 175 block-days and no fertiliser on 8 of the 25 blocks — helping him avoid applications where they weren’t needed.
25blueberry blocks, each with its own report
124acres monitored
1,048reports received before his feedback
Not a trial plot. A working commercial farm, monitored continuously for nearly six months before the farmer asked whether it was worth it. During the week we examined, his 25 blocks were at four different growth stages at the same time — making field-by-field monitoring far more useful than a single whole-farm average.
Illustrative. Blueberry on raised beds.
AGROEX Consultancy
Advises farmers across 3 countries
Reported 30–50% better watering and over 70% better fertiliser use.
Their own report to us through the in-app feedback form, June 2026
They manage 15 mapped fields across 630 acres, growing 10 different crops — including apple, pear, peach, plum, apricot, cherry, grape, raspberry, melon and cotton. Each crop is at a different stage of its growing cycle, so every field gets advice based on its own conditions.
10crops managed on one account
181reports generated in 75 days
39warnings where risk exceeded 80%
The clearest proof that the advice is truly crop-specific: the apple field was flagged for one scab fungus, while the pear field was flagged for a different one. The advice doesn’t just spot a disease — it identifies the right disease for the right crop.
Illustrative. Irrigated orchard on a valley floor.
Customer · El Bayadh, Algeria
He could have watered every day. The report told him not to.
This 190-acre farm grows durum wheat, barley, oats and alfalfa. Each field was monitored separately, taking into account the crop, its stage of growth, soil conditions and weather.
Over one week, the recommendations were different for every field. Some needed water. Others needed less as harvest approached. Fields that were already finished were told not to water at all.
The result was simple: instead of running the sprinklers every day, the farmer had a schedule showing exactly how much water each field needed — and which days to leave the sprinklers off.
This is the case that reads across to anywhere water is pumped and expensive — California, Spain, Australia, the Texas High Plains.
Illustrative. Sprinkler circles on dry ground, and one circle noticeably browner than the rest — the field that was finished.
51%less water than watering every day
17 of 28field-days where the recommendation was no water
40 acreswhere irrigation was off for the whole week
3 of 4fields needed no fertiliser
91reports delivered
6high-risk pest warnings, each matched to the crop
He confirmed in our in-app feedback form (May 2026) that the report helped him water better. The 51% figure comes from his own seven-day schedule compared against watering every day.
Water, feed, protect — and the money is in the days it says stop
One real week on one real farm. Four fields, four crops, four different answers. The teal squares are millimetres of water. The cream squares say do not water at all.
Water — mm Do not water
17 of 28 field-days say stop — 51% less water than running the sprinklers every day.
D1
D2
D3
D4
D5
D6
D7
Barley
65 acres
4.5
0
4.0
0
4.5
0
4.5
Durum wheat
65 acres
2.5
0
2.0
0
1.5
0
0
Oats
40 acres
0
0
0
0
0
0
0
Alfalfa
20 acres
3.5
0
3.5
0
4.0
0
4.0
This is what field-level monitoring changes: You don’t get one irrigation recommendation for the farm. You get the right recommendation for each field, on each day.
What customers told us
What farmers saw after using our crop monitoring software
Every percentage here comes directly from the customer’s own estimate, shared through the app’s feedback form. We then went back to their reports and checked that the reported results were consistent with what the software had recommended.
Our work has also been examined by independent researchers with no commercial relationship with Farmonaut. Their research looks at how farmers use and adopt the system, how the technology is built, and the measured impact on water use.
A selection of universities and colleges with fields mapped on the platform.
University of Nebraska–Lincoln
Massachusetts Institute of Technology
University of Maryland
Arkansas State University
University of San Diego
University of Sheffield
University of Aberdeen
University of Strathclyde
École de technologie supérieure
Universidad de Buenos Aires
UFRJ
Colegio de Postgraduados
Universidad de La Frontera
Charles University
Cairo University
Africa University
Add satellite crop intelligence to your product
Bring satellite crop monitoring into your own software
An agriculture data API that gives your product access to satellite imagery, field readings, reports and recommendations. Build it into your own platform and give your users crop intelligence without building the technology yourself.
Step 1
Send us your field
Share the field boundary in a single API call.
Step 2
We analyse it
We process the satellite data and generate the readings, report and recommendations for that field.
Step 3
Get the results in your product
Receive everything as structured JSON, ready to display in your own software.
That is the whole call
POST/submitField
Authorization: Bearer <YOUR_API_KEY>
→ pictures, readings and advice, as JSON
Getting the account and the key, on screen: sign up, find the key under API Management, make the first call.
194 businesses across 47 countries — plus 74 educational institutions
From farmers and plantations to co-operatives, agri-input companies, farm-management services and food buyers, businesses across the agricultural value chain are already using the platform. 194 businesses are counted by their trading name. 74 universities and colleges are shown separately, as their accounts are used for teaching and research rather than commercial farming.
Students and faculty are already using Farmonaut to work with real fields and real satellite data — giving the next generation of agricultural professionals hands-on experience with modern crop monitoring.
Accounts per country
418332221111111111111
It matters commercially in one plain way: farm-science graduates who learned to read a crop-health map on this platform turn up at their first job already knowing how to use it.
20countries with teaching accounts
74university, college and school accounts
117fields mapped by students and staff
6continents represented
Universities and colleges with fields on it
University of Sheffield
Rajagiri Institute of Technology
SSR Mining
Emorphis Technologies
University of Aberdeen
University of Nebraska–Lincoln
UFRJ Poli
École de technologie supérieure
St Xavier’s College
Arkansas State University
Sri Ramakrishna Engineering College
Banaras Hindu University
Universidad Industrial de Santander
Indian School of Business
SRM University AP
NIT Jalandhar
Rajalakshmi Engineering College
Ain Shams University
Also teaching or researching on it
Universidad de Buenos AiresInstitut Teknologi BandungInaburra SchoolKhulna UniversityUTFPRAgriKonect TechnologiesCairo UniversityTong StudentUSAMV BucharestColegio de PostgraduadosWynne Public SchoolsSomaiya Vidyavihar UniversityMukdahan UniversityRamdeobaba College of EngineeringUniversity of MarylandSymbiosis Institute of TechnologyRMK Engineering CollegeCentral Luzon State UniversityFarmkartUniversity of Horticultural Sciences, BagalkotAfrica UniversityUniversity of San DiegoAnurag UniversityVNU University of ScienceUniversiti Teknologi MARAIIIT VadodaraNIT KarnatakaCharles UniversityShivrai TechnologiesUniversidad de La FronteraIIT BombayBITS PilaniKendriya Vidyalaya JaipurDKTE Society’s Textile & Engineering InstituteAmnex InfotechnologiesAtharva College of EngineeringYezin Agricultural UniversityUniversity of StrathclydeIIM IndoreIllinois Institute of TechnologySKUAST KashmirSri Krishna College of EngineeringKongu Engineering CollegeIIFM BhopalSRM Institute of Science & TechnologyMasters’ UnionSardar Patel Institute of TechnologyVellore Institute of TechnologyMassachusetts Institute of TechnologyKing Mongkut’s Institute of TechnologyUPESBannari Amman Institute of TechnologyCarmel High SchoolSASTRA UniversityKL University HyderabadIIT Dharwad
Advising farmers, or running a business? Refer them and earn a share of what they spend.
Choose a field that matters and see what the data says.
Map one field you already manage and get a fresh crop health report after the next satellite pass. No pilot project or long-term commitment — just real precision agriculture technology, priced per field.
Refer farmers instead of farming yourself — the code, the commission, the tracking.
Real product screens, captured September 2026. Customer percentages are their own estimates, checked against their own reports. Areas in acres, rounded down.