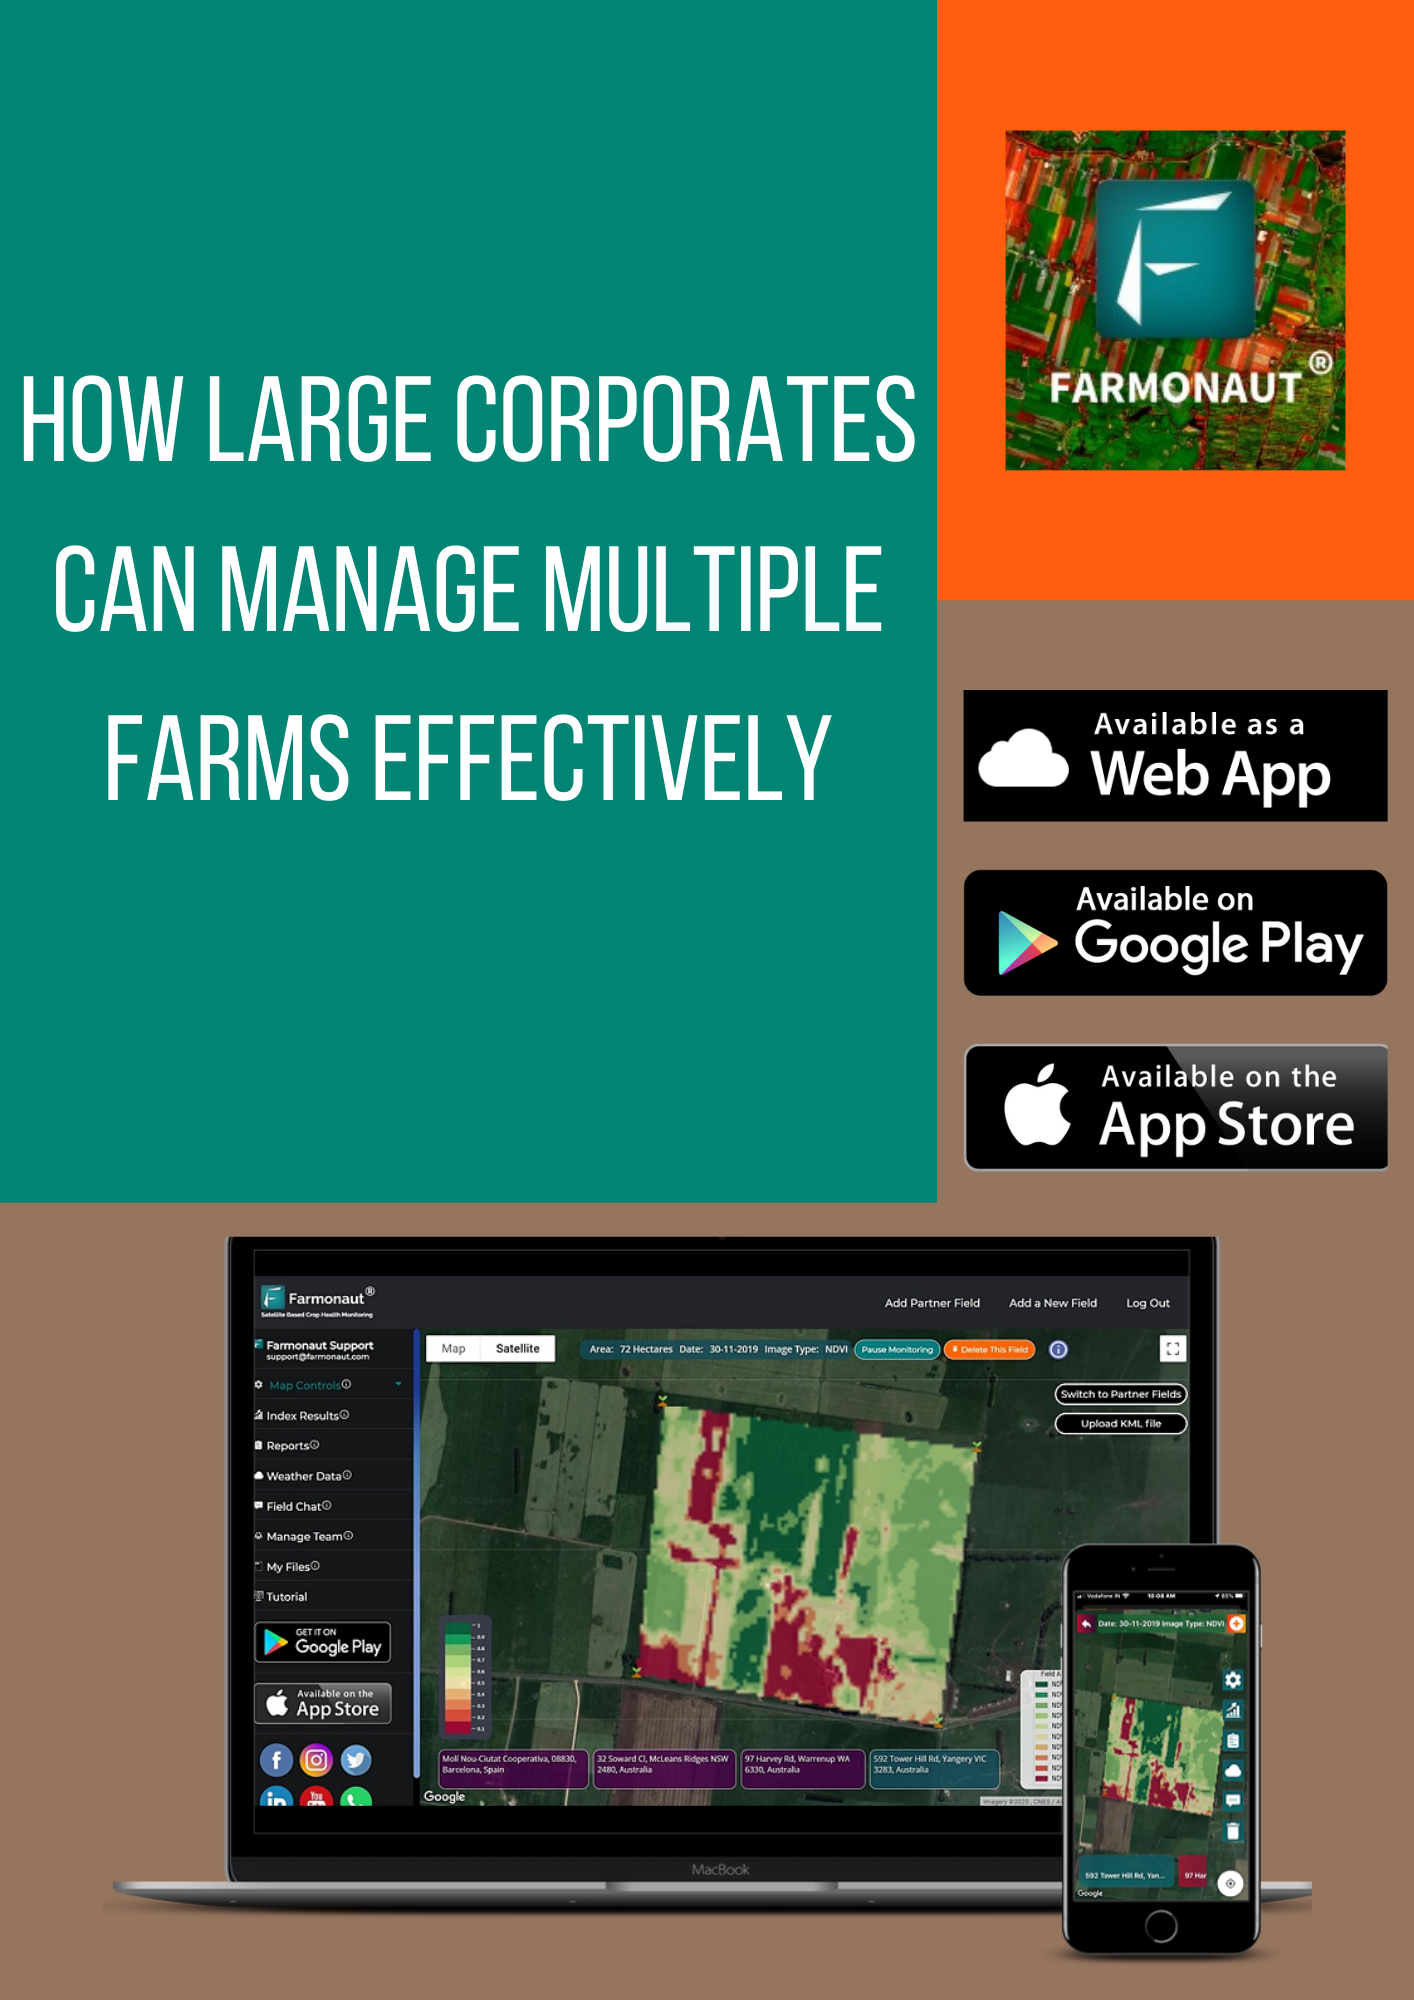
Farmonaut has been working with the large corporations by providing them the system for the use of better management of the farms. They have been using the “Remote Sending technology” to grab the data at large scale for the farmers to impart better management of farms. Managing multiple farms at a large scale can be tedious and inaccurate at some point. Hence, to overcome the drawbacks faced by the corporates, Farmonaut is providing Admin application for the large corporates. Through the mobile application they can map fields and monitor, manage and access data with the help of advanced web-app.
Benefits to Large Corporations:
- It helps to manage farms at a large scale at district/village level.
- Data can be obtained in a couple of seconds within no time.
- Track the crop health and progress at every stage.
- Can provide data to multiple farmers at a faster rate.
- Help farmers to increase the yield and productivity.
- Downloading, sharing and accessing data is more convenient.
About Data you will get:
Using the satellite data provided by Farmonaut in the form of comprehensible information, farmers can:
- Reduce chemical/Fertilizer consumption by applying it only at the locations where crop health is in bad condition.
- Reduce Labour costs by directing the labour only to the areas where crop health is low.
- Reduce irrigation water wastage by knowing the water stress.
- Increase the overall yield.
- Maintain nutrient composition by knowing the soil carbon content.
Some of the concepts most commonly used for high level analysis by Farmonaut are NDVI, NDRE, EVI, VARI, SOC, NDWI, etc according to the use cases of each parameter.
- For Crop health of crop at early growth stage
NDVI (Normalized Difference Vegetation Index)
NDVI is used as a measure to identify the state of plant health based on the light reflected by the plant at certain frequencies. Though we cannot perceive it with our eyes, everything around us (including plants) reflects wavelengths of light in the visible and non-visible spectrum. Taking into account how much of a certain wavelength is reflected, we can access the current status of plants.
EVI (Enhanced Vegetation Index)
EVI is further an optimized index designed to enhance the vegetation signal with improved sensitivity in high biomass regions and improved vegetation monitoring through a decoupling of the canopy background signal and a reduction in atmosphere influences.
- For Crop health of crop at later growth stage
NDRE (Normalized Difference Red Edge)
NDRE is a spectral index that helps in gathering the data at the later stages of a crop when chlorophyll content is relatively higher in the crop.
- For irrigation:
NDWI (Normalized Difference Water Index)
NDWI index can help us control irrigation, significantly improving agriculture, especially in areas where meeting the need for water is difficult. The high NDWI corresponds to high plant water content and coating of high plant fraction, whereas the low NDWI values correspond to low vegetation content and cover with low vegetation. NDWI rate will decrease during periods of water stress.
Hence, through NDWI, the early detection of water stress can prevent many of the negative impacts on crops.
NDMI (Normalized Difference Moisture Index)
NDMI is used to know the moisture index/water stress in vegetation which helps in monitoring the drought condition of the areas. The kind of vegetation must be taken into account to further know the amount of water to use at particular growth stages of crops.
Evapotranspiration
Evapotranspiration measures the rate at which evaporation and transpiration occurs at multiple locations. Through evapotranspiration one can easily schedule the irrigation based on the indicators received by the data. Nevertheless, it can be ignored if NDWI and NDMI data result in a good condition.
- For Advance Analysis
VARI (Visible Atmospherically Resistant Index)
VARI is minimally resistant to atmospheric effect, allowing vegetation to be estimated in a wide variety of environments. Hence, it is ideally recommended to be used for arm level decision making if TCI or ETCI images show visible atmospheric distortion such as mild clouds or haze above the field.
- For Topography
DEM (Digital Elevation Model)
DEM is used to know the waterlogging prone areas in the field. During heavy rainfall or excess irrigation, the areas where the water logged or flood occurs can be identified through DEM. Hence, by knowing such areas the passage for the outsourcing of the water can be ensured by installing more motors in the area.
- For Soil Health:
Soil Carbon Content (SOC)
SOC is a measurable component of the soil organic matter that indicates the better health and yield of any land once the cultivation process ends. Remote Sensing technology plays a vital role In enabling farmers to ensure high SOC content by taking the right measures at the right time and the right place. Farmonaut creates a SOC image with a colour map of the percentage of organic matter present in the selected field. The land area appears green in the colour map if SOC content is more than 5% and red if the SOC content is less than 1%. Once the locations with lesser SOC levels are identified by Farmonaut, farmers can get the soil testing done on specific regions, and the required actions can be taken.
- For Crop Health during Cloudy Weather
RVI (Radar Vegetation Index)
RVI is measured by the backscattering which does not affect the data. The RVI data was designed to be the time series data which can be a great alternative to the NDVI. However, RVI can be obtained at extreme weather conditions when the satellite data could not be obtained due to cloudy or any other weather conditions. Hence, Farmonaut ensures the data at any conditions.
- Farmonaut also provides RGB images of the field. (Coloured satellite images)
TCI (True Color Image): It is basically raw image of the field captured by satellite of a particular farm. This is not an index image, but a RGB representation of how the field looked like in human perceivable colors upon its last visit.
ETCI (Enhanced True Color Image): It is a TCI image processed by our own systems to enhance the land features which were not so explicitly visible in the raw TCI image.
Farmonaut Admin Application:
The admin application of Farmonaut is available on mobile as well as on Web for easy use for corporates. To make it more applicable the applications are interconnected which allows to see the changes made on any platform. The data/reports provided is also available in 50+ languages making it convenient for more farmers. The application is beneficial to the chain of people using it and providing it.
- Farmers: They receive data on the crop health and weather data from the ground team on Any social media such as WhatsApp, SMS, Email as per the preference of the ground team.
- Ground Team: They use the mobile application to stay in connection with the farmers and provide them the data. They also use it to mark/geotag the farms.
- Office Team: They can see the farms marked and provide the necessary advisory to the farmers.
Mobile Application:
How to login to the application?
The access to the application must be provided by your organization in order to login. As you open the application it has an option to Add Farm. Once you click on “Add Farm”, username and password must be used to login which are provided by the organization.
![]()
How does it segregate the data?
Large corporations such as Coromandel, Godrej Agrovet are required to geotag the farms at multiple locations. In order to geotag multiple locations, segregation of the farms based on village area such as Number of farms geotagged from village 1 and village 2 would be helpful for providing services effectively and faster.
Farmonaut application has been designed in such a way that it smartly based on your current location can segregate the farms and provides the administrative boundaries of that particular village. It also gives a list of nearby villages, by which geotagging in those villages can be done. Once the user clicks on the village, the platform also shows the already geotagged farms in that village boundaries.
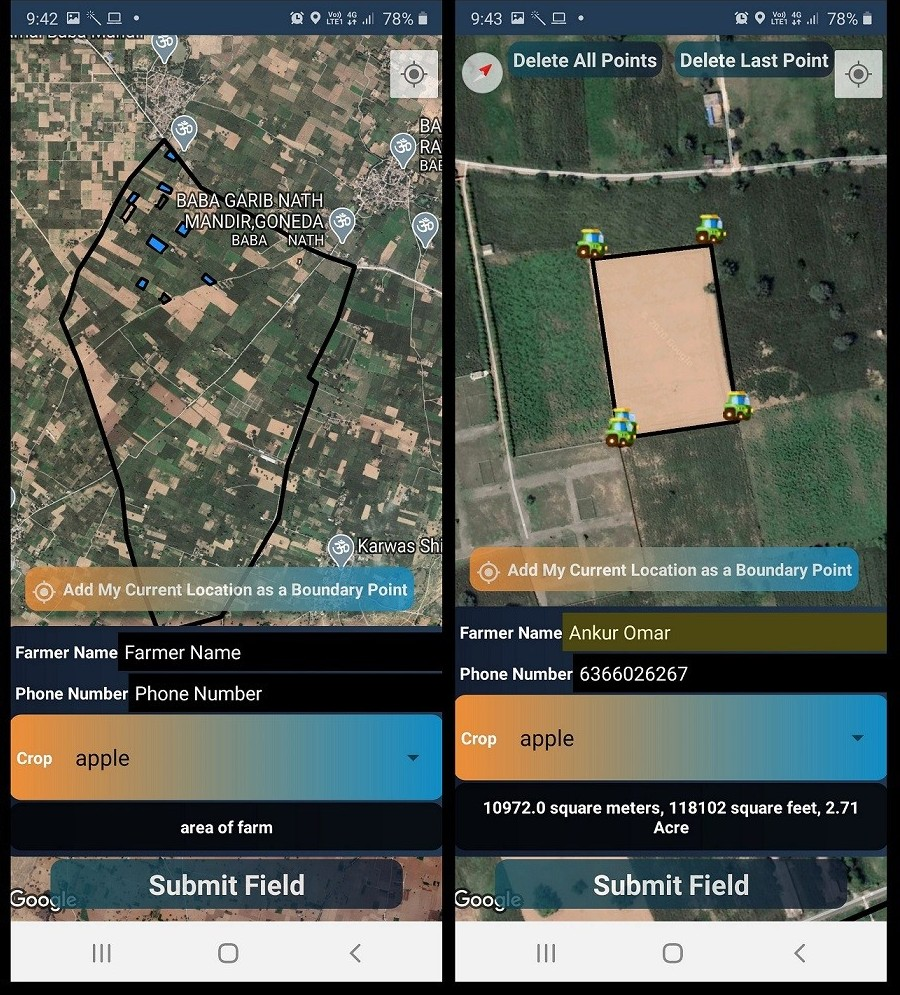
How to geotag the farms?
To geotag new farm on the map, it can be in any of the to ways:
- By walking along the field boundary and adding the current location as the boundary point.
- By pressing on the screen on the boundary point of the field. The field gets added.
Once the boundary points are selected on the map, the user can add the data such as Name of farmer, Phone Number and Primary Crop of the farm. After which the field can be submitted by clicking on “Submit Field”.
How to know information about already geotagged farms?
Once the boundary of the village is visible, the geotagged farms are also visible in that particular village. To know information about it, the user can select the farm and the information can be seen from the dropdown menu provided above the map. The information contains Name of Farmer, Phone No., Crop and Area in sq.m, sq. feet and acre. The information can also be visualized by clicking on the farm boundary which directs the user to a screen which contains all the information and also some major Edit options that could be useful.
Various Edit Features Available:
All of the edit features are available on mobile as well as web application. When the user clicks on the boundary of an already geotagged field, it directs to the screen which contains information about the farmer and his/her field. This window also has the following options from editing boundaries to adding farmer’s information.
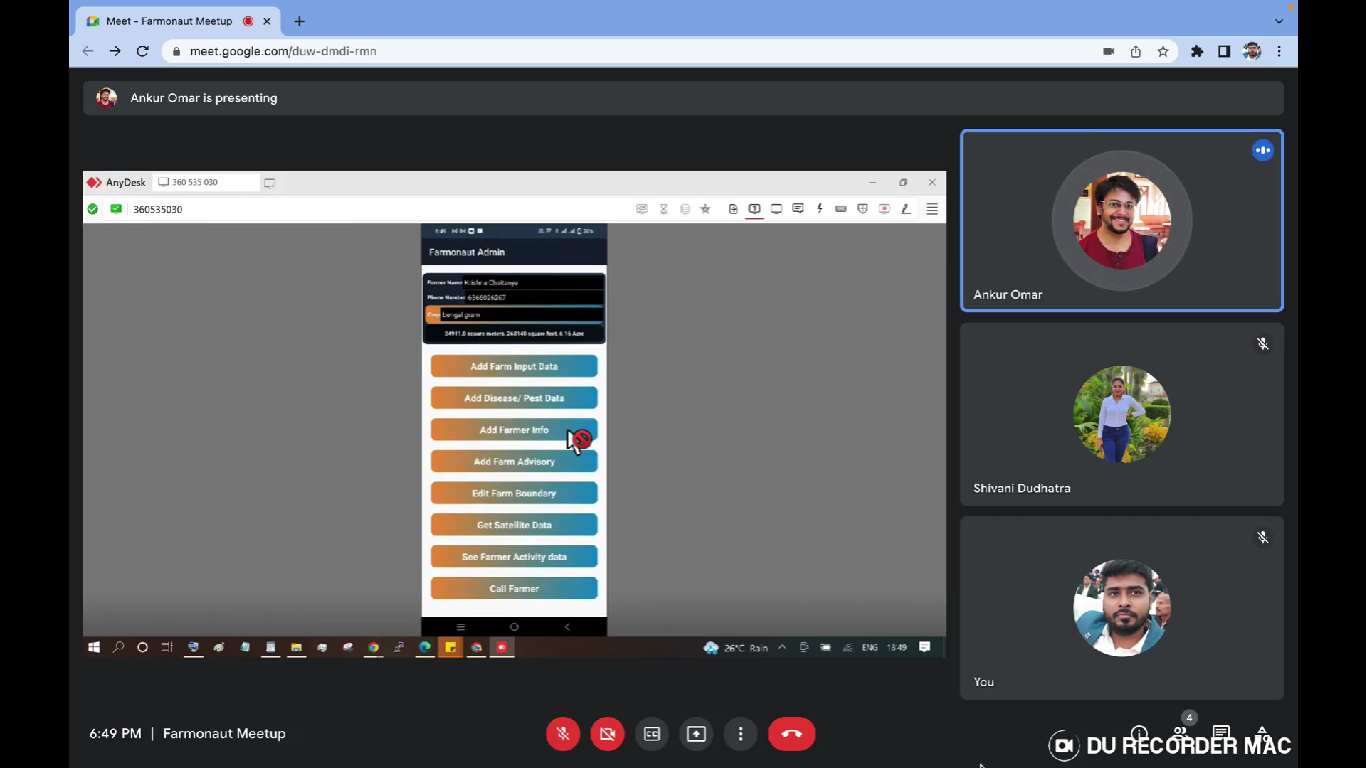
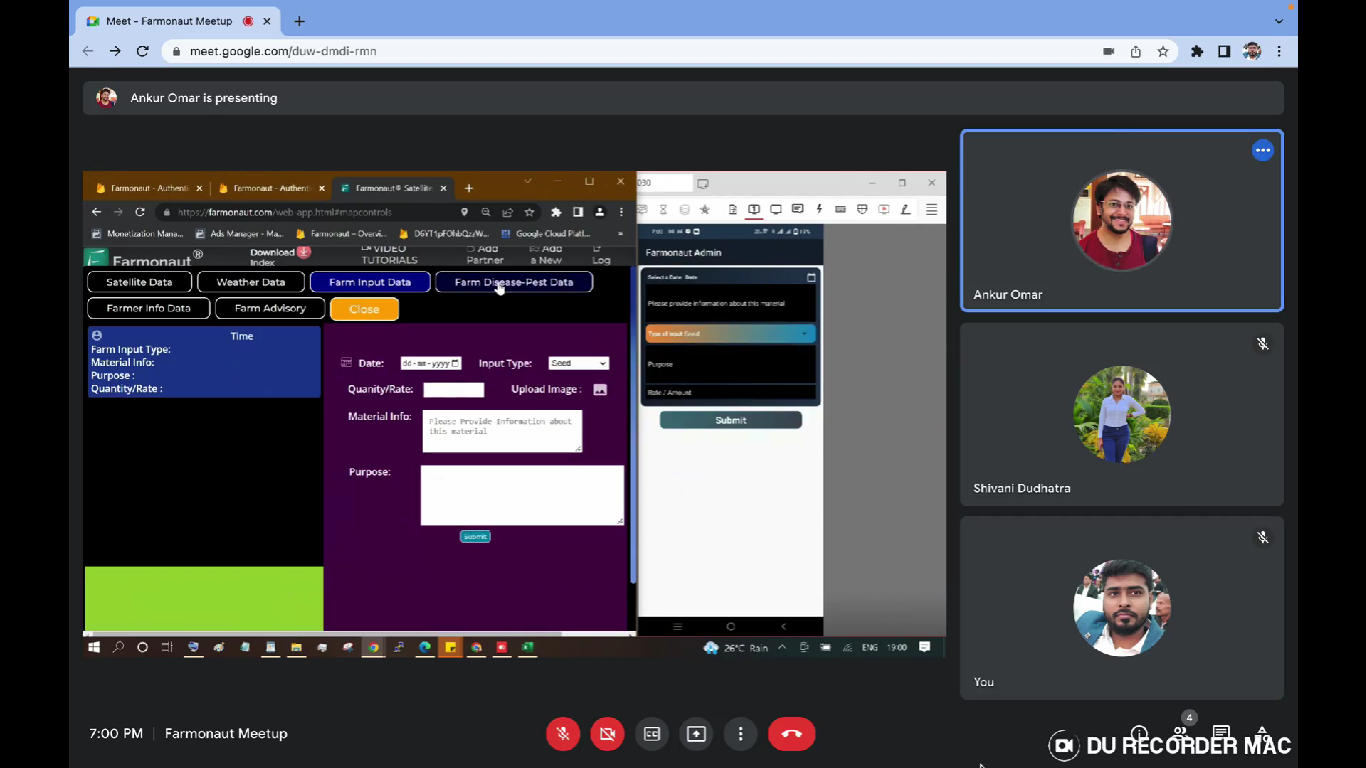
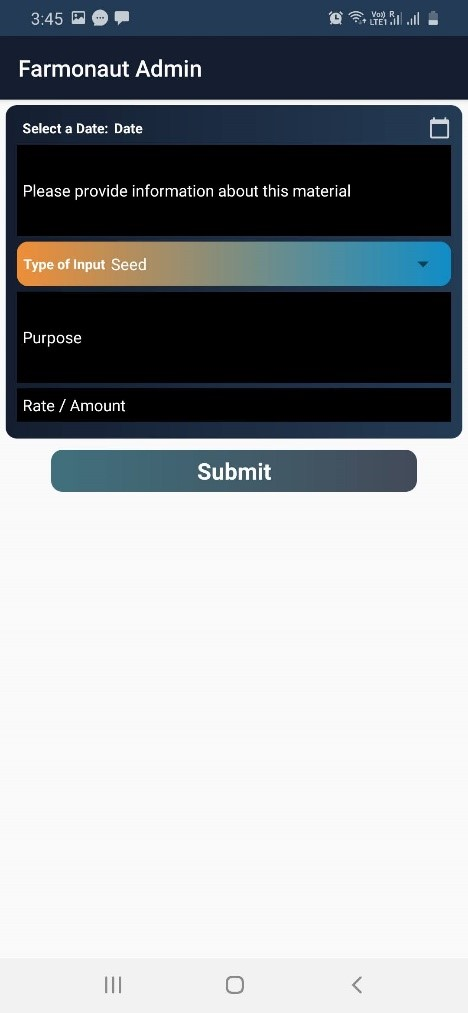
- Add Farm Input Data: It allows the user to add the data on farm inputs throughout the entire crop season based on the actions taken. It includes data points such as What farm input has been given by the farmers? What type of input was it (seed or Fertilizer or plant protection, etc)? On which date it was given? What was the material information? For what purpose it was given? What was the rate and the amount of that farm input?
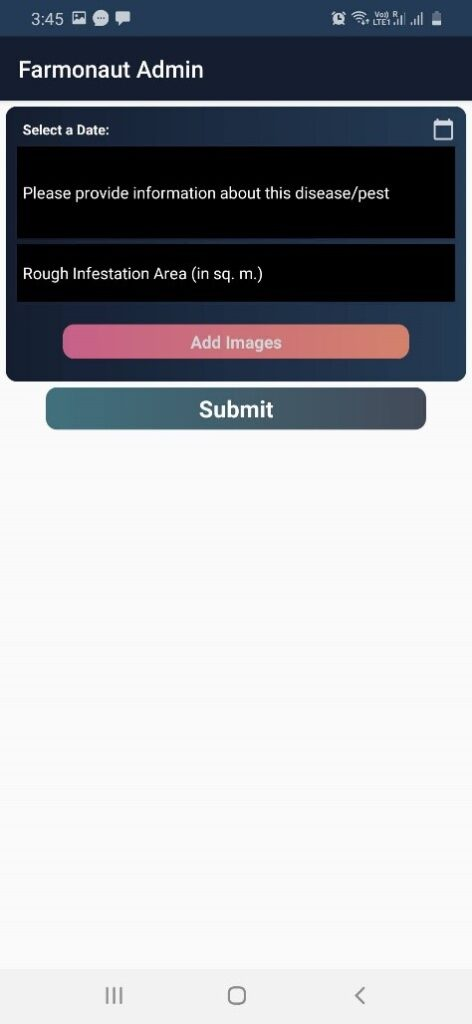
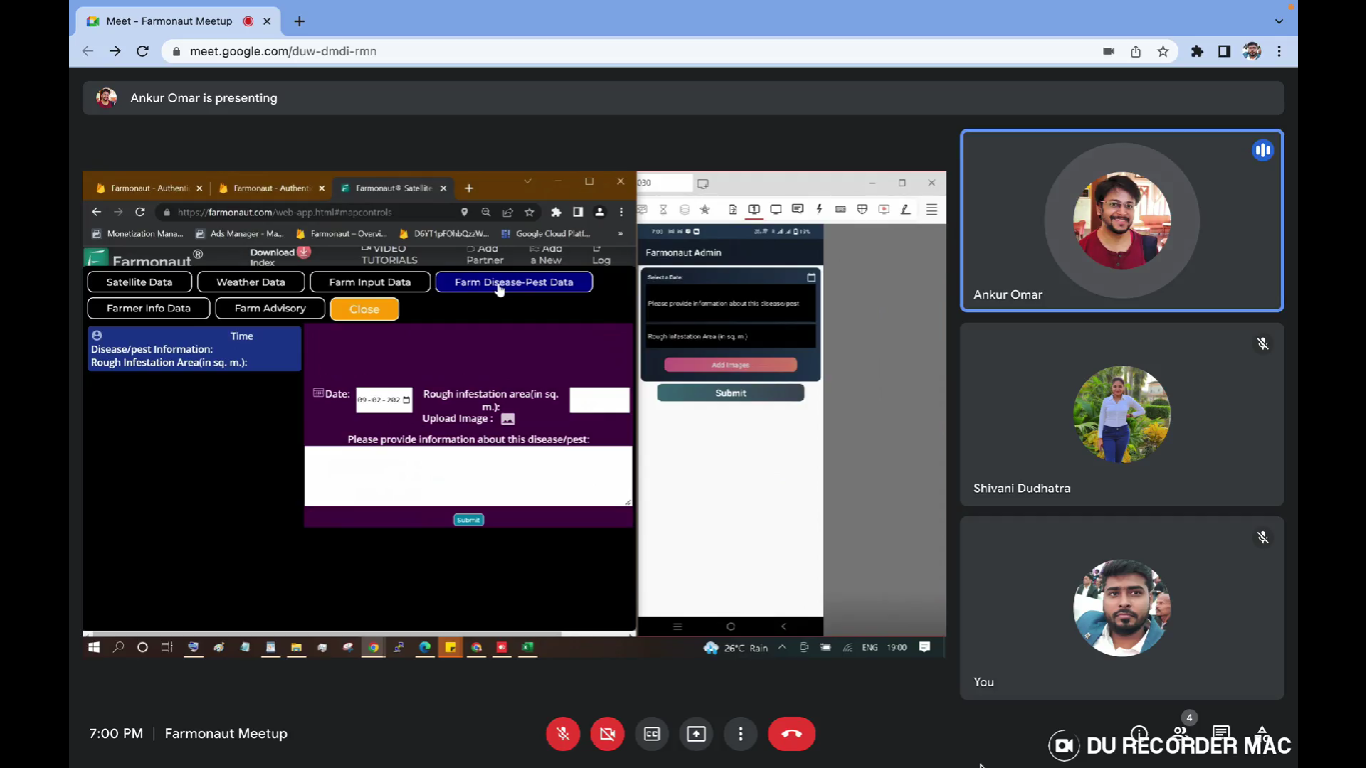
- Add Pest/Disease Data: When any disease or pest attacks occurs the information regarding it can be stored here. The data such as the date on which the disease/pest was identified? Any information about the type of disease/pest? How much area got infected? Can add multiple images of the location that is infected. Can also add the location from where the images were captured.
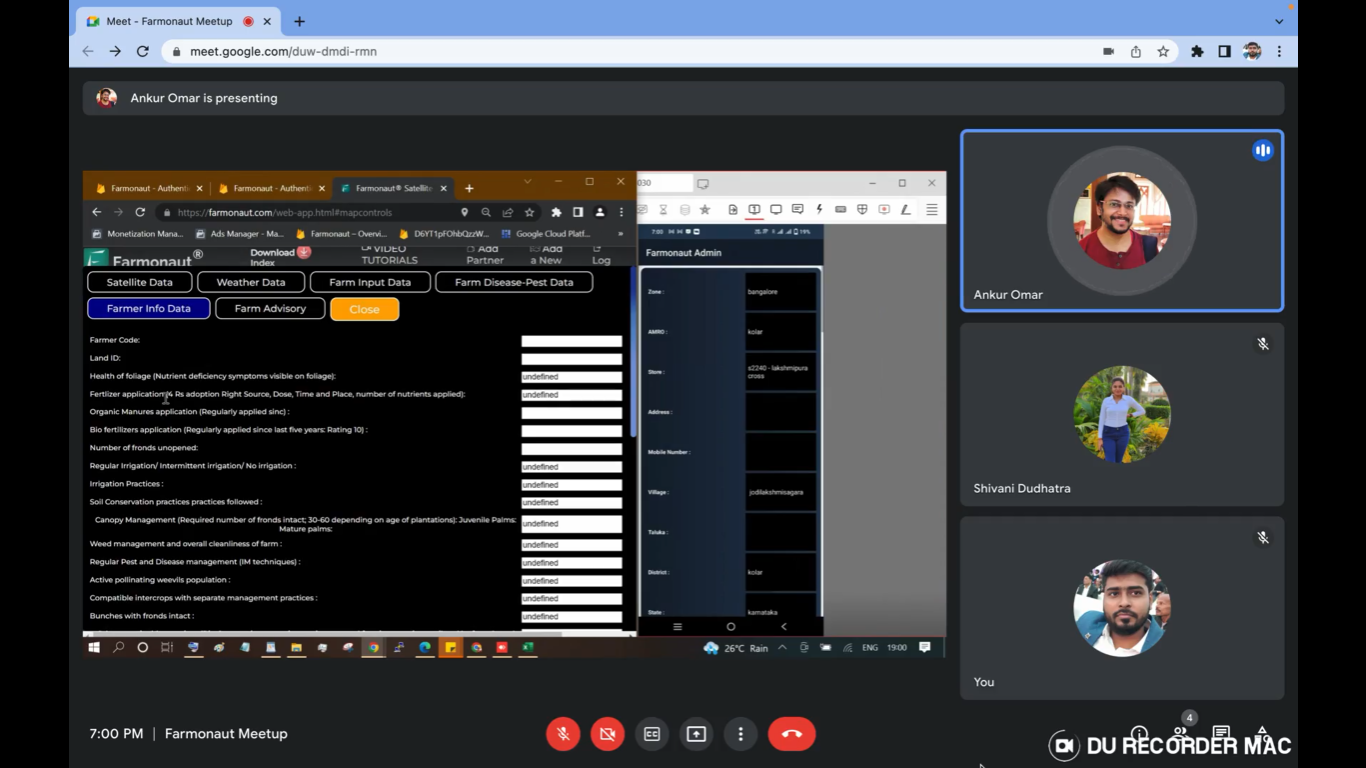
- Add Farmer Info: After geotagging a farm information apart from name, phone number, crop and area can be added in this section. The details such as address, village, talula, district, survey number, soil type, irrigation facility, crop to be grown, variety, expected sowing data, date of geotagging, total area sown, How much area sown of each crop (in case of multiple crop sown by the farmer), farmer code, land ID, farmers irrigation practices and all the related details to farming practices. Hence, the KYC is done fully.
- Add Farm Advisory: To add personal advisory to the farmer this button can be used. The user can add an advisory to it and submit it. The advisory can also be added in pdf format which the system converts to images that can be easily readable by the farmers.

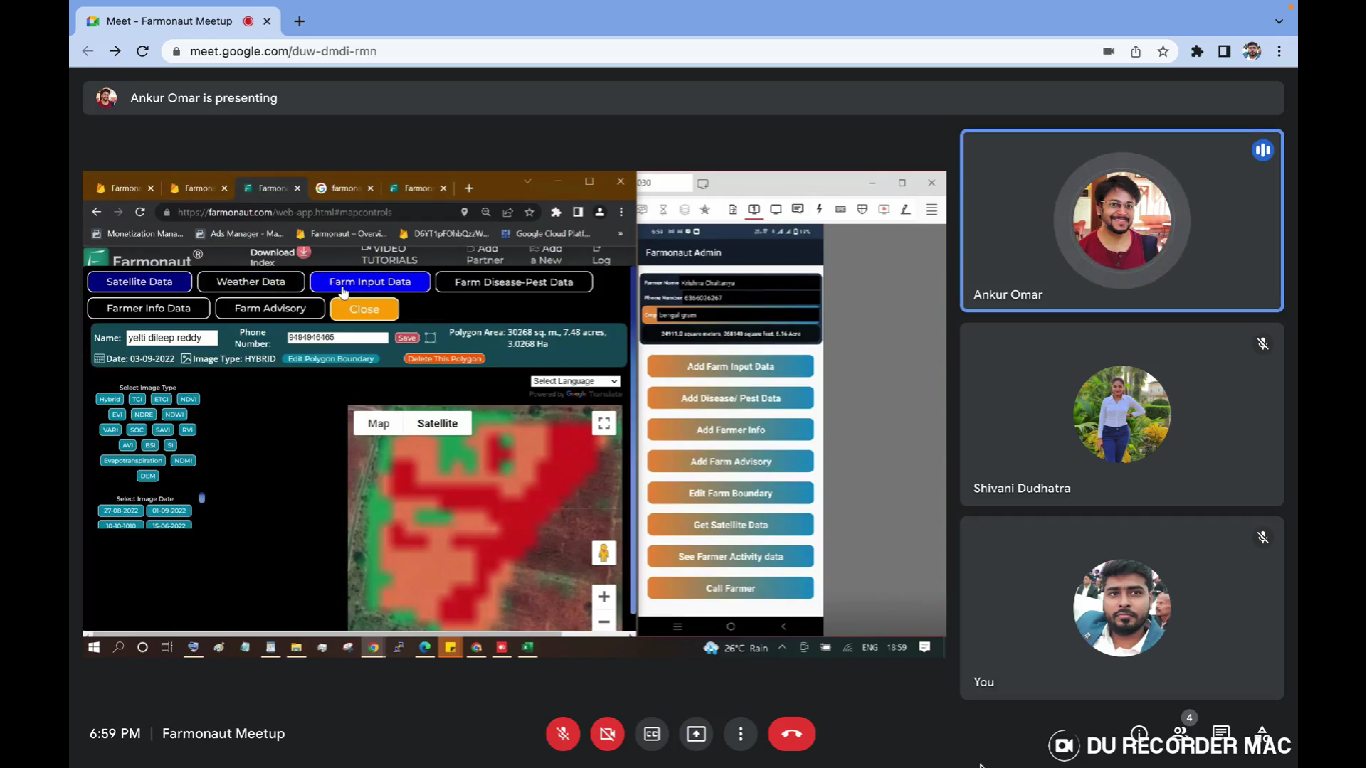
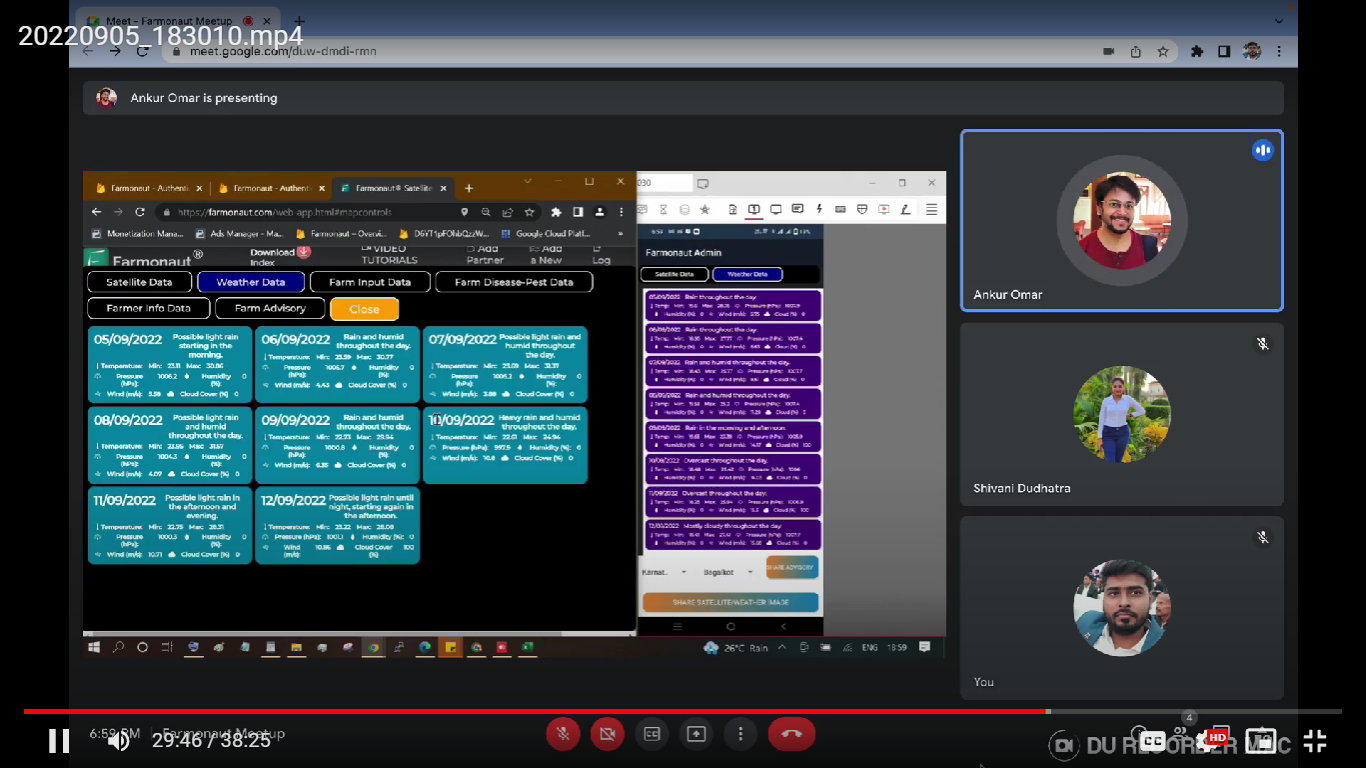
- Get Satellite Data: This would provide you the satellite images of the farm by selecting the type of image you want to display and date for which you want the images. To visualize the image, you can select that image and click on Show to display the image. The images of various stages of crop can be seen such as NDVI, NDRE, NDWI, NDMI, EVI, SAVI, VARI, RVI, SOC, DEM, Evapotranspiration, TCI and ETCI.
The weather data can also be obtained from this tab. The weather data is obtained from the nearest weather station from the farm. When a user wants to share the satellite image/weather data it becomes difficult as he/she must copy the data in text format to send. But with the feature provided by Farmonaut, one can just click on the “Share satellite/weather” button which would convert the data into image format (Screenshot) within a few seconds which can be shared on any platform.

Web Application:
The data captured through the mobile application can be visualized in the web application as well. The changes/edits made are implemented to that particular login account.
When dealing with 5-10 farmers, the village area and other details can easily be obtained by searching on the application. However, when large corporations which deal with a large number of farmers (>500 farmers) have issues in navigating through the farmers. Hence, when the data is captured through a mobile app it can be visualized through the web app.
How to download farmers data?
Once the user login to the web application through the login credentials provided, he/she can download the data of all the farmers that are geotagged under that particular account. To download the data, click on the “Map Controls” button which will show up on the screen with the “Download Data” button. After clicking on it, all the data for all the villages associated with that account would be downloaded. The data is in .KML files and .XLSX file format which is downloaded in your Laptop/PC.
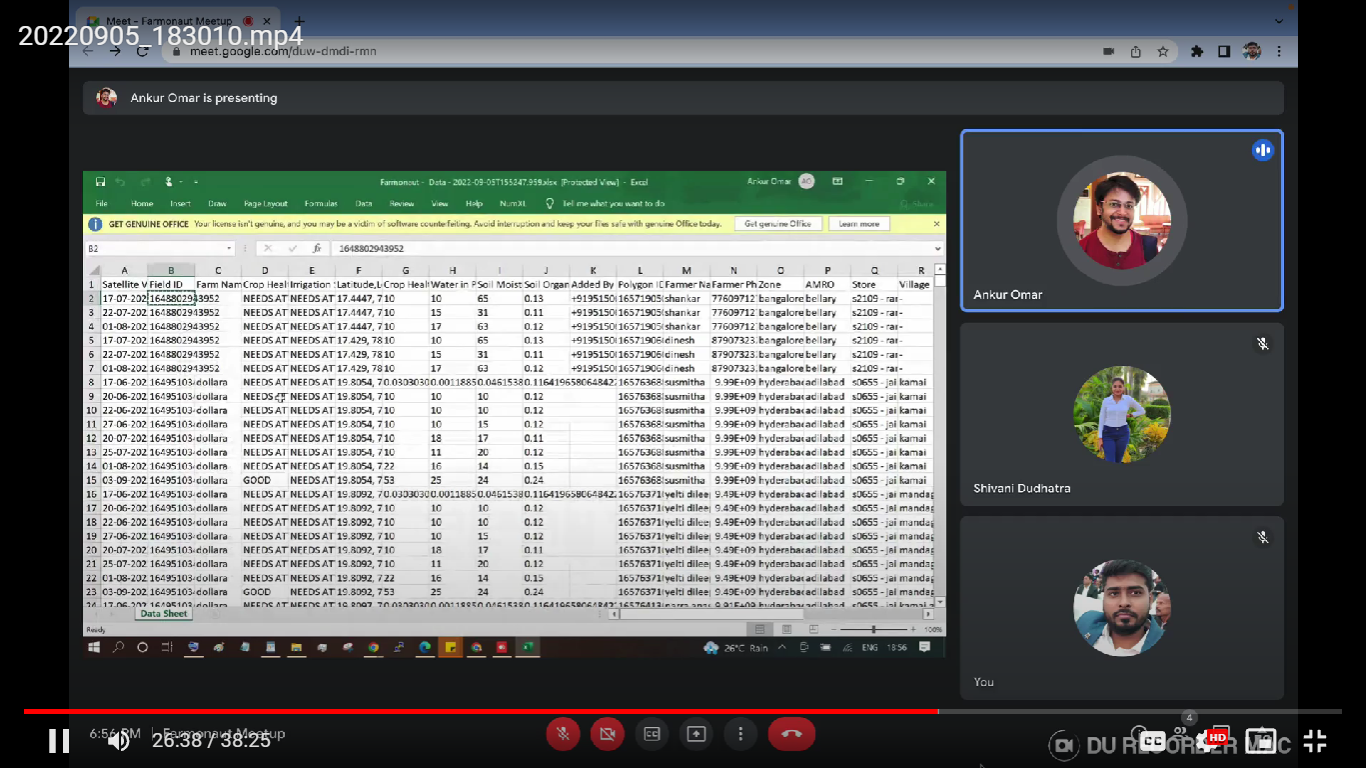
The downloaded excel data consists of overall information on the farmers who have been geotagged: includes Name of farmer, Phone number, Who has added that particular farmer, the ground team member who added the information, his phone number, the village, Field ID, Polygon ID, etc.
How to visualize multiple farms?
From the downloaded data, the Field ID can be copied or also can be typed on the screen. Field ID indicates the village the field exists in. Hence, when we enter the Field ID and click on the search button, at first the entire village would be visible. To see the fields that are geotagged within that particular village can be done by clicking on the “Display Field Polygons” button provided on the left hand side.
To get the information on any particular farm, just click on the field polygon.
![]()
How to add advisory at village/district level?
When there are more farmers associated within the boundary (let’s say 3000 farmers in a district), it would be feasible to set advisory for them at macro level. In order to do so, corporations can create advisory for primary crops in that area and then upload it through the application. Select the file of the advisory, it can also be previewed and then Click on Upload button.
CONCLUSION:
Farmonaut has developed an admin application for the large corporations for better management and quick process of the immense data of the farmers that are obtained. With this application, they can add new farms, visualize data, download multiple farmers data, Provide advisory services, get weather reports, visualize the satellite images and share the data to various platforms as well. The farmers being the ultimate beneficiary, the data to them are provided by the ground team which uses this application for geotagging and the office team uses it to navigate and provide advice to the farmers. Farmonaut has been providing these services to corporates such as Coromandel International, Troforte Innovations, Godrej Agrovet and many more.
LINKS TO:
Article: Admin App Tutorial
Video: Admin App Tutorial