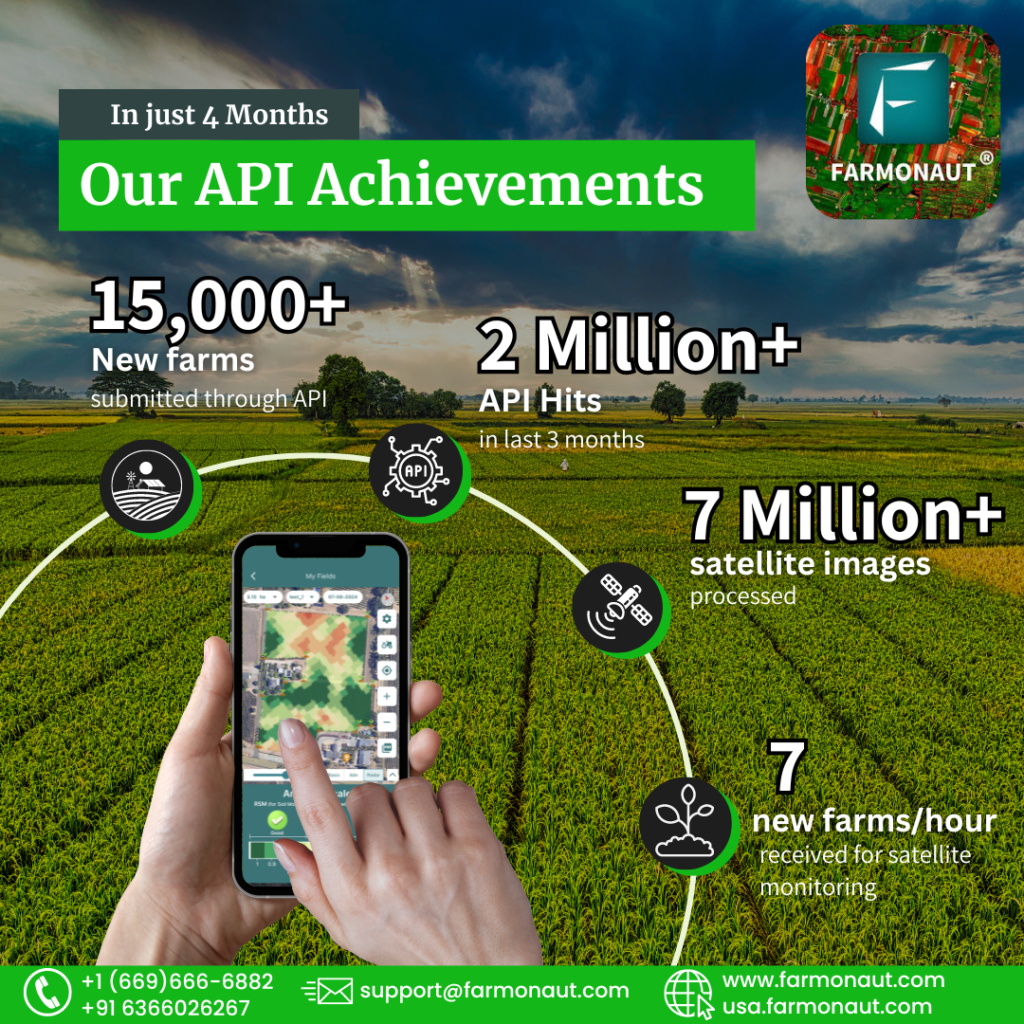
Developing your own custom agricultural remote sensing solutions is super easy with Farmonaut® API. Simply make a few API requests and our systems will automatically generate all the satellite data (NDVI, NDWI, EVI, VARI, SOC, TCI, ETCI, NDMI, Evapotranspiration, DEM, RADAR and HYBRID) as well as the weather data for all the fields submitted by your organization.
For partnerships/ large scale/ custom requirements contact us at : [email protected]
Get Detailed List of provided data in the next section Find how to use & test the APIs in the doc section
Introduction
What you will get?
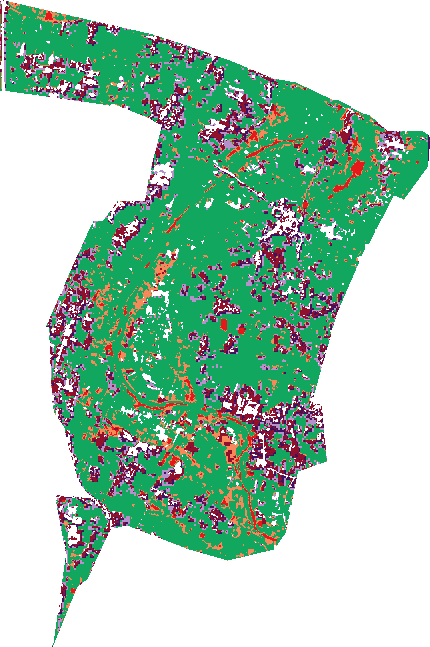
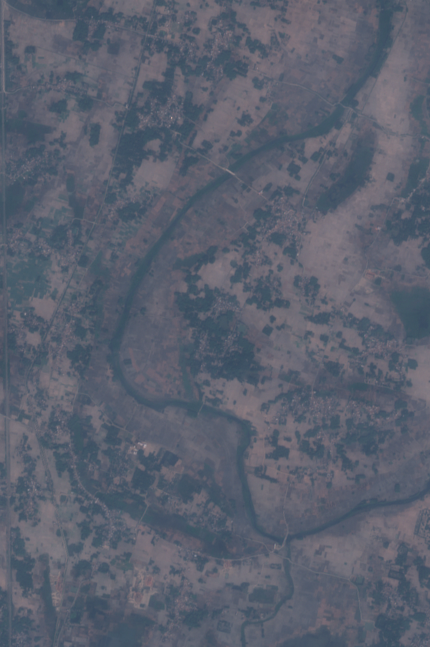
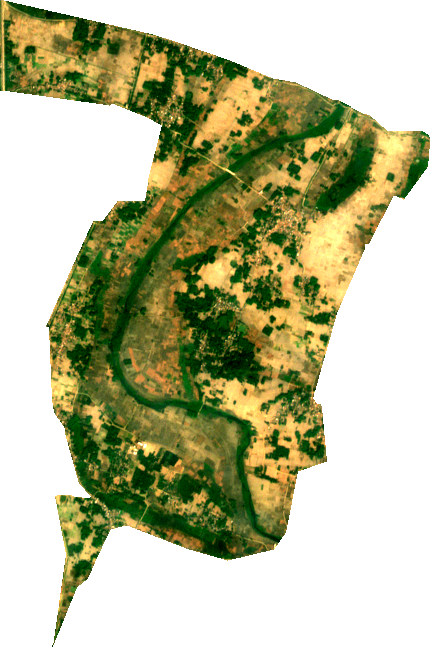
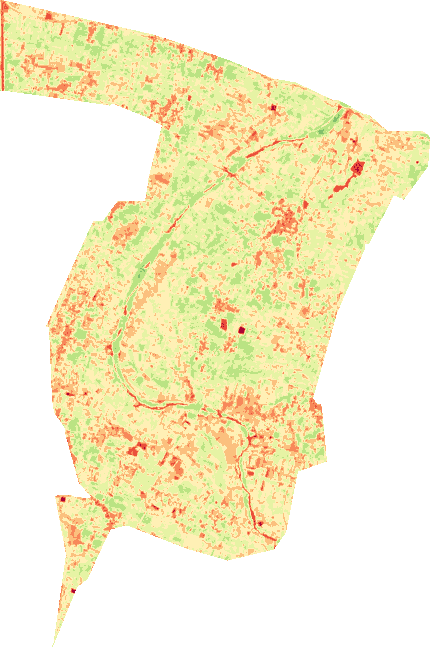
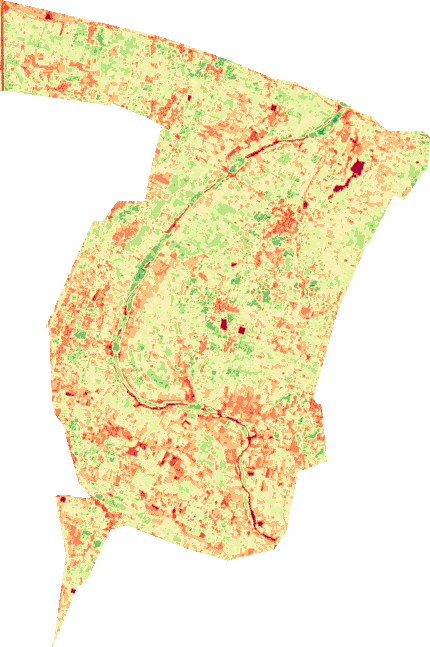
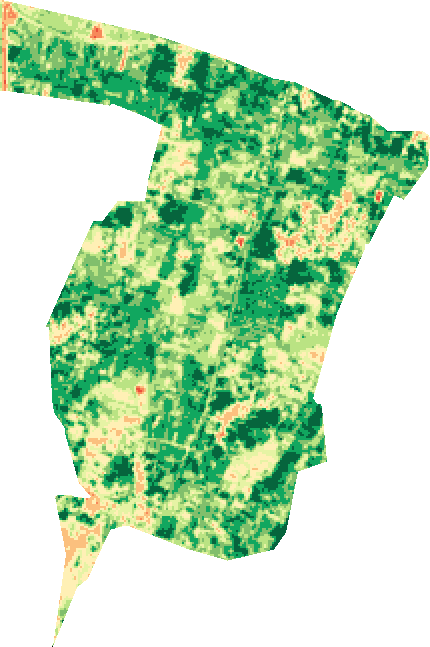
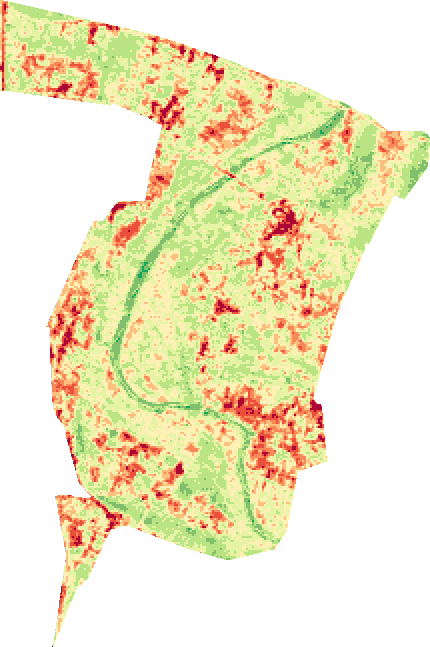
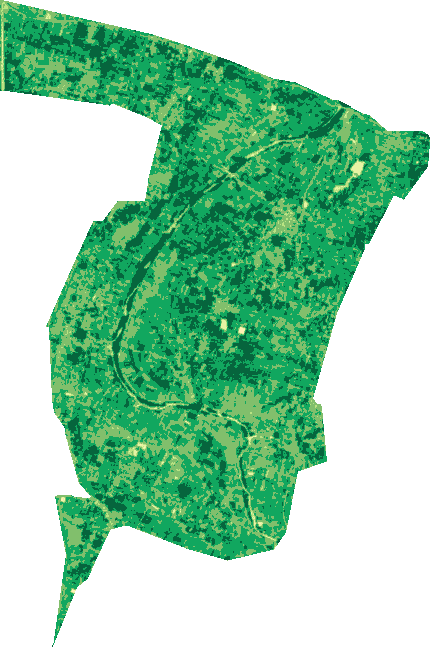
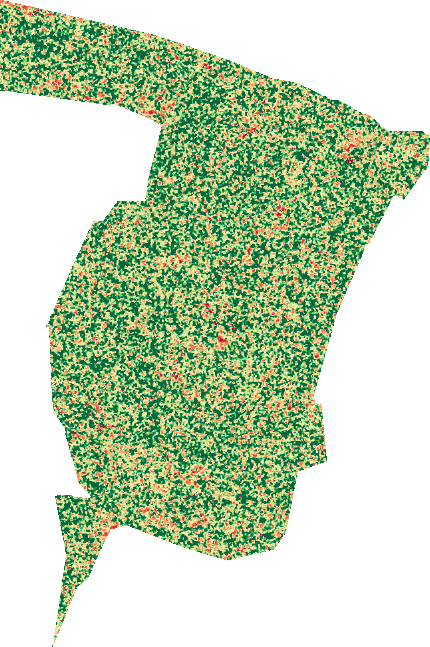
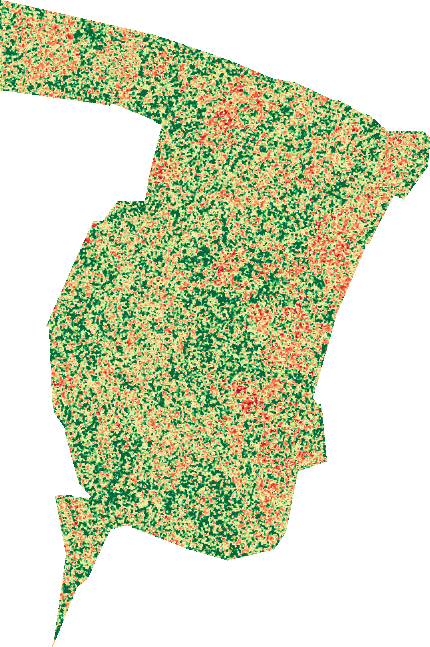
Image Types
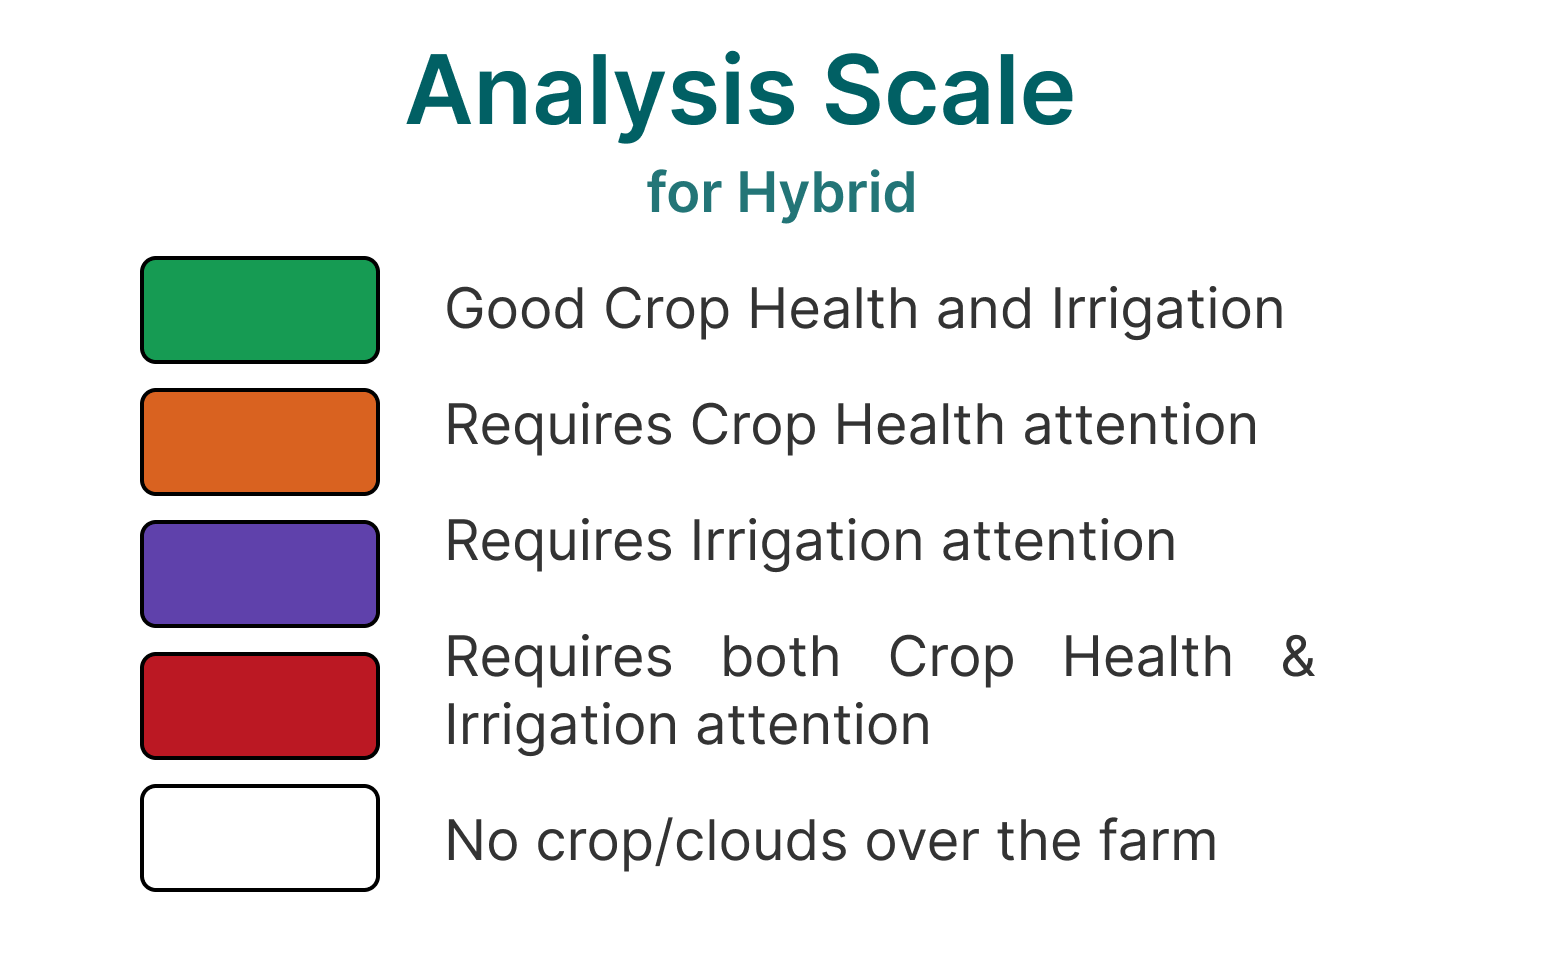
Hybrid
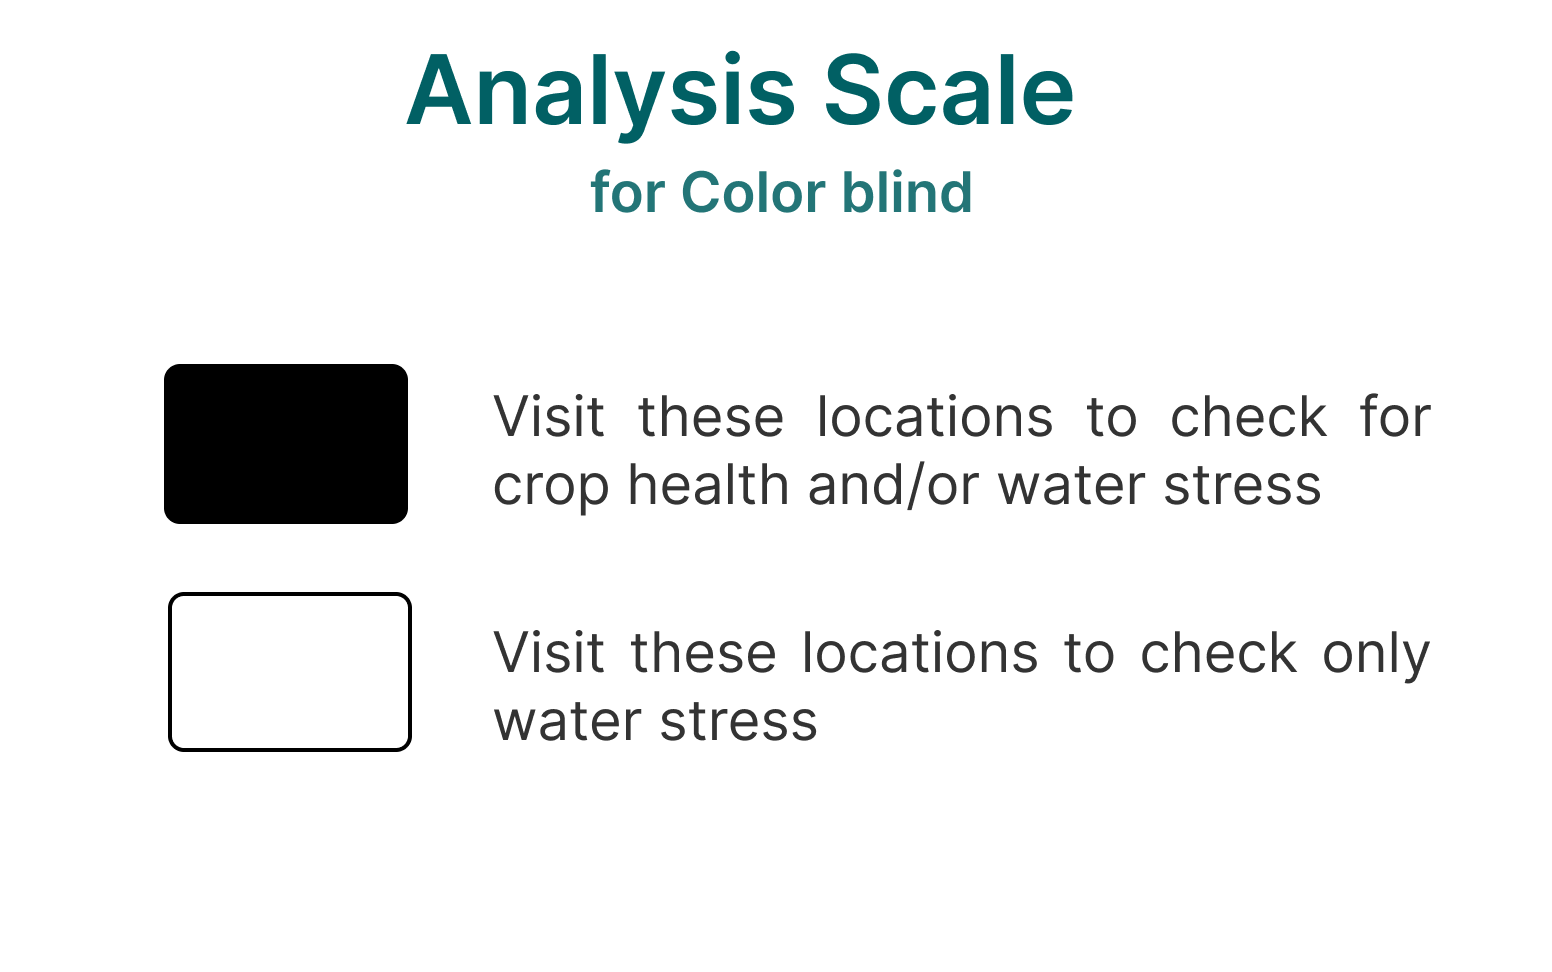
Colorblind
TCI
ETCI
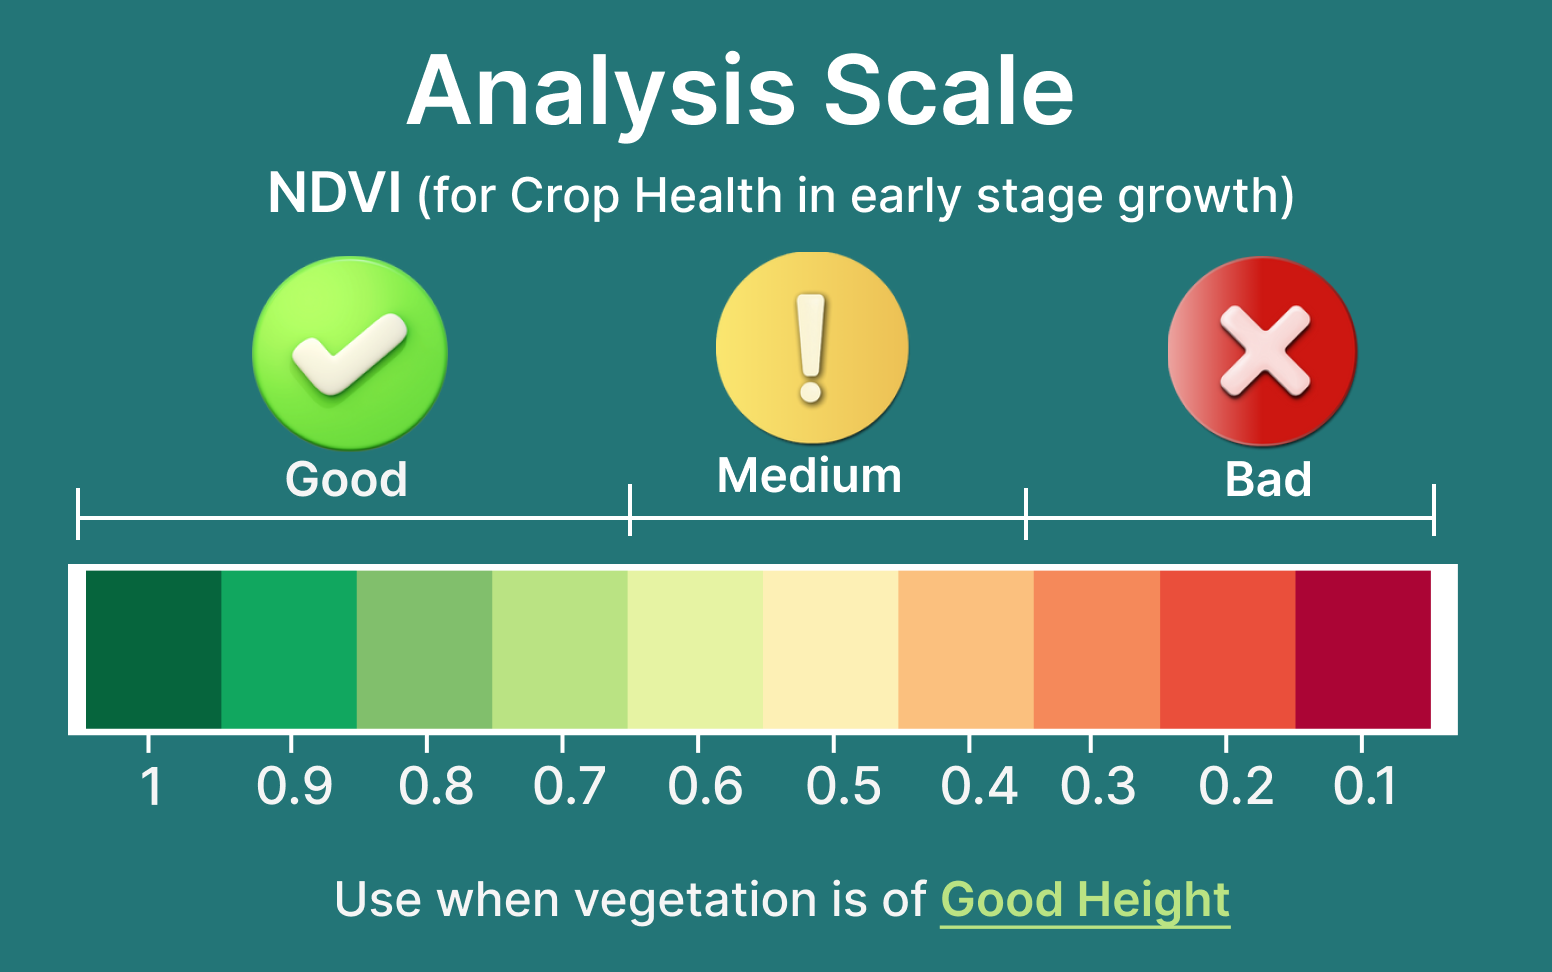
NDVI
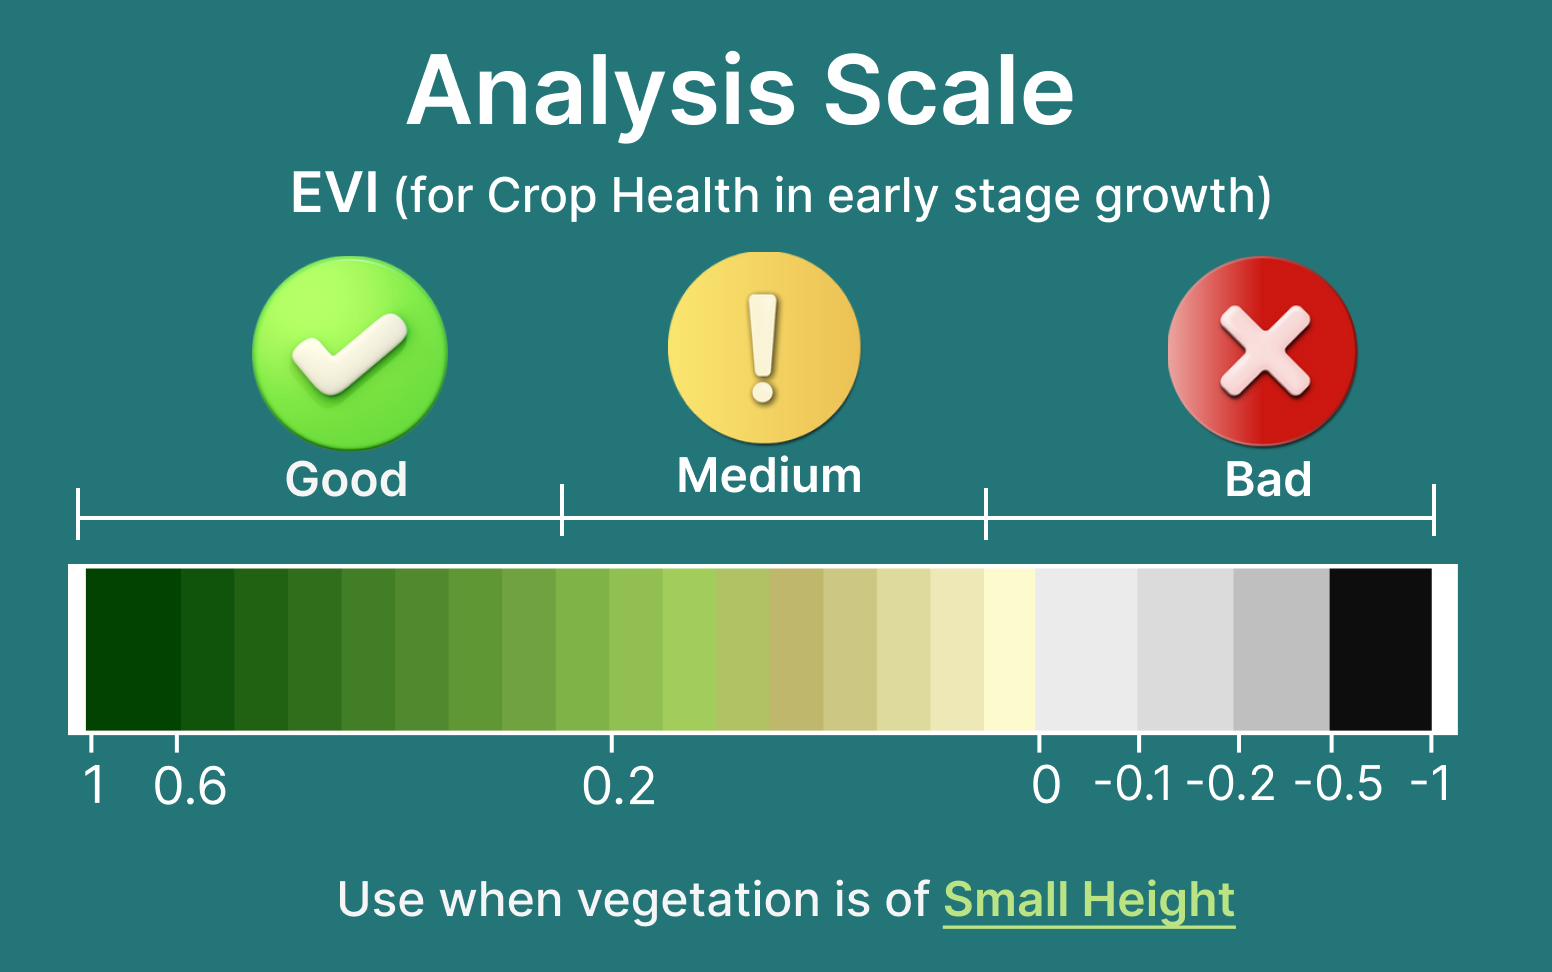
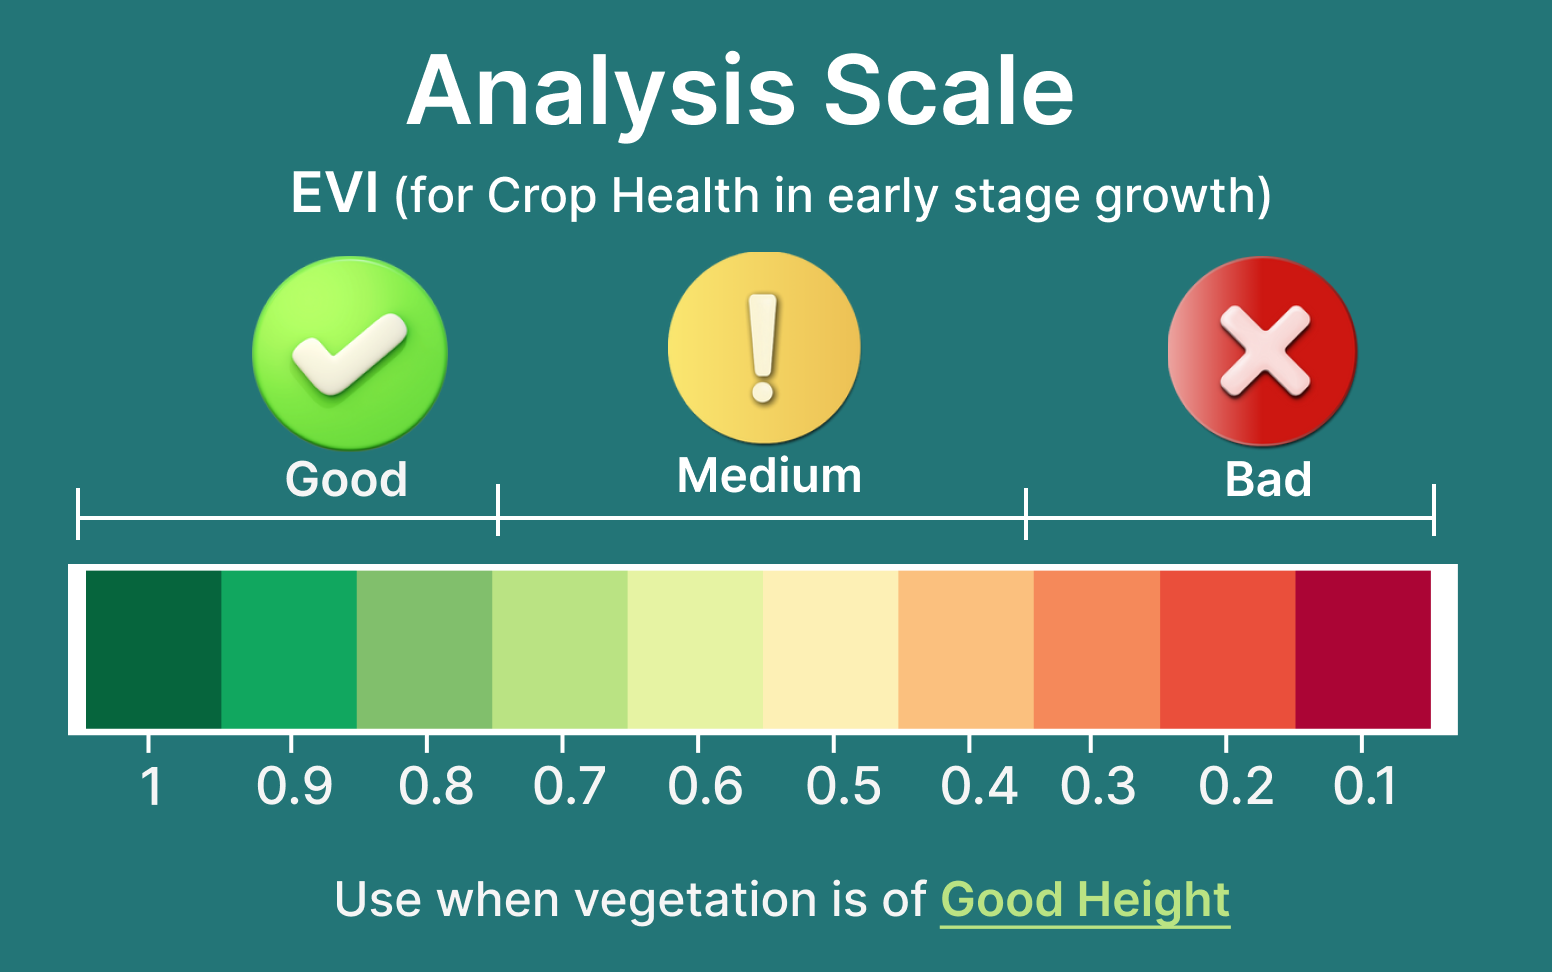
EVI
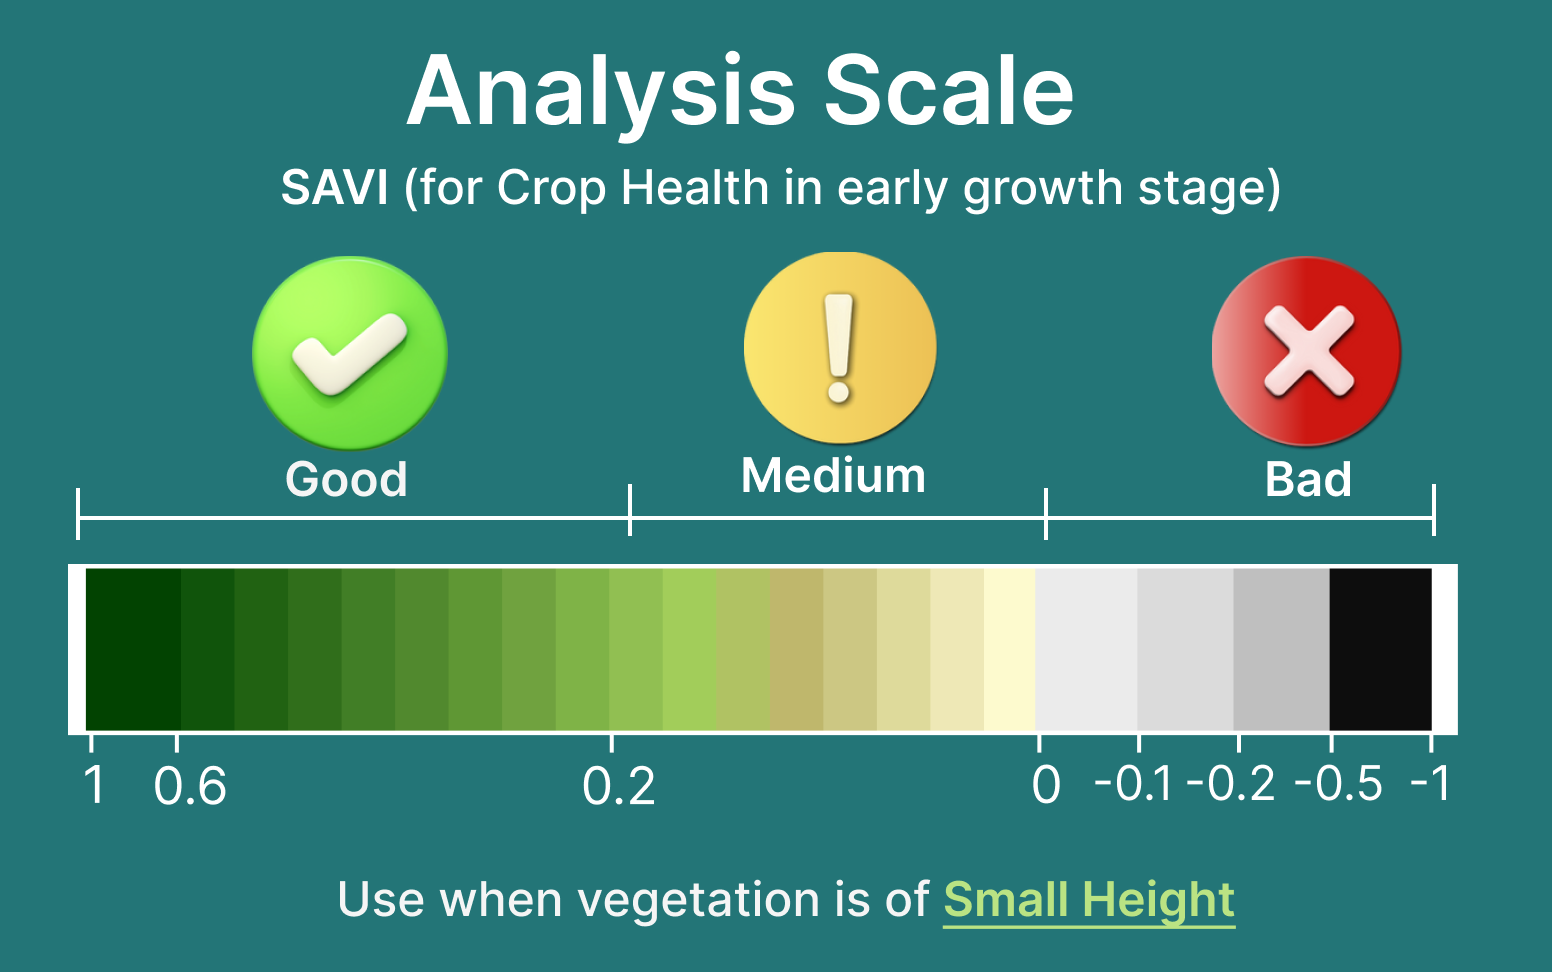
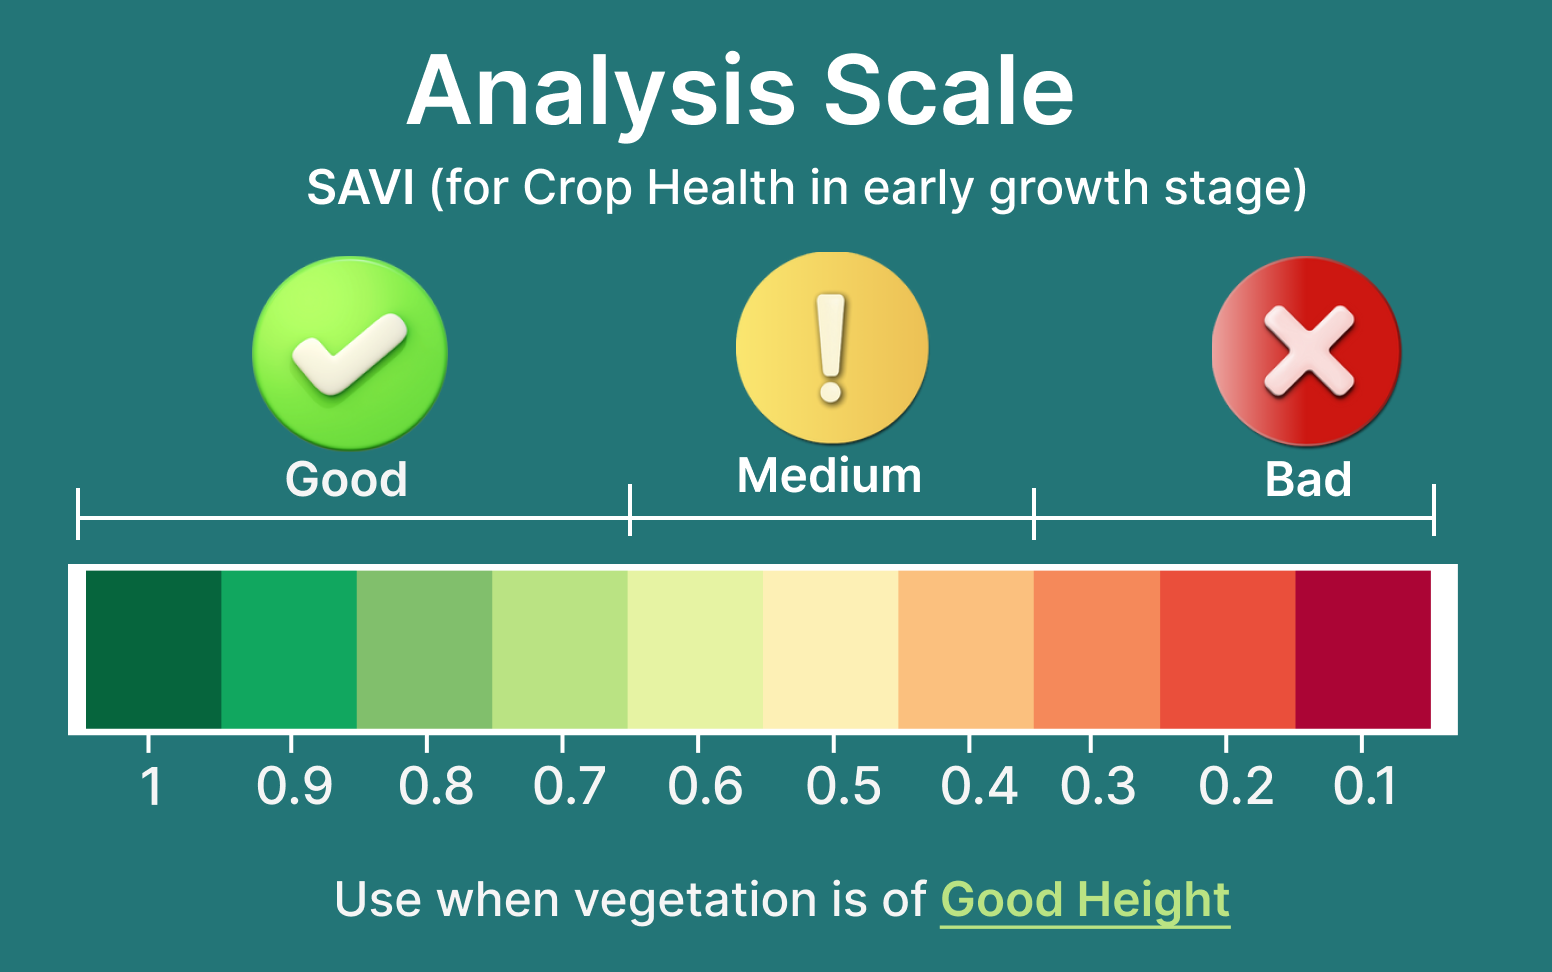
SAVI
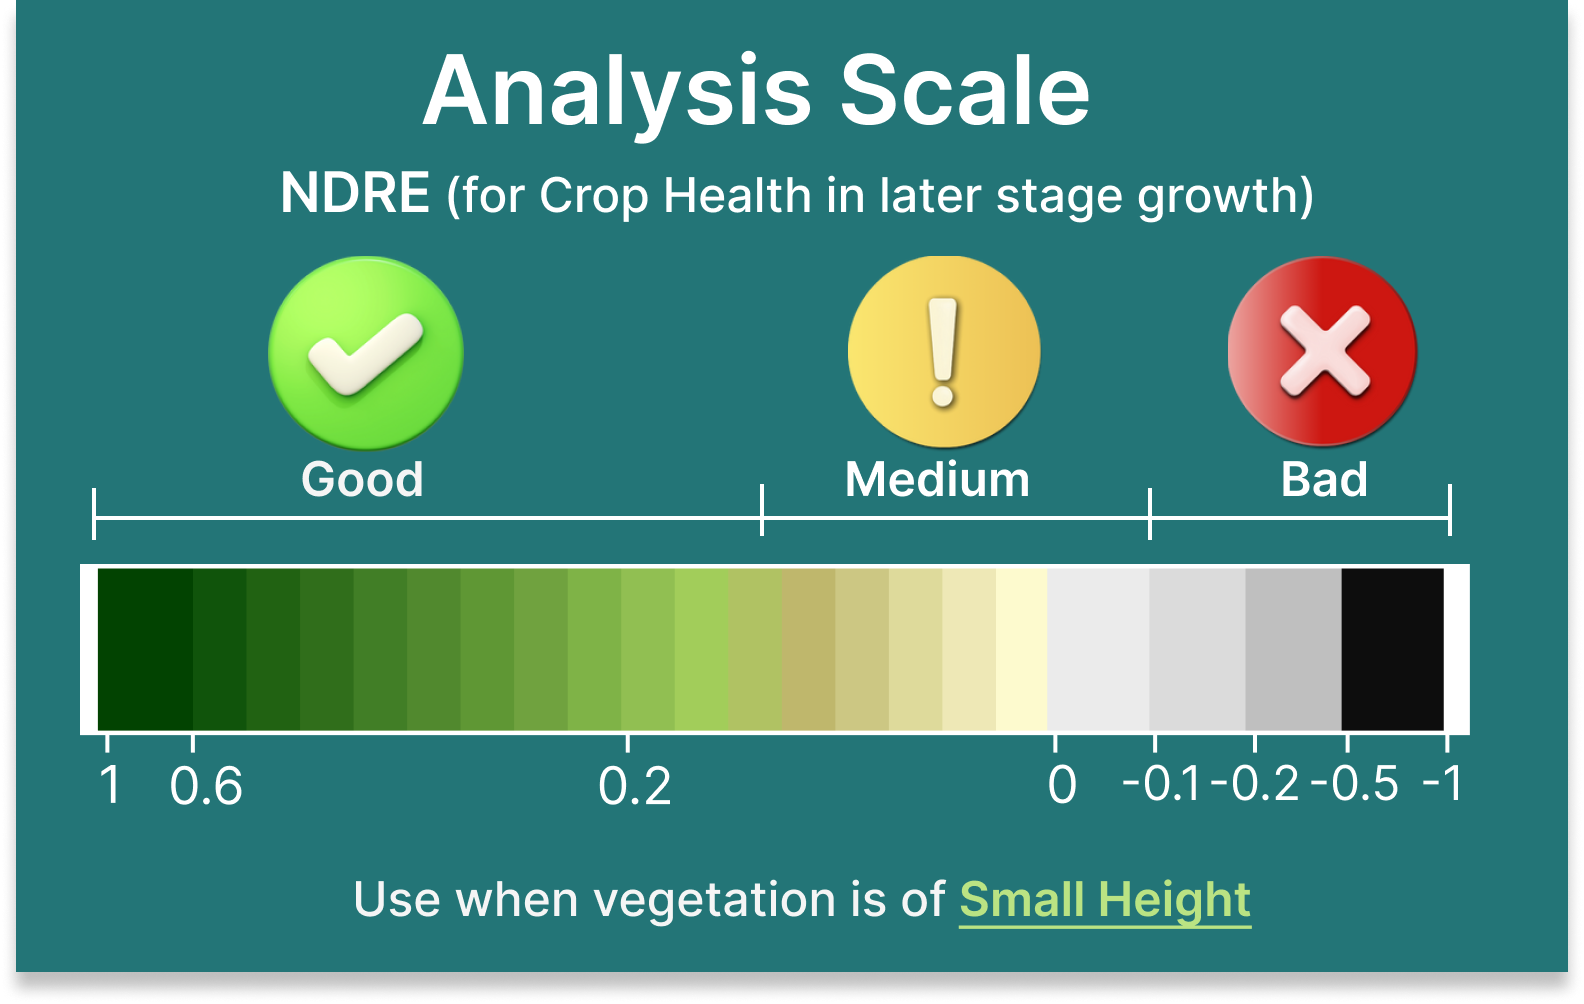
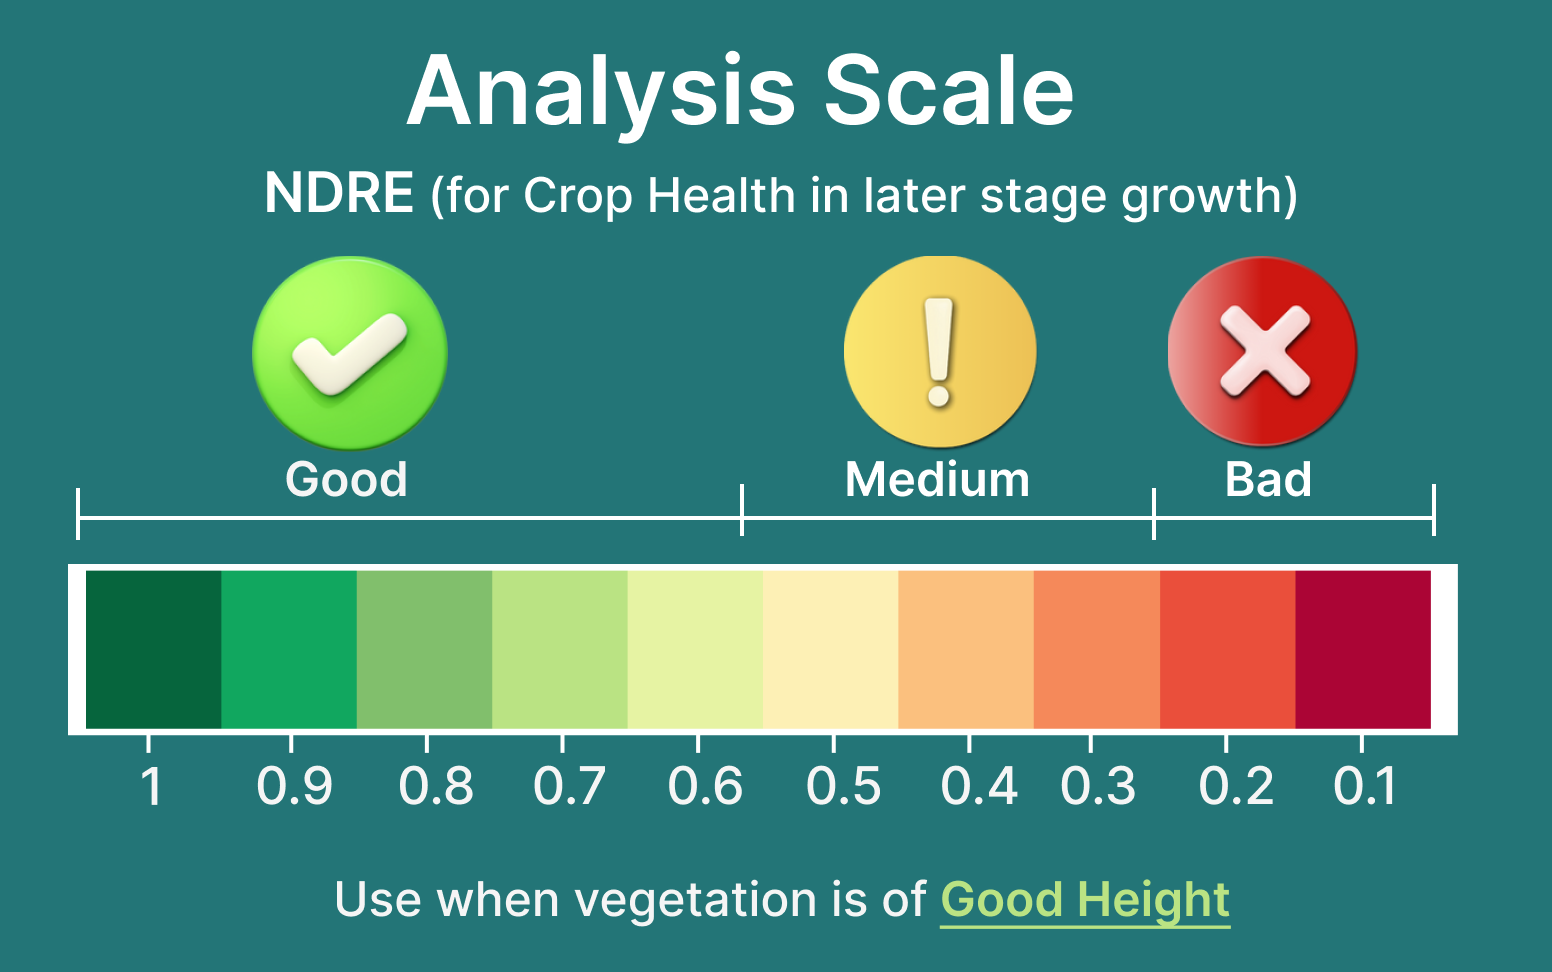
NDRE
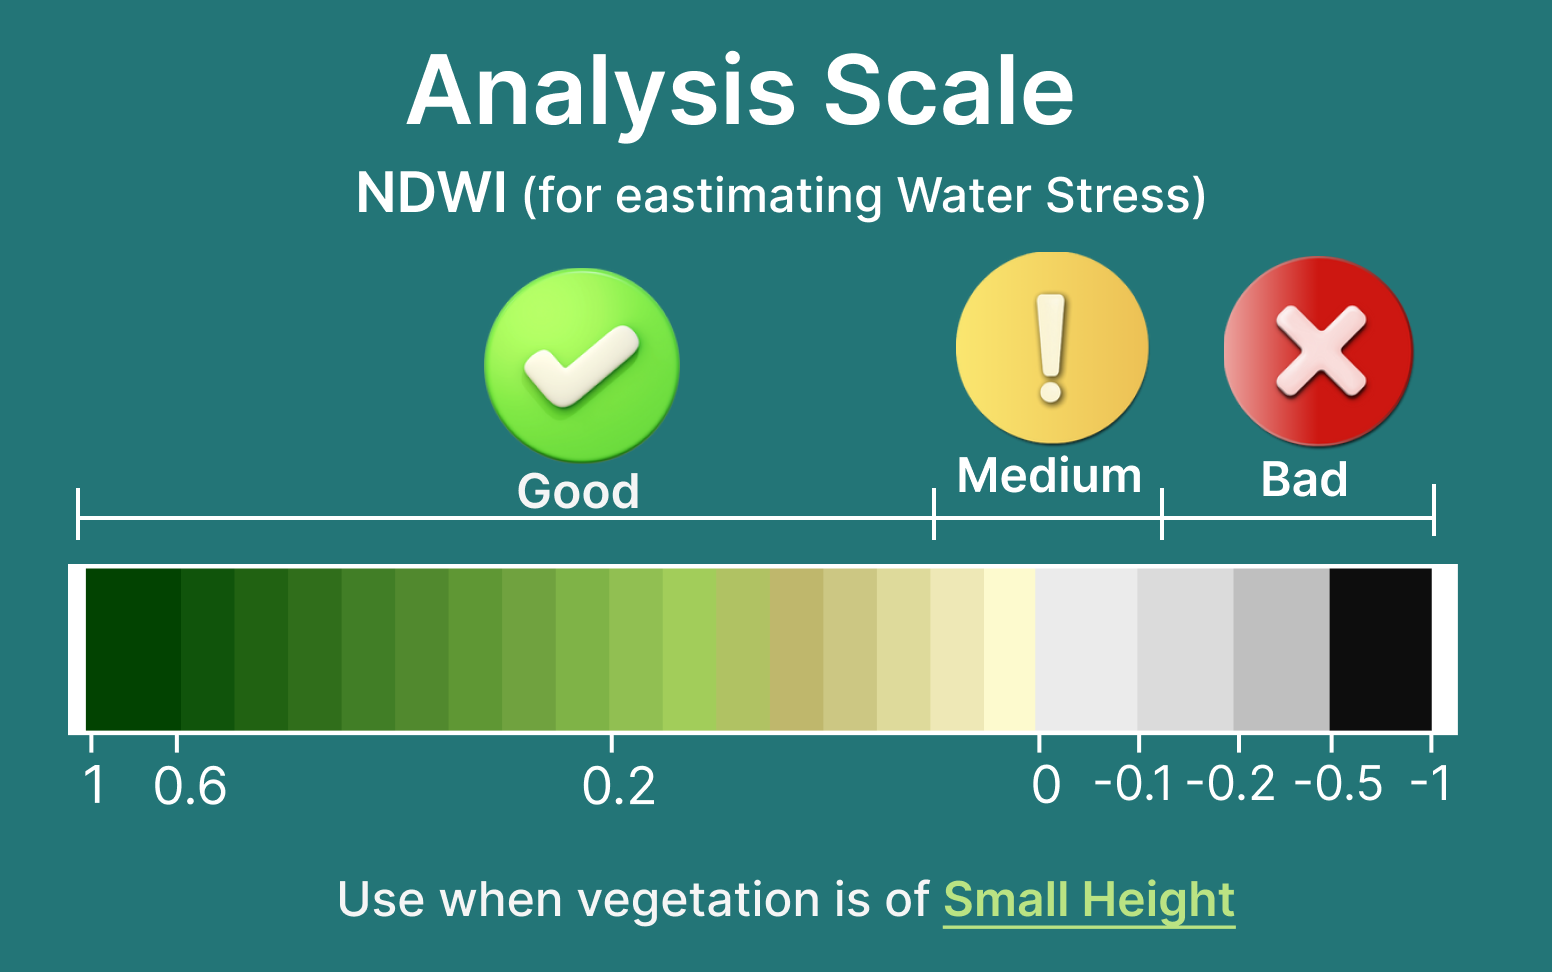
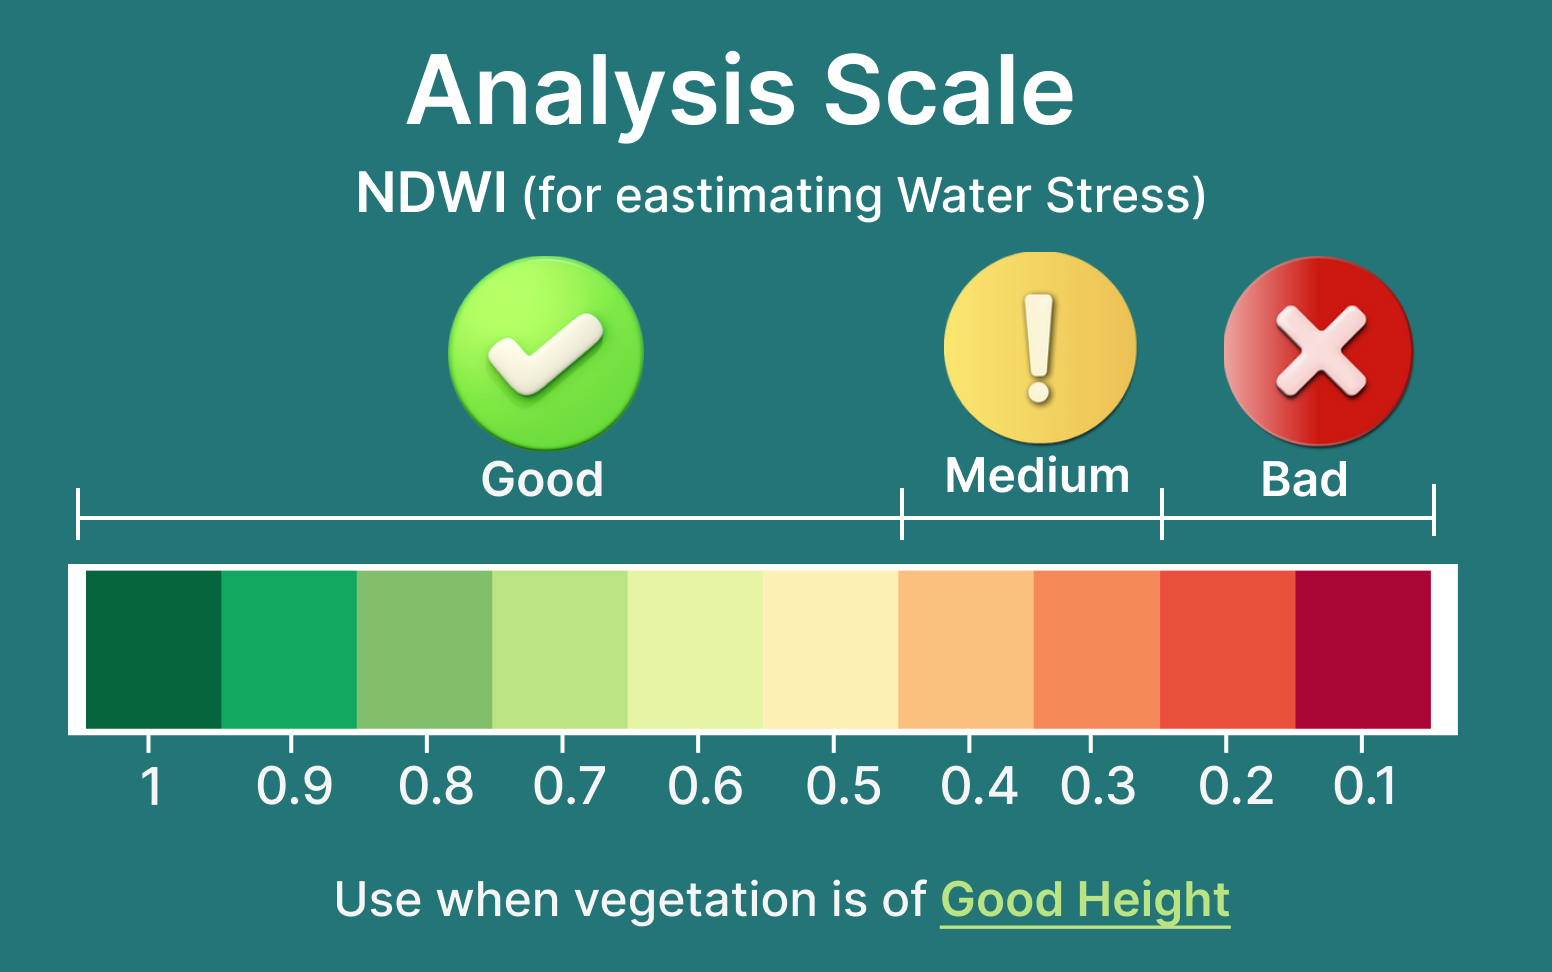
NDWI
Evapo
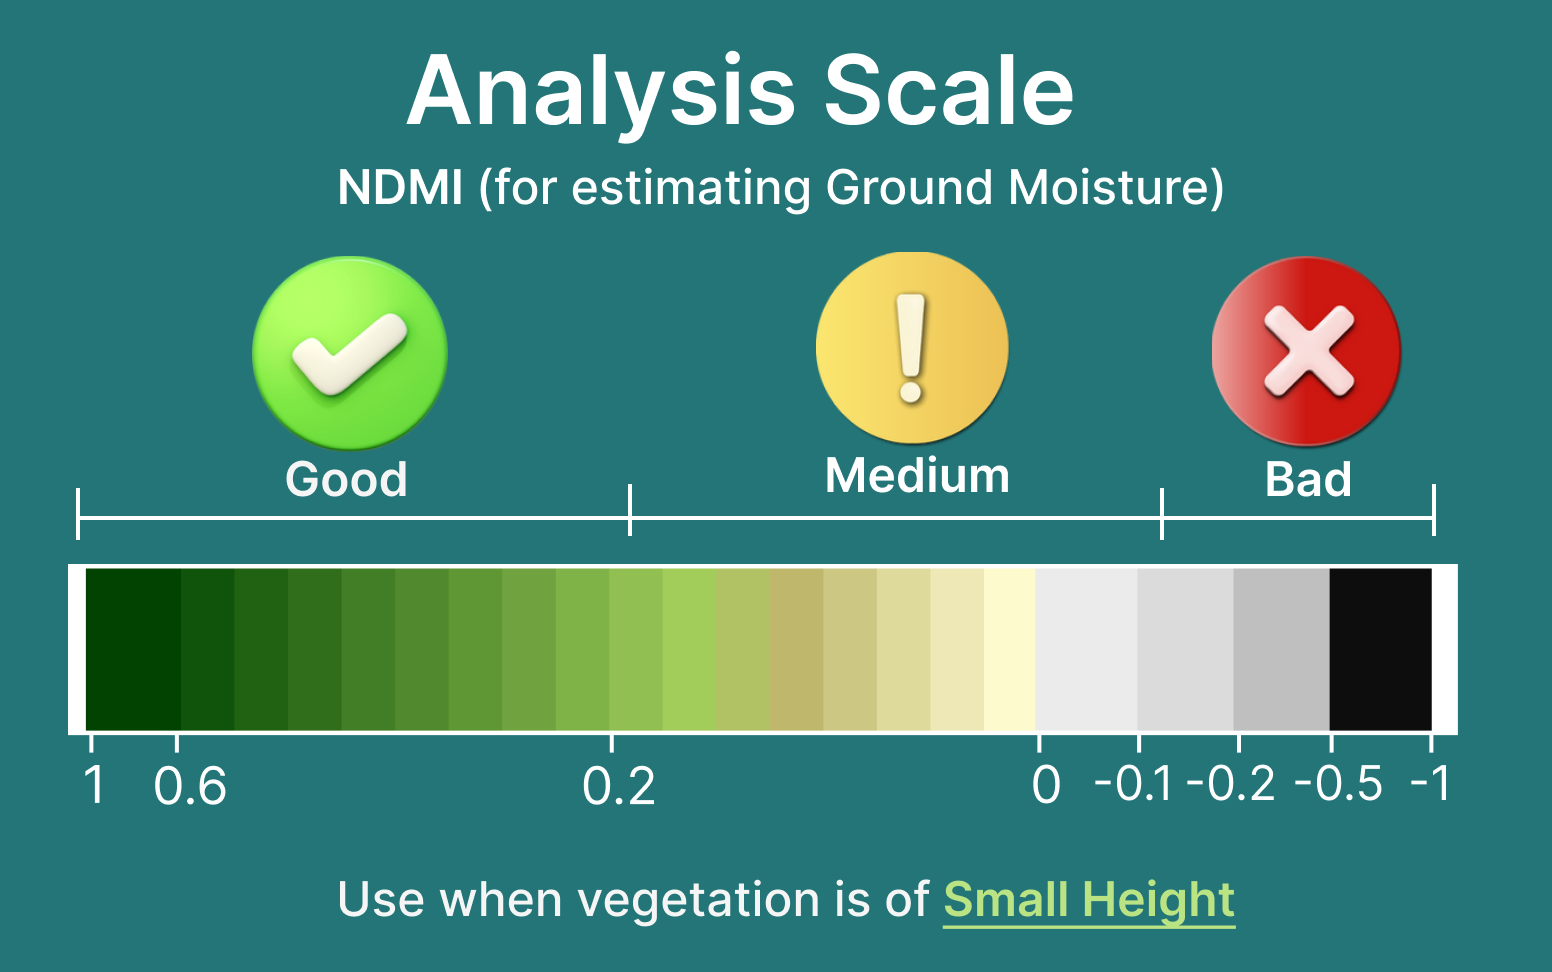
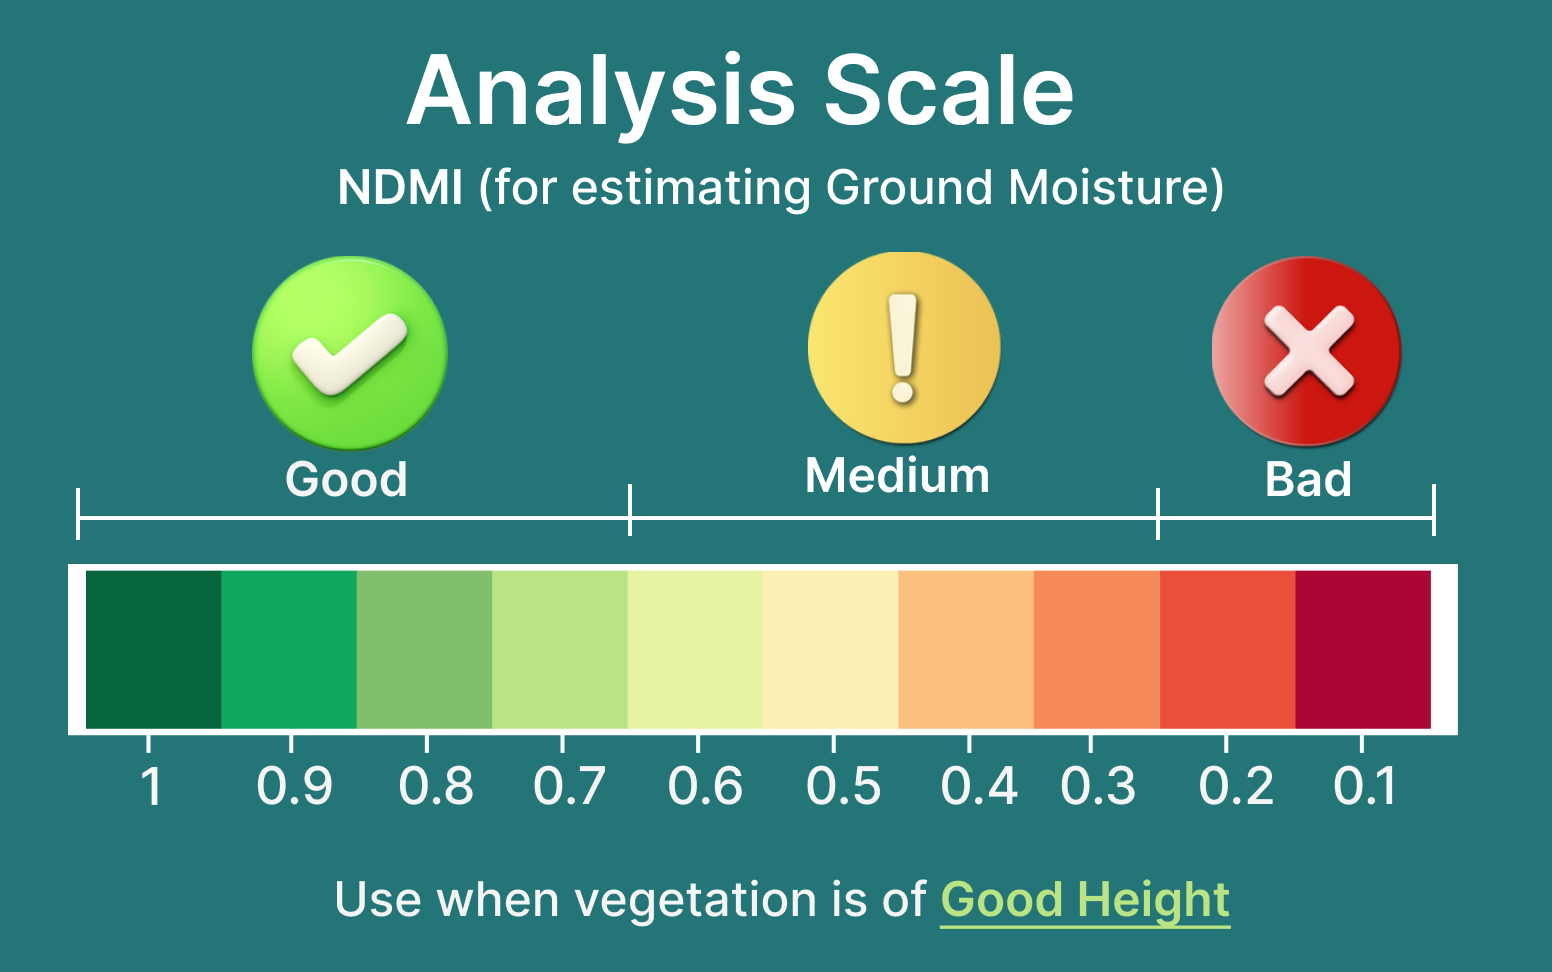
NDMI
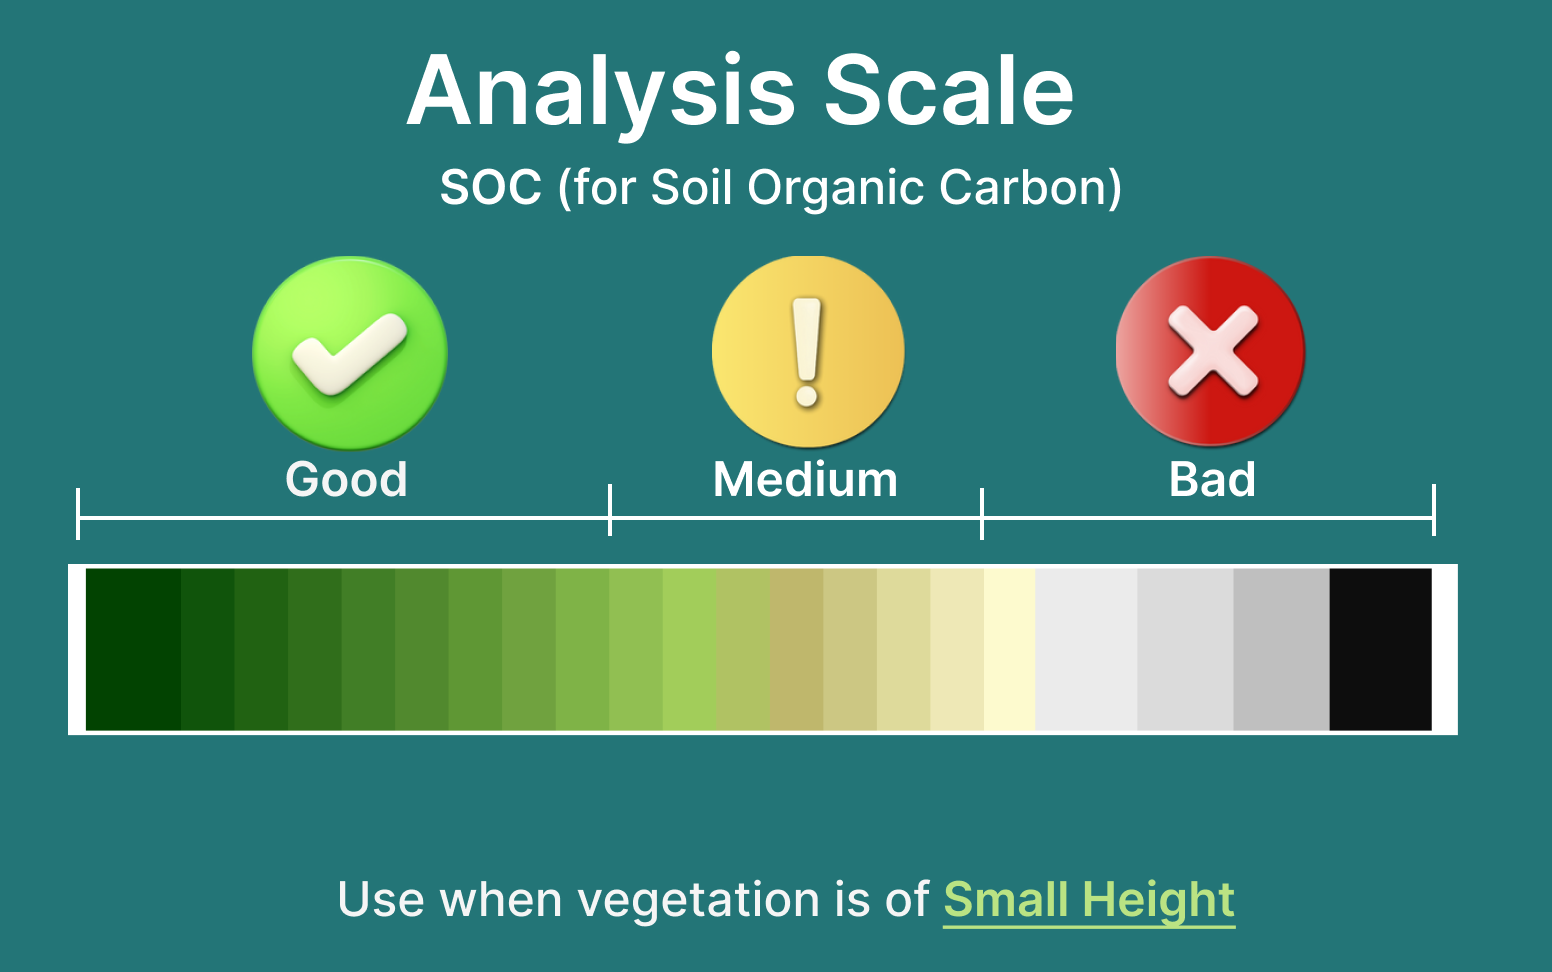
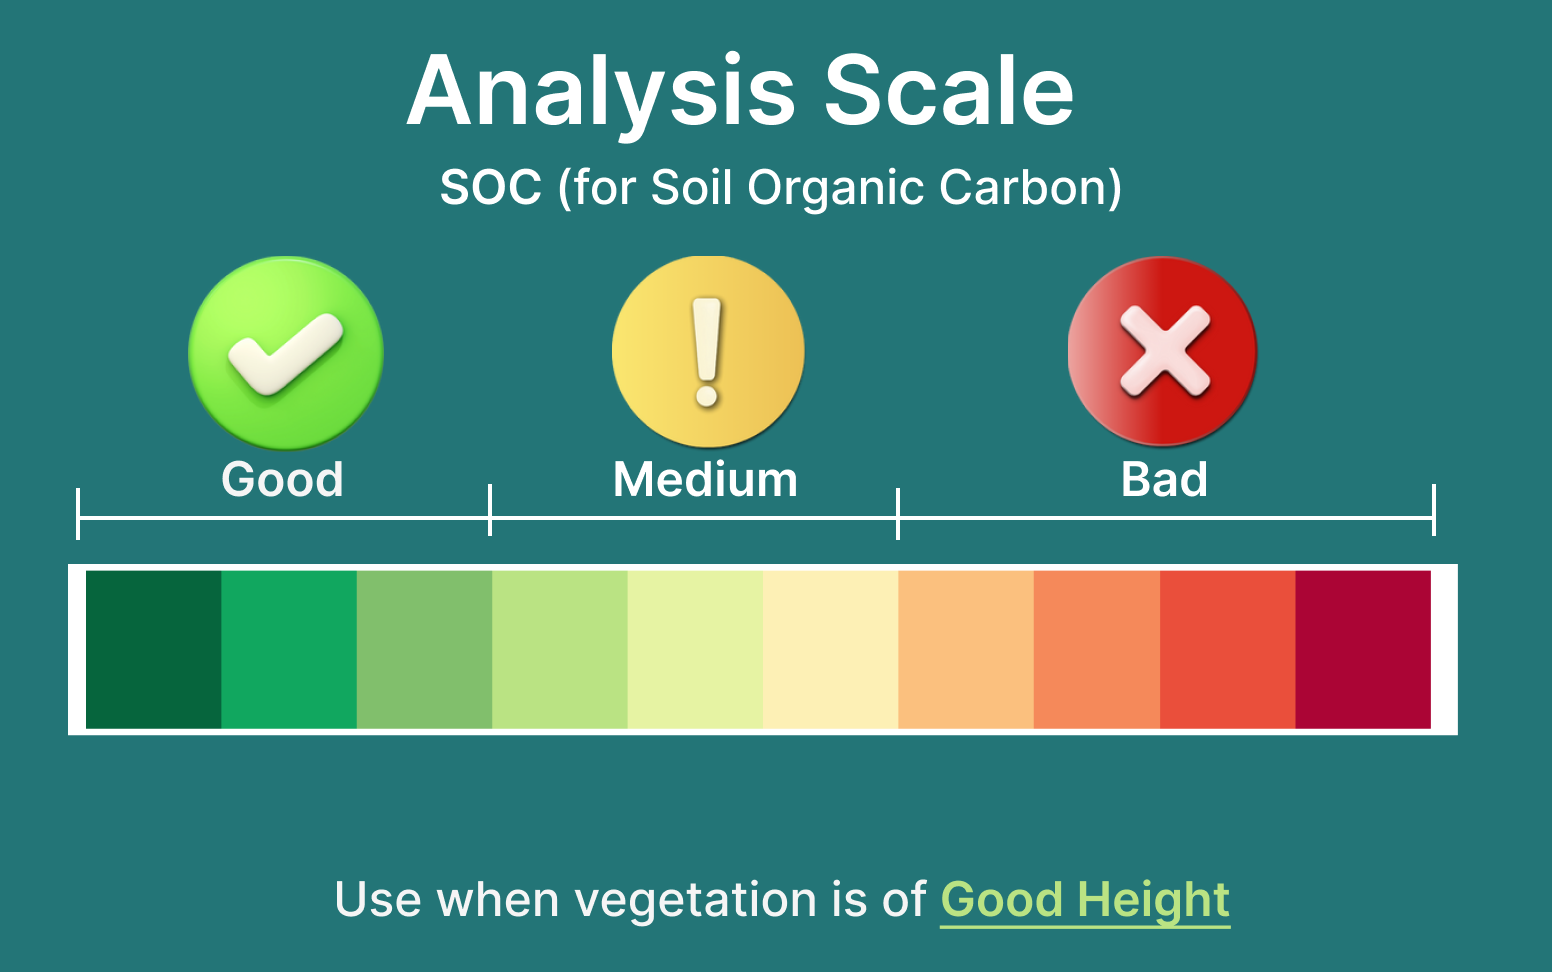
SOC
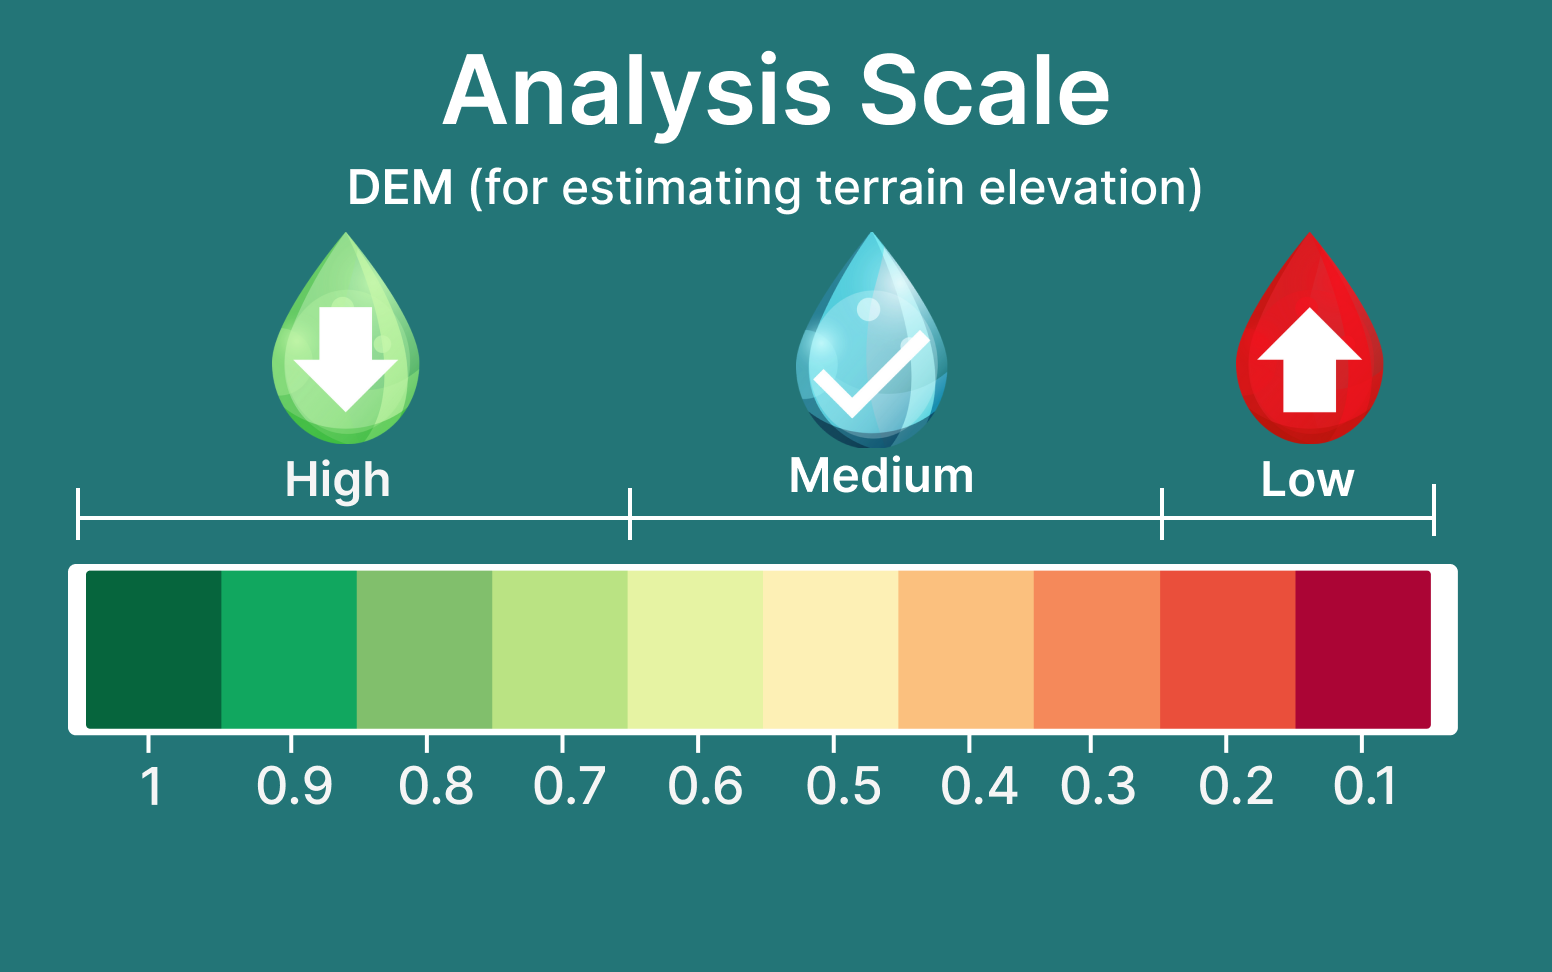
DEM
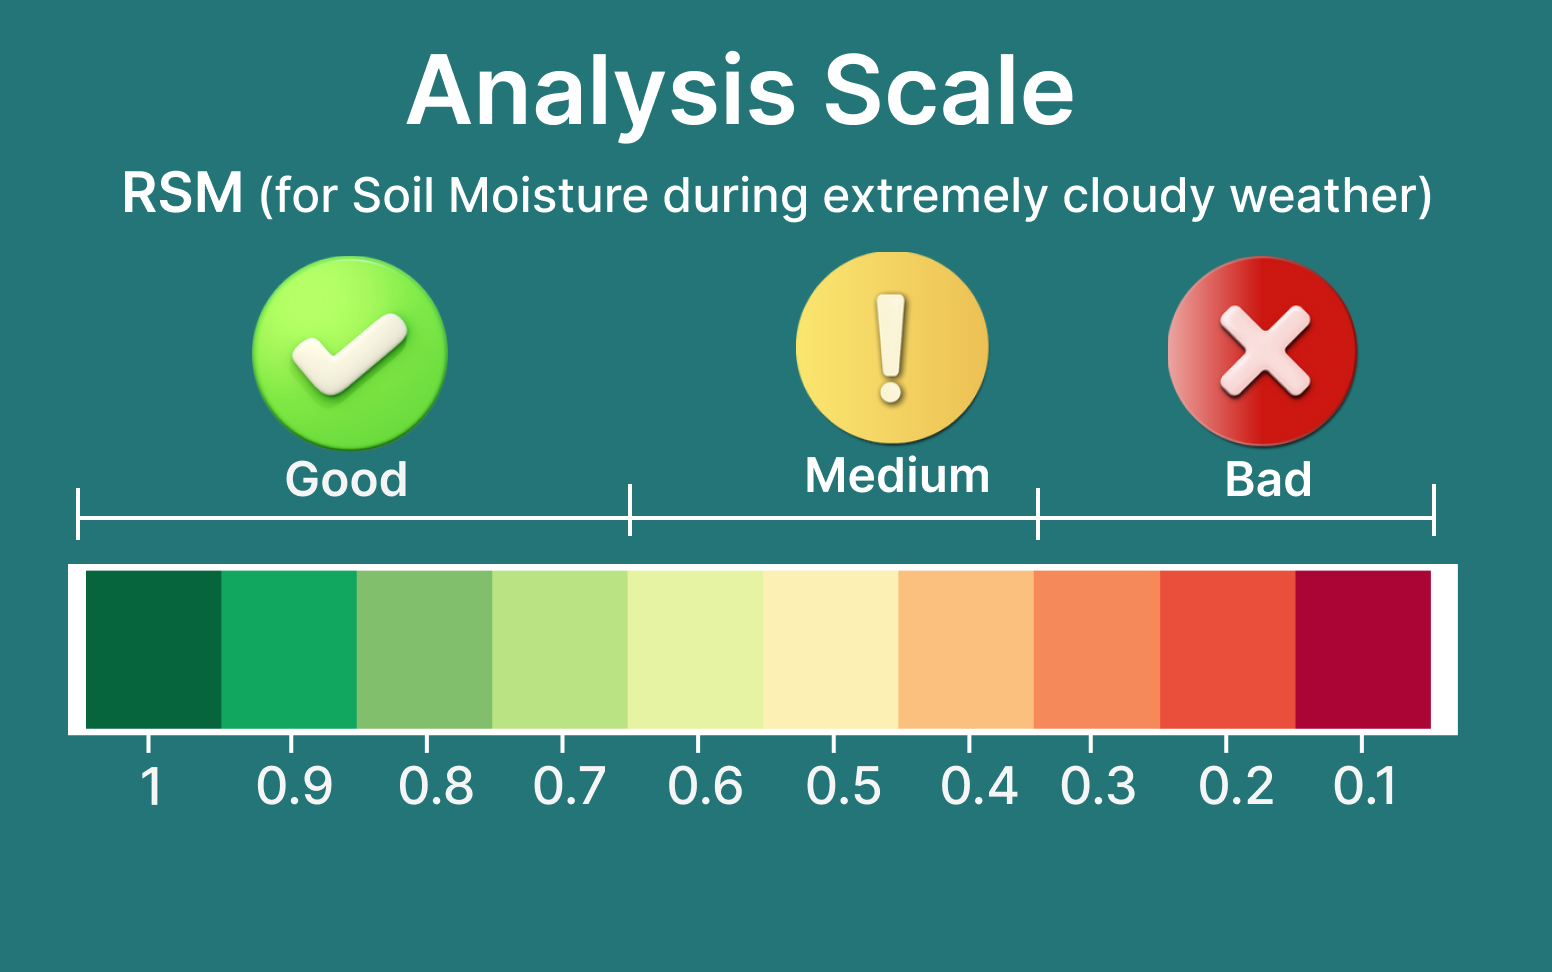
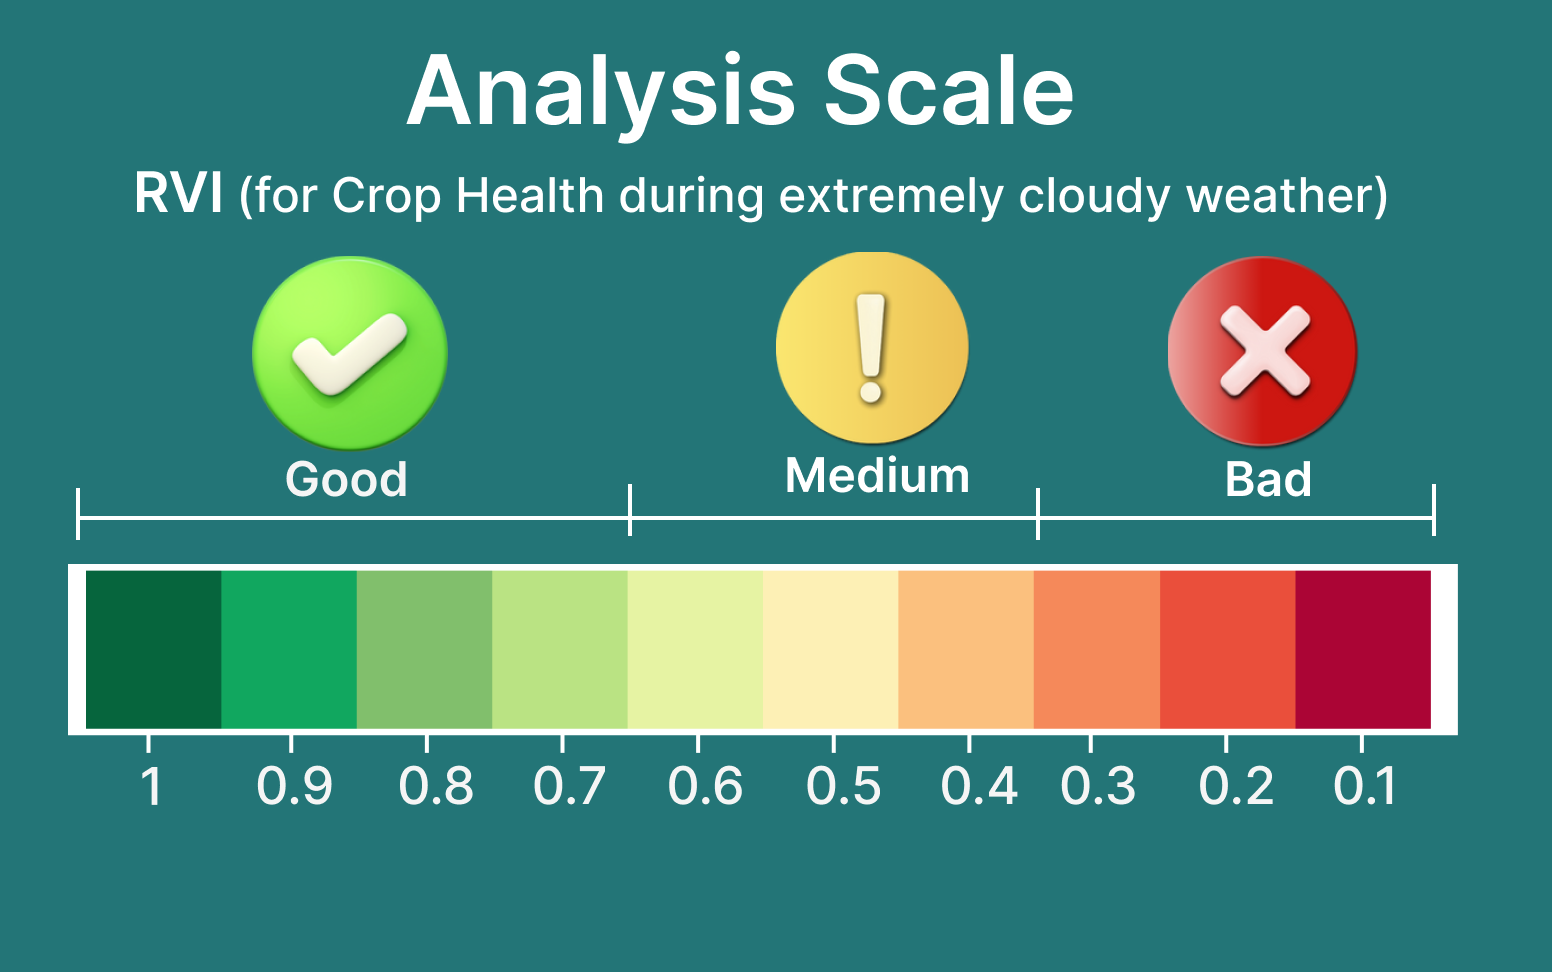
Radar – RVI
Colormaps
A colormap is a visual representation of the visual intensity of the selected index at a location on the field. For example, if at a particular location on the field, the displayed index value is extremely low, then in that case, that particular location point is displayed as red using colormap 1, whereas the same point is displayed as black in colormap 2. Similarly, if at a particular location on the displayed field, the displayed index value is extremely high, then in that case, that particular location is displayed as green in both the colormaps.
Contact us at [email protected] to add your custom logo to the reports.
Usage Details
For every 15 weather API requests (current or forecast weather), 1 unit will be consumed.
For every JEEVN AI (personalized farm advisory) API request, 2 units will be consumed.
For every satellite observation on 1 acre of farmland, 1 unit will be consumed.
For every 200 API Hits, 1 unit will be consumed.
For every 1 Mb of Data fetched through any API, 1 unit will be consumed
JEEVN AI: Personalized Farm Advisory
API Usage Calculator
API Usage Calculator
!
Example:
If you have 100 acres of farmland divided between 10 farms and want to monitor them for 12 months, here's how the API unit consumption breaks down:
1. Satellite Observations:
* Each acre requires 6 units per month (due to 6 satellite observations with a 5-day frequency).
* For 100 acres over 12 months, that totals, 100 Acres * 6 units/month * 12 months = 7200 API units.
2. API Hits:
* An average user typically makes about 100 API calls per month each farm
* For 10 farms, this totals 10*100 = 1000 API calls per month.
* Over 12 months, that's 12000 API calls, consuming 60 API units (200 Calls = 1 Api unit).
3. Data Usage:
* On an average Each farm uses about 2 MB of data per month.
* For 10 farms, that totals 20 MB per month, or 240 MB over 12 months.
* This consumes 240 API units (1 Mb = 1 Api Unit).
4. Personalized Farm Advisory (JEEVN AI):
* Personalized farm advisory is generated after each satellite visit (6 in a month), requiring 12 units per month per farm (1 Report = 2 Units)
* For 10 farms over 12 months, this totals 1440 API units.
Total Units Consumed:
*Satellite Observations: 7200 units
* API Hits: 60 units
* Data Usage: 240 units
* Personalized Farm Advisory: 1440 units Total: 8940 API units / Year / 100 Acre
Total Cost
* 100 API units = 3USD (current pricing as of 16 Aug 2024)
* Per Acre cost for whole year = 8940 units / Year / 100 Acre = 89.40 Units/Acre / Year = 89.40/100 * 3 = 2.69 USD / Acre / Year or 0.23 USD/Acre/month
* Per Hectare cost for the whole year = 6.63 USD/ hectare/ Year or 0.56 USD/Hectare/month
!
0
!
1
!
0
!
0
!
0
!
0
Total Units: 0
Total Cost: $0.00
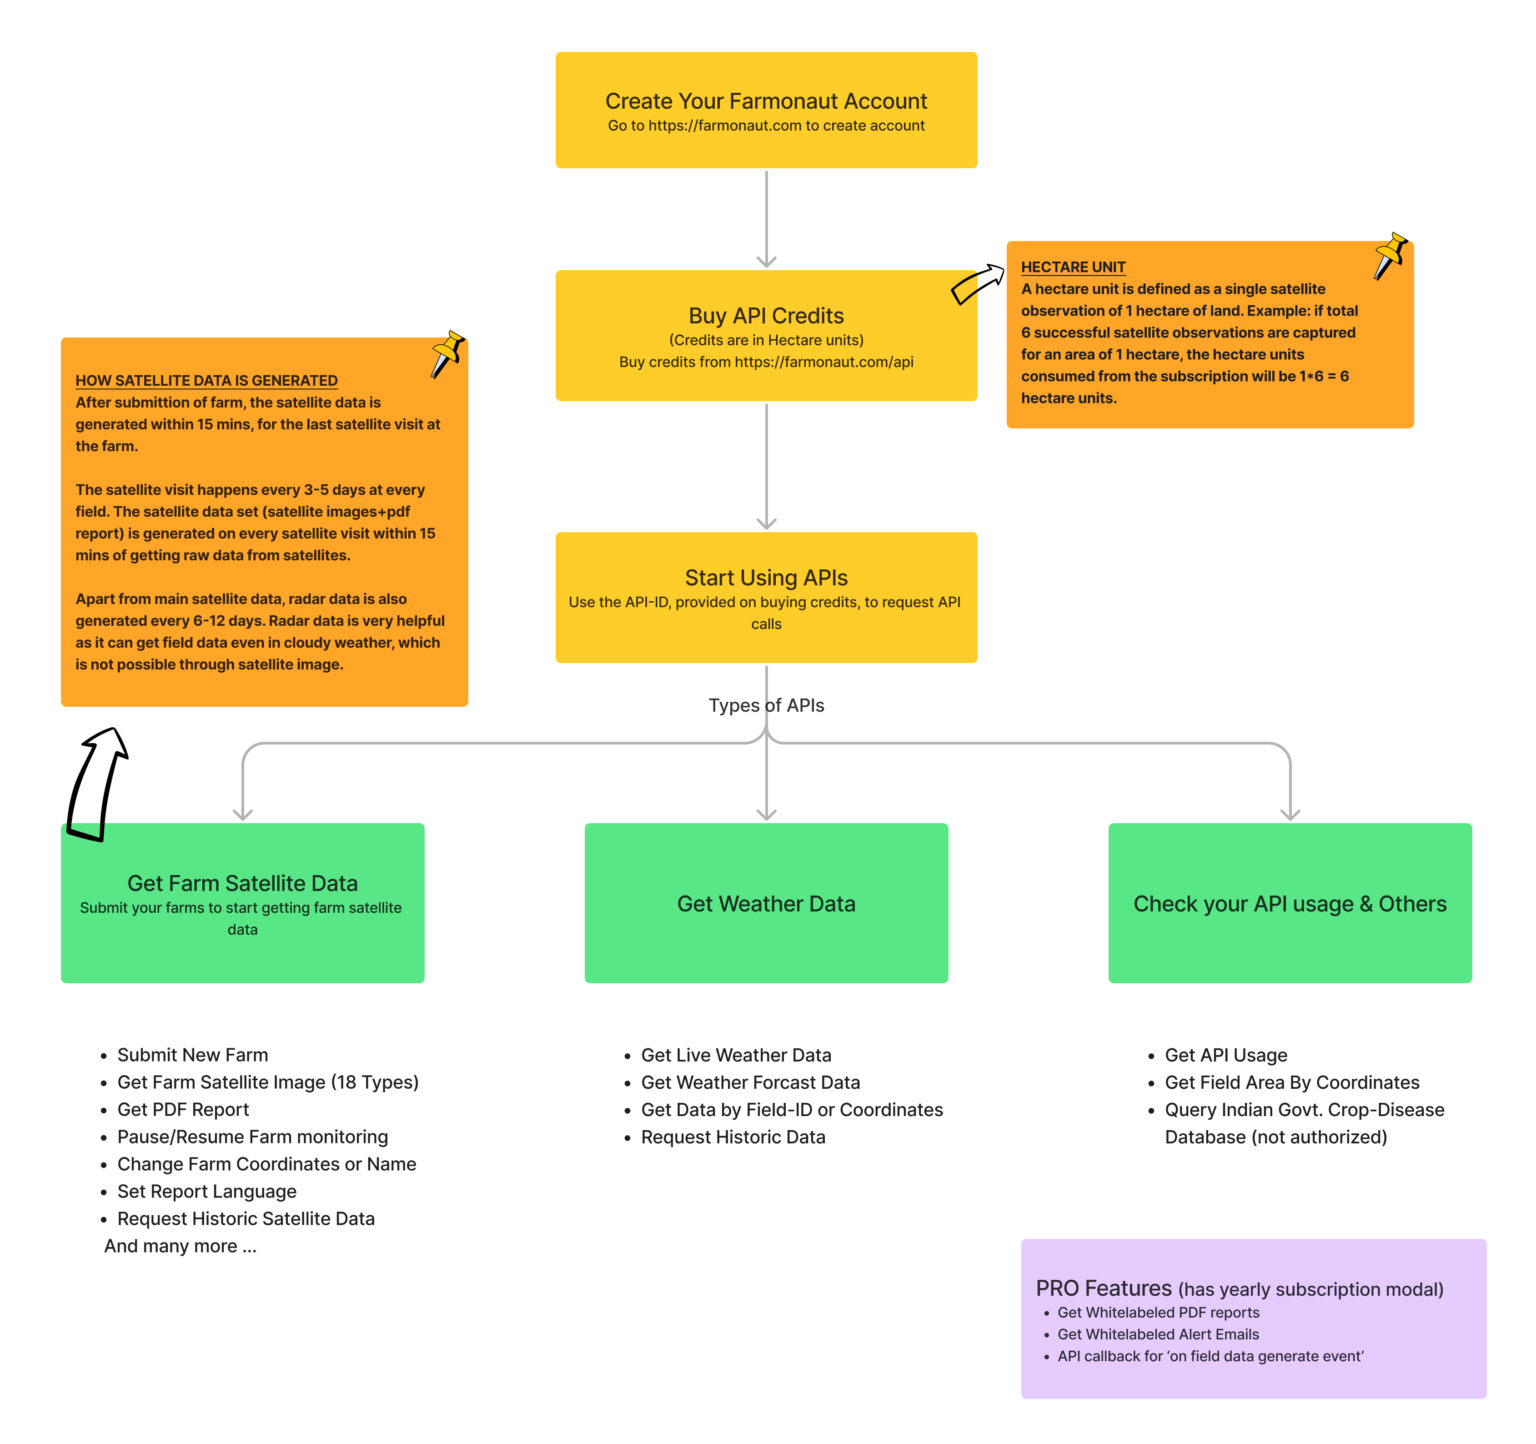
API Documentation
API Structure
All API endpoints follows the same structure of request and response.
API request structure:
The request need to be a POST request.
The body should be JSON encoded object.
Headers may need to include ‘Content-Type’ and ‘Accept’ keys with value ‘application/json’.
The response would be JSON encoded object or a String, as specified in the endpoint doc.
It adds a new farm to your account with provided coordinates and
enables it for getting satellite data (caution: it doesn't stop
you from adding duplicate farms). Once you submit the request
it generally takes less than 15 mins for the first results to be
generated. Once these results are generated they can be accessed
instantaneously at any point of time.
POST
* Known Issue: the postman api doesn't work on web, use postman
desktop or it's IDE extension
Request Body
UID
string
Also referred as API ID at some places. It's basically an
identifier for your account.
* Important Note: iframe is an add-on feature available for
api users.To access our iFrame feature, please contact us at
[email protected] or call us at +91-6366026267 or +1
(669) 6666 882.
It adds a new farm to your account with provided coordinates
and enables it for getting satellite data (caution: it
doesn't stop you from adding duplicate farms). Once you
submit the request it generally takes less than 5 mins for
the first results to be generated. Once these results are
generated they can be accessed instantaneously at any point
of time.
url
Required Parameters
API
string
This key is different from the previous key. To get the
key, please contact us at [email protected] or call
us at +91-6366026267 or +1 (669) 6666 882.
Visualize polygon
* Important Note:iframe is an add-on feature available for
api users. To access our iFrame feature, please contact us
at [email protected] or call us at +91-6366026267 or +1
(669) 6666 882.
Visualizing the polygon based on the FieldID. It displays
the field information, a timeline chart, and an overlay of
the selected field, which can be adjusted using the map
controls.
url
RequiredParameters
API
string
This key is different from the previous key. To get the
key, please contact us at [email protected] or call
us at +91-6366026267 or +1 (669) 6666 882.
FieldID
string
It is an identifier for the field. It's unique for every
field. (You can get this from the getAllFieldIDs
endpoint.)
ImageType
string(optional)
The image type of the image.(Initially, the considered
value is "ndvi" )