Mastering NDVI: Revolutionize Your Crop Health Monitoring with Precision Agriculture Techniques in Brno
“NDVI values range from -1 to 1, with higher values indicating healthier vegetation and denser canopy cover.”
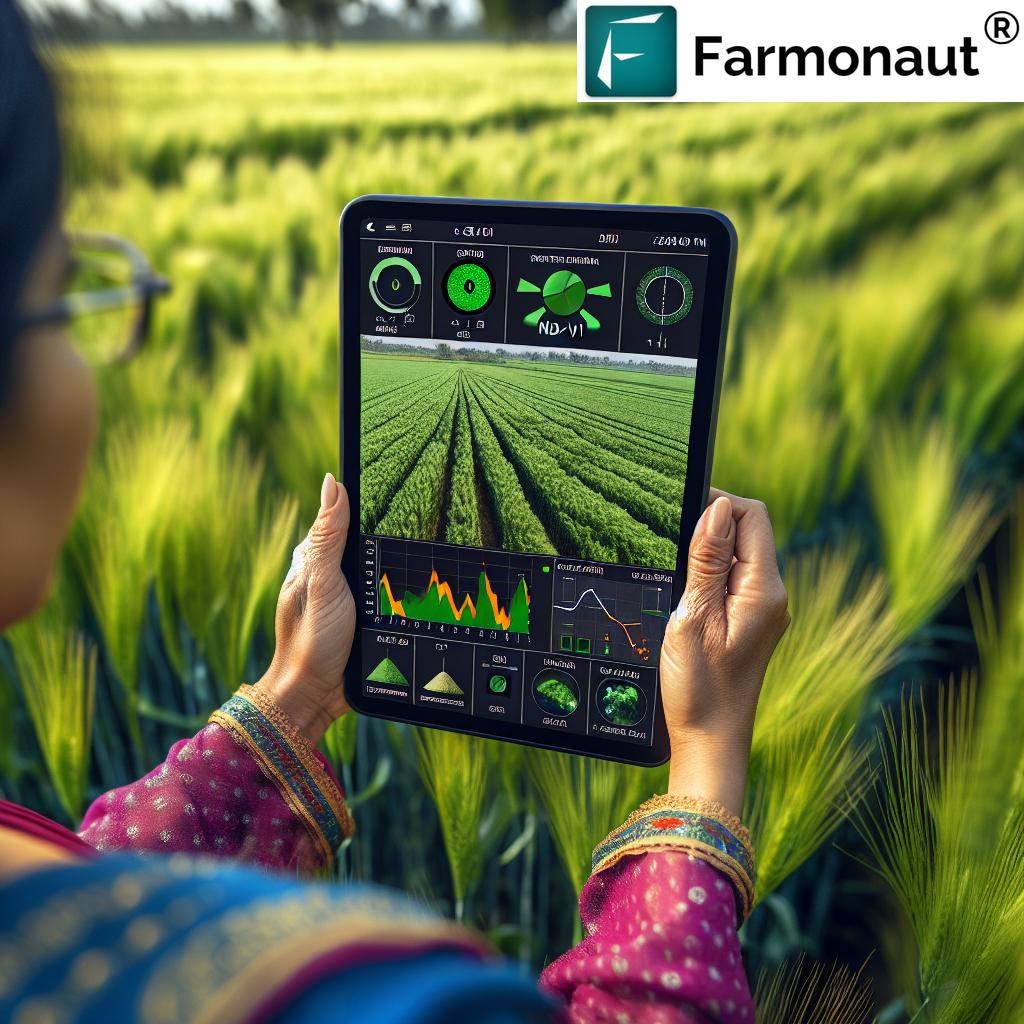
Welcome to the cutting-edge world of precision agriculture! In this comprehensive guide, we’ll explore how Normalized Difference Vegetation Index (NDVI) is revolutionizing crop health monitoring and transforming farming practices in Brno, Czech Republic, and beyond. As we delve into the power of satellite imagery and remote sensing, you’ll discover how these advanced technologies are reshaping the agricultural landscape.
Understanding NDVI: The Cornerstone of Vegetation Indices
NDVI is a crucial tool in the arsenal of modern farmers and agronomists. This powerful vegetation index combines data from visible red and near-infrared (NIR) light to assess various aspects of plant health and growth. Let’s break down the fundamentals of NDVI and its significance in precision agriculture.
What is NDVI?
NDVI stands for Normalized Difference Vegetation Index. It’s a numerical indicator that uses the visible and near-infrared bands of the electromagnetic spectrum to analyze the health and density of vegetation. The formula for NDVI is:
NDVI = (NIR – Red) / (NIR + Red)
Where:
- NIR = reflectance in the near-infrared spectrum
- Red = reflectance in the red channel of the visible spectrum
This simple yet powerful formula provides invaluable insights into crop health, biomass, and overall vegetation vigor.
The Significance of NDVI in Precision Agriculture
NDVI has become an indispensable tool in precision agriculture for several reasons:
- Crop Health Monitoring: NDVI values provide a quick and accurate assessment of plant health, allowing farmers to identify problem areas before they become visible to the naked eye.
- Biomass Estimation: Higher NDVI values generally correlate with greater biomass, helping farmers estimate crop yield potential.
- Stress Detection: Changes in NDVI over time can indicate plant stress due to factors such as drought, pests, or disease.
- Growth Stage Analysis: NDVI patterns can help identify different phenological stages of crop development.
- Precision Fertilization: By mapping NDVI across fields, farmers can apply fertilizers more efficiently, targeting areas that need it most.
NDVI Values and Their Interpretation
Understanding NDVI values is crucial for effective crop management. Let’s explore what different NDVI ranges mean for vegetation health and agricultural practices.
| NDVI Value Range | Vegetation Health | Crop Stage | Management Action |
|---|---|---|---|
| -1 to 0 | No vegetation, water, or barren land | Pre-planting or post-harvest | Prepare for planting or assess field conditions |
| 0 to 0.2 | Poor vegetation, bare soil | Early growth or stressed crops | Investigate potential issues, consider replanting |
| 0.2 to 0.4 | Moderate vegetation | Mid-growth stage | Monitor closely, consider additional irrigation or fertilization |
| 0.4 to 0.6 | Good vegetation | Peak vegetative stage | Maintain current management practices |
| 0.6 to 0.8 | Very good vegetation | Late vegetative/early reproductive stage | Prepare for potential yield optimization strategies |
| 0.8 to 1 | Excellent vegetation | Peak crop health | Monitor for optimal harvest timing |
This table serves as a general guide, but it’s important to note that NDVI values can vary depending on the crop type, growth stage, and local environmental conditions. In Brno, for example, the interpretation of NDVI values might be slightly different due to the specific climate and soil conditions of the Czech Republic.
Seasonal Changes and NDVI
NDVI values naturally fluctuate throughout the growing season. In Brno, where farmers cultivate crops like barley, potatoes, and other regional specialties, understanding these seasonal patterns is crucial for effective crop management.
- Spring: As crops emerge and begin to grow, NDVI values start to increase from near-zero.
- Summer: Peak vegetation typically occurs in mid-summer, with NDVI values reaching their highest points.
- Fall: As crops mature and begin to senesce, NDVI values gradually decrease.
- Winter: Bare fields or winter crops will show low NDVI values, often close to zero.
By tracking these seasonal changes, farmers in Brno can make informed decisions about planting, fertilization, and harvesting schedules.
Satellite Imagery and Remote Sensing in Agriculture
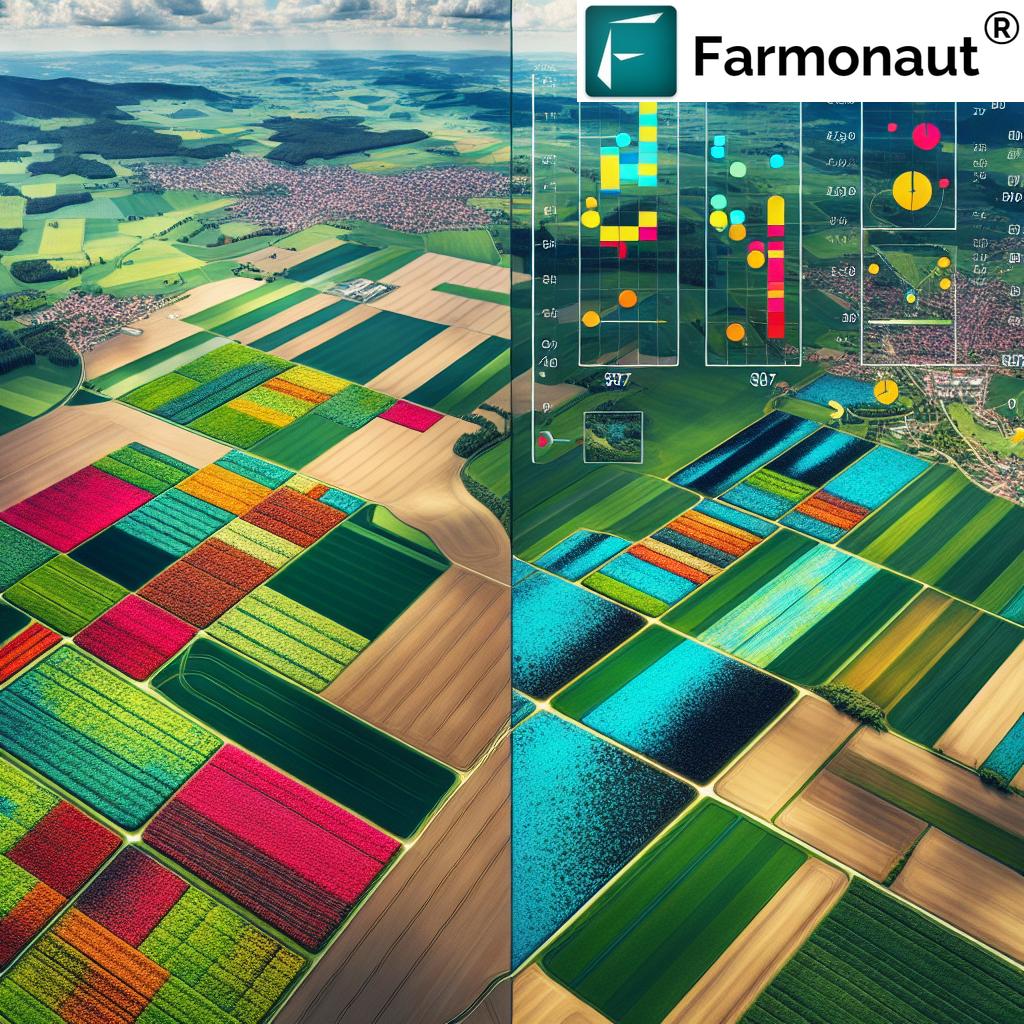
“Satellite-based NDVI analysis combines data from visible red and near-infrared light to assess crop health across vast areas.”
The advent of satellite technology has revolutionized the way we monitor and manage agricultural lands. Remote sensing techniques, particularly those utilizing satellite imagery, have become invaluable tools for farmers and agronomists worldwide, including those in Brno.
How Satellite Imagery Works for Crop Monitoring
Satellites equipped with multispectral sensors orbit the Earth, capturing images in various wavelengths of light. For agricultural applications, the most important bands are:
- Red: Absorbed by chlorophyll in healthy plants
- Near-Infrared (NIR): Strongly reflected by healthy vegetation
- Green: Partially reflected by plants, giving them their green appearance
By analyzing the reflectance patterns in these bands, we can derive valuable information about crop health, soil moisture, and overall field conditions.
Benefits of Satellite-Based Crop Monitoring
The use of satellite imagery in agriculture offers numerous advantages:
- Wide Coverage: Satellites can monitor vast areas of farmland quickly and efficiently.
- Frequent Updates: Regular satellite passes provide up-to-date information on crop conditions.
- Non-Invasive: Monitoring can be done without disturbing the crops or entering the fields.
- Historical Data: Long-term satellite records allow for year-over-year comparisons and trend analysis.
- Cost-Effective: Compared to traditional field surveys, satellite monitoring is often more economical, especially for large areas.
For farmers in Brno and the surrounding regions, these benefits translate into more informed decision-making and improved crop management strategies.
Precision Agriculture Techniques Using NDVI
Now that we understand the basics of NDVI and satellite imagery, let’s explore how these technologies are applied in precision agriculture, particularly in the context of farming in Brno.
Variable Rate Application
One of the most powerful applications of NDVI in precision agriculture is variable rate application (VRA) of inputs such as fertilizers and water. By creating NDVI maps of their fields, farmers can identify areas that require more or less input, allowing for targeted application.
- Fertilization: Areas with lower NDVI values may indicate nutrient deficiencies, prompting increased fertilizer application.
- Irrigation: NDVI can help identify water-stressed areas, enabling precise irrigation management.
- Pesticide Application: By detecting early signs of pest infestation or disease, NDVI maps can guide targeted pesticide use.
This approach not only optimizes resource use but also minimizes environmental impact and reduces costs.
Crop Yield Estimation
NDVI data collected throughout the growing season can be used to estimate crop yields. By analyzing NDVI trends and comparing them with historical data, farmers in Brno can make more accurate yield predictions, which is crucial for planning harvests and managing storage facilities.
Soil Moisture Monitoring
While NDVI primarily reflects vegetation health, it can also provide insights into soil moisture levels. Areas with consistently low NDVI values may indicate poor soil moisture retention, prompting farmers to investigate and potentially implement soil improvement measures.
Crop Stress Detection
Early detection of crop stress is critical for maintaining high yields. NDVI analysis can reveal stress factors such as:
- Drought stress
- Nutrient deficiencies
- Pest infestations
- Disease outbreaks
By identifying these issues early, farmers in Brno can take prompt action to mitigate potential crop losses.
Implementing NDVI in Your Farming Practice
Integrating NDVI analysis into your farming operations can seem daunting, but with the right tools and knowledge, it’s a straightforward process that can yield significant benefits.
Choosing the Right Platform
Several platforms offer NDVI monitoring services, but it’s crucial to choose one that suits your specific needs. Farmonaut, for example, provides a comprehensive suite of tools for satellite-based crop monitoring, including NDVI analysis.
Access Farmonaut’s advanced crop monitoring tools:

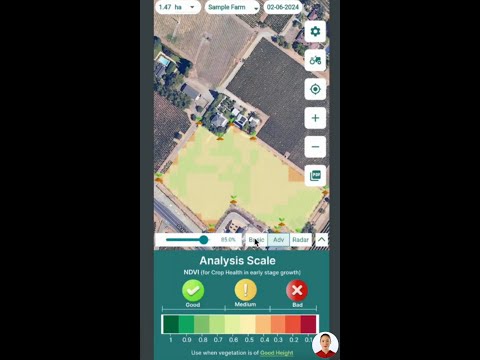
Interpreting NDVI Maps
NDVI maps typically use a color scale to represent different NDVI values. Common color schemes include:
- Red: Low NDVI (stressed or sparse vegetation)
- Yellow: Moderate NDVI
- Green: High NDVI (healthy, dense vegetation)
Learning to interpret these maps is crucial for making informed decisions about your crops.
Integrating NDVI Data with Other Farm Management Practices
For maximum benefit, NDVI data should be used in conjunction with other farm management practices:
- Soil Testing: Combine NDVI maps with soil test results for more accurate fertilization strategies.
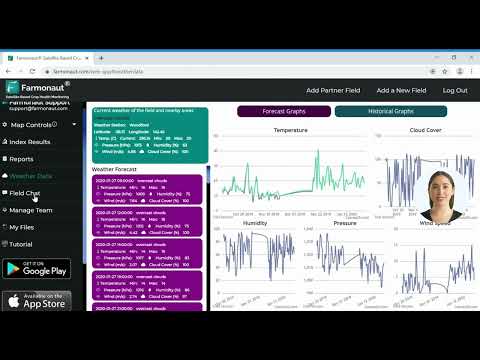
- Weather Data: Correlate NDVI trends with local weather patterns to understand environmental impacts on crop health.
- Crop Rotation Planning: Use historical NDVI data to inform crop rotation decisions.
NDVI and Sustainable Agriculture in Brno
The application of NDVI and other precision agriculture techniques aligns well with sustainable farming practices, which are increasingly important in Brno and throughout the Czech Republic.
Reducing Environmental Impact
By optimizing input use through NDVI-guided precision agriculture, farmers can significantly reduce their environmental footprint:
- Reduced Water Usage: Targeted irrigation based on NDVI data conserves water resources.
- Minimized Chemical Runoff: Precise application of fertilizers and pesticides reduces the risk of chemical runoff into local water systems.
- Lower Carbon Emissions: Optimized field operations lead to reduced fuel consumption and lower carbon emissions.
Enhancing Biodiversity
NDVI analysis can also support efforts to enhance biodiversity on farms:
- Identifying Marginal Areas: Low-productivity areas identified through NDVI mapping can be converted to wildlife habitats or pollinator-friendly zones.
- Monitoring Field Margins: NDVI can help assess the health of field margins and hedgerows, which are crucial for local biodiversity.
The Future of NDVI and Precision Agriculture
As technology continues to advance, we can expect even more sophisticated applications of NDVI and related technologies in agriculture:
- AI-Powered Analysis: Machine learning algorithms will enhance the interpretation of NDVI data, providing even more accurate insights and predictions.
- Integration with IoT Devices: NDVI data will be seamlessly integrated with soil sensors, weather stations, and other IoT devices for comprehensive farm monitoring.
- Hyperspectral Imaging: More advanced satellite sensors will provide even more detailed information about crop health and soil conditions.
For farmers in Brno and beyond, staying abreast of these developments will be crucial for maintaining competitive and sustainable agricultural practices.
Leveraging Farmonaut for Advanced NDVI Analysis
Farmonaut offers cutting-edge solutions for farmers looking to implement NDVI analysis and other precision agriculture techniques. Our platform provides:
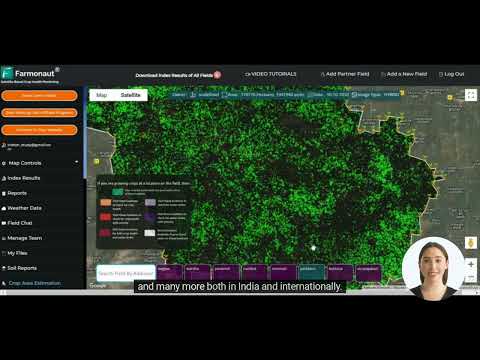
- Real-time NDVI Monitoring: Access up-to-date NDVI maps of your fields through our user-friendly web and mobile apps.
- Historical Data Analysis: Compare current NDVI values with historical data to identify trends and anomalies.
- Custom Alerts: Set up notifications for significant changes in NDVI values, allowing for quick responses to potential issues.
- Integration with Other Data Sources: Combine NDVI data with weather forecasts, soil moisture readings, and more for comprehensive farm management.
Explore Farmonaut’s mobile apps:


API Access for Developers
For those looking to integrate Farmonaut’s powerful NDVI data into their own systems or applications, we offer comprehensive API access. This allows for seamless integration of our satellite and weather data into custom farming solutions.
Learn more about our API:
Farmonaut API
API Developer Docs
Conclusion: Embracing the NDVI Revolution in Brno
As we’ve explored throughout this guide, NDVI and related precision agriculture techniques are transforming farming practices in Brno and around the world. By harnessing the power of satellite imagery and advanced data analysis, farmers can optimize their operations, reduce environmental impact, and increase yields.
The journey to mastering NDVI and implementing precision agriculture techniques may seem challenging, but the potential benefits are enormous. With platforms like Farmonaut providing accessible and powerful tools, farmers of all scales can join this agricultural revolution.
We encourage you to explore the possibilities of NDVI analysis for your farm. Whether you’re managing vast fields of barley or smaller plots of diverse crops, the insights provided by NDVI can help you make more informed decisions and drive your farming practice into the future.
FAQs
- What is the ideal NDVI value for healthy crops?
Ideal NDVI values vary by crop type and growth stage, but generally, values between 0.6 and 0.9 indicate healthy, dense vegetation. - How often should I monitor NDVI for my fields?
For most crops, weekly or bi-weekly monitoring is sufficient, but during critical growth stages or in response to extreme weather events, more frequent monitoring may be beneficial. - Can NDVI detect pest infestations?
While NDVI cannot directly detect pests, it can reveal areas of stress in crops which may be caused by pest infestations, prompting further investigation. - Is NDVI analysis effective for all crop types?
NDVI is effective for most crops, but its interpretation may vary. Some specialized indices may be more suitable for specific crop types or growth stages. - How does cloud cover affect NDVI measurements?
Cloud cover can interfere with satellite imagery. Most NDVI services, including Farmonaut, use algorithms to filter out cloud-affected data and provide clear, usable imagery.
Farmonaut Subscription Plans
Ready to revolutionize your farming practices with NDVI and precision agriculture techniques? Explore our subscription plans tailored to meet the needs of various farm sizes and types:
By leveraging the power of NDVI and Farmonaut’s advanced agricultural technologies, farmers in Brno and beyond can take their crop management to new heights. Join the precision agriculture revolution today and watch your farm thrive!