Yield calculation of the crop is very important for assessing the production and it depends on many variables like soil, weather, agricultural practices (date of planting, amount of irrigation and fertilizer use), seeds and biotic stress.
Remote sensing provides an effective and efficient way to forecast yield. Remote sensing has been widely used by many institutions across world to calculate area and yield of a crop.
In this paper, we focus on forecasting yield of wheat based on data from Sentinel-2 satellite data. The study area was wheat crop in Saharsa (Bihar). The crop is in advanced stage and has vegetated fully and harvest is expected in next 20 days.
Methodology:
Data from Sentinel-2 was used and random fields were selected from the mapped area and yield was calculated using NDVI (Normalized Difference Vegetation Index) and LAI (Leaf Area Index).
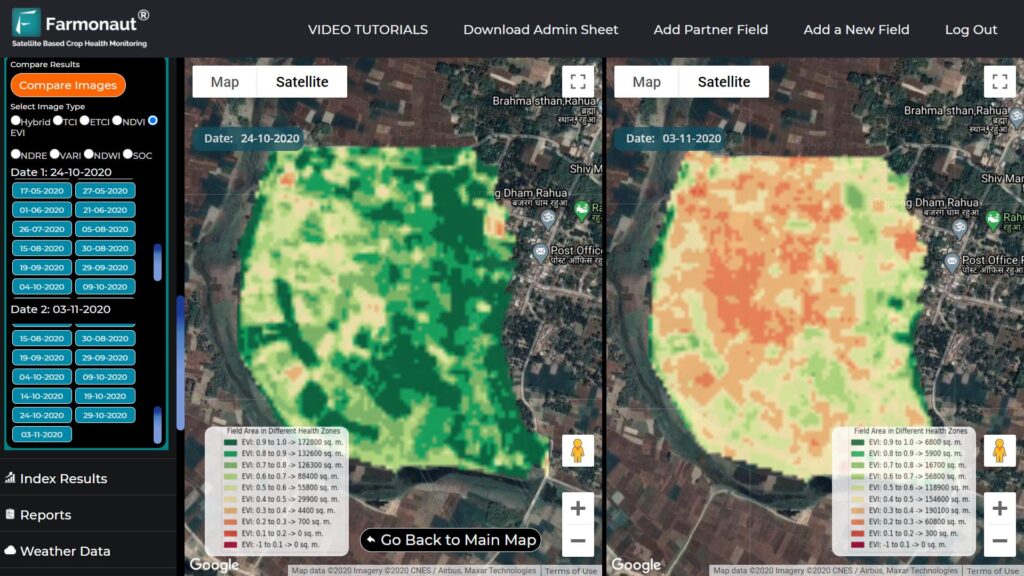
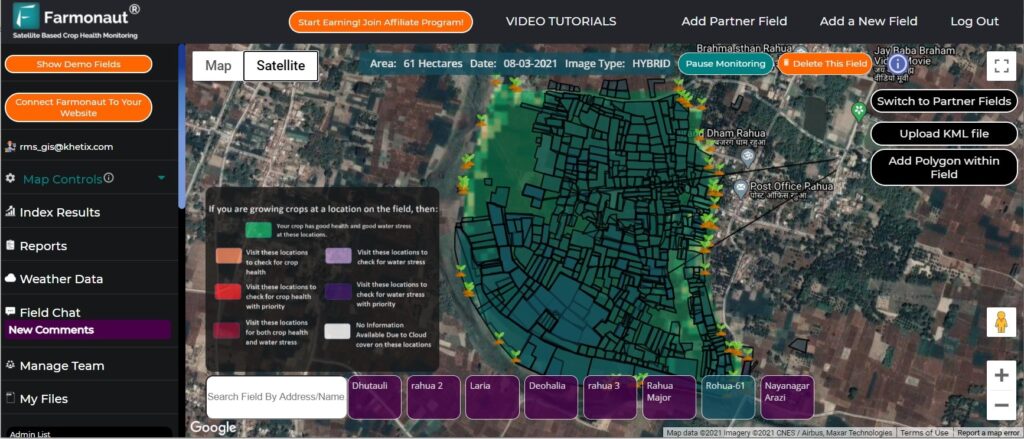
Farmonaut platform was used to map fields to create bounded regions (fields) as shown in Figure-2. On the dates of observations the sample fields were free from clouds and normal data was observed. Crop classification was done manually by ground truthing to ascertain the crop is standing in the field.
Maximum NDVI was used to calculate yields for the given fields which means peak vegetative growth rate. Peak vegetative growth helps to forecast yields more accurately.
Below are the observations of NDVI of the various fields. The maximum NDVI was reached on 21 Feb 2021 which was used to calculate yield. From the maximum NDVI, LAI was calculated which was subsequently used to calculate yield. This approach is being used after going through a lot of available texts and final model was considered.
In this procedure the estimated LAI was used with WTGROWS model for yield mapping. This model suggests direct correlation between grain yields and LAI. This relationship was applied to all the fields to calculate yields.
NDVI started to rise after planting of crop in November continued to rise until 21-Feb-2021 making the data as best date for calculating yield. The NDVI started falling after 21-Feb-2021 and will fall until harvest. Best results of yield is obtained when the NDVI is maximum.
NDVI and LAI showed the best correlation for the estimated yields. The yields ranged from 3.5 Tons/ha to 3.7 Tons/ha. Figure-1
Area (sq. m.)
16-Feb-21
21-Feb-21
26-Feb-21
03-Mar-21
Maximum LAI
Estimated Yield Kg/ha
Field 1
3600
0.6
0.7
0.7
0.7
2.912119253
3713
Field 2
7700
0.6
0.7
0.69
0.67
2.912119253
3713
Field 3
1500
0.59
0.7
0.7
0.69
2.912119253
3713
Field 4
3100
0.6
0.7
0.7
0.69
2.912119253
3713
Field 5
6600
0.59
0.7
0.68
0.67
2.912119253
3713
Field 6
2700
0.57
0.7
0.68
0.67
2.912119253
3713
Field 7
2000
0.52
0.64
0.64
0.64
2.532181241
3493
Field 8
4300
0.59
0.7
0.7
0.7
2.912119253
3713
Field 9
1700
0.52
0.65
0.66
0.64
2.591873781
3530
Field 10
3700
0.6
0.7
0.7
0.69
2.912119253
3713
Results:
Data from government institution show the wheat yield in Madhepura district of Bihar ta 3.8 Tons/ha which is just next to Saharsa district.
The above mentioned yields can vary depending upon weather before harvest. If normal condition prevail then the above yields can be achieved subject to error of 10%.
The researches done in the area of yield forecasting of field crops by remote sensing has demonstrated good results. With the help of new sensors and indexes, researchers can calculate yields with less errors in future.
We will keep posting about any such informative information on to our blogs, to help as many people as possible. Farmonaut is built upon a vision to bridge the technological gap between farmers and strives to bring state-of-the-art technologies in the hands of each and every farmer. For any queries/suggestions, please contact us at [email protected].
We have some more interesting articles coming up soon. Stay tuned!