PrecisionAg101 Post #1 : Starting today, we will be releasing posts regularly to make farmers aware of the basics of precision agriculture and how to interpret various satellite data provided by us.
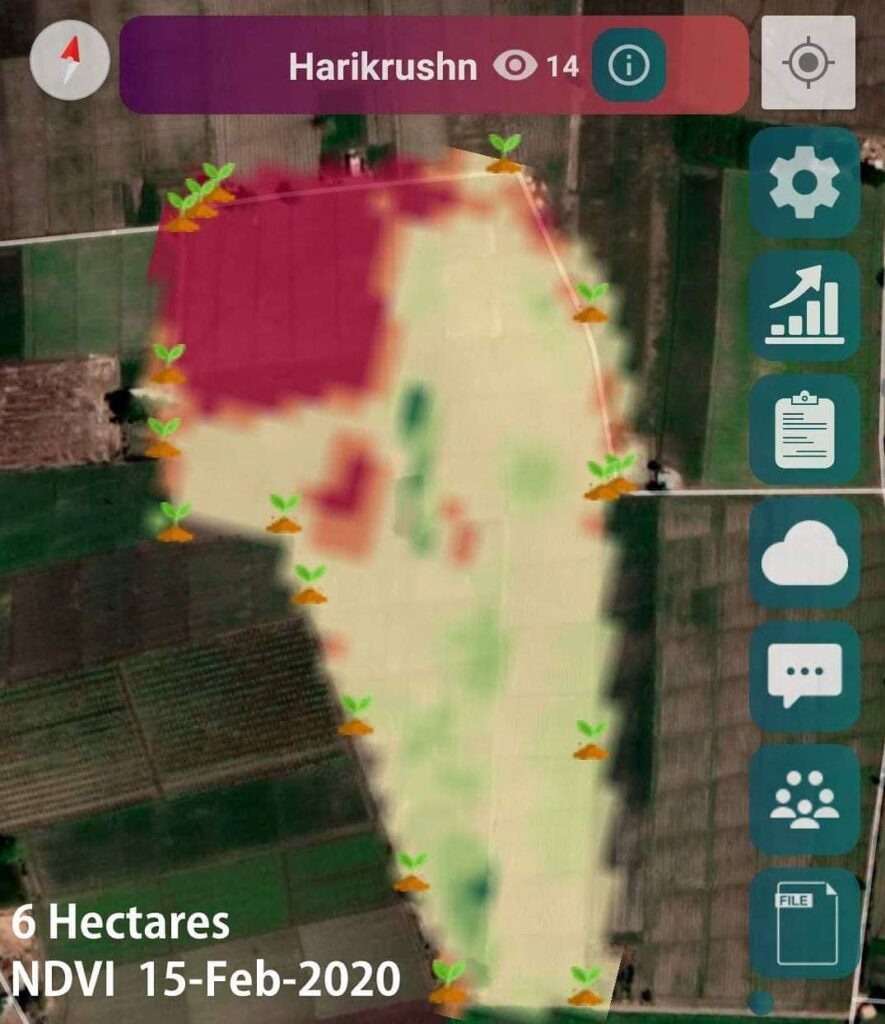
The field image attached below is of the farmer Harikrushn from Surendranagar, Gujarat (Field Area: 6 Hectares). The image displayed on the map is NDVI (Normalized Difference Vegetation Index) captured by the satellite on 15 Feb 2020. NDVI images are used to quantify crop health status in a field. The colors used to quantify this information is very easy to interpret.
Dark Green/ Green: Crop is very healthy
Yellow: Crop needs attention
Red: Barren land
In the posted image, as we can see, the top left portion of the field is completely barren, whereas the remaining field is in the yellowish green or green region. This indicates that the crop health of the farmer’s field is pretty well. To cross-verify these results farmers can simply open GPS on their smartphones and can navigate through the field using this image.
By using satellite data provided by us, farmers can:
1. Reduce Chemical/Fertilizer consumption by applying them only in the locations where crop
health is not good.
2. Reduce Labour costs by directing the labours only in those field areas where crop health is
critical.
3. Reduce irrigation water wastage by applying proper irrigation only in those locations where
plant water stress is low.
4. Increase overall yield.
The system is available for use on android, iOS as well as web.
Happy Farming!
#farming #organicfarming #crops #urbanfarming #ndvi #fieldscouting #remotesensing #consultant #agriconsultant #greentech #smartfarming #precisionagriculture #farm #agritech #agriculture #foodsecurity #technology #satellite #vegetation #india #gis #waterstress #advisor #cropyield