Decoding NDVI Values: A Comprehensive Guide to Interpreting Vegetation Health
In the ever-evolving landscape of precision agriculture, understanding and interpreting vegetation health is crucial for optimizing crop yields and managing resources effectively. At Farmonaut, we’re committed to providing farmers, agronomists, and researchers with cutting-edge tools to monitor and analyze crop health. One of the most powerful indicators we use is the Normalized Difference Vegetation Index (NDVI). In this comprehensive guide, we’ll delve deep into the world of NDVI, exploring what NDVI values mean, how to interpret them, and why they’re so important for modern agriculture.
Table of Contents
- What is NDVI?
- Understanding NDVI Index Values
- Interpreting NDVI Values
- The Importance of NDVI in Agriculture
- How Farmonaut Utilizes NDVI
- NDVI vs. Other Vegetation Indices
- Limitations and Considerations
- Future Trends in Vegetation Monitoring
- FAQs
1. What is NDVI?
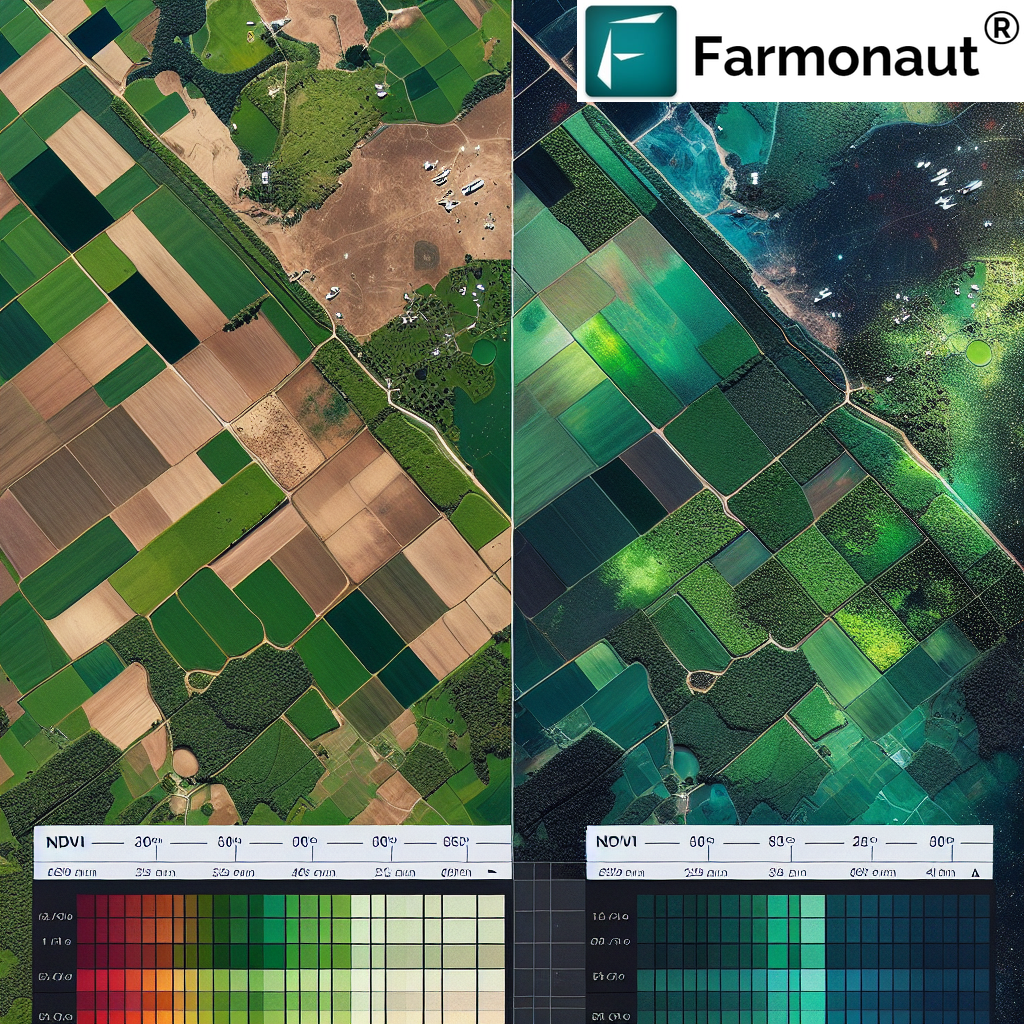
The Normalized Difference Vegetation Index (NDVI) is a standardized index that allows us to generate an image displaying vegetation greenness, also known as relative biomass. This index capitalizes on the contrast between the red and near-infrared reflection of solar radiation by vegetation.
NDVI is calculated using the following formula:
NDVI = (NIR – RED) / (NIR + RED)
Where:
- NIR = Near-infrared reflection
- RED = Red light reflection
Healthy vegetation absorbs most of the visible light that hits it and reflects a large portion of near-infrared light. Unhealthy or sparse vegetation reflects more visible light and less near-infrared light.
2. Understanding NDVI Index Values
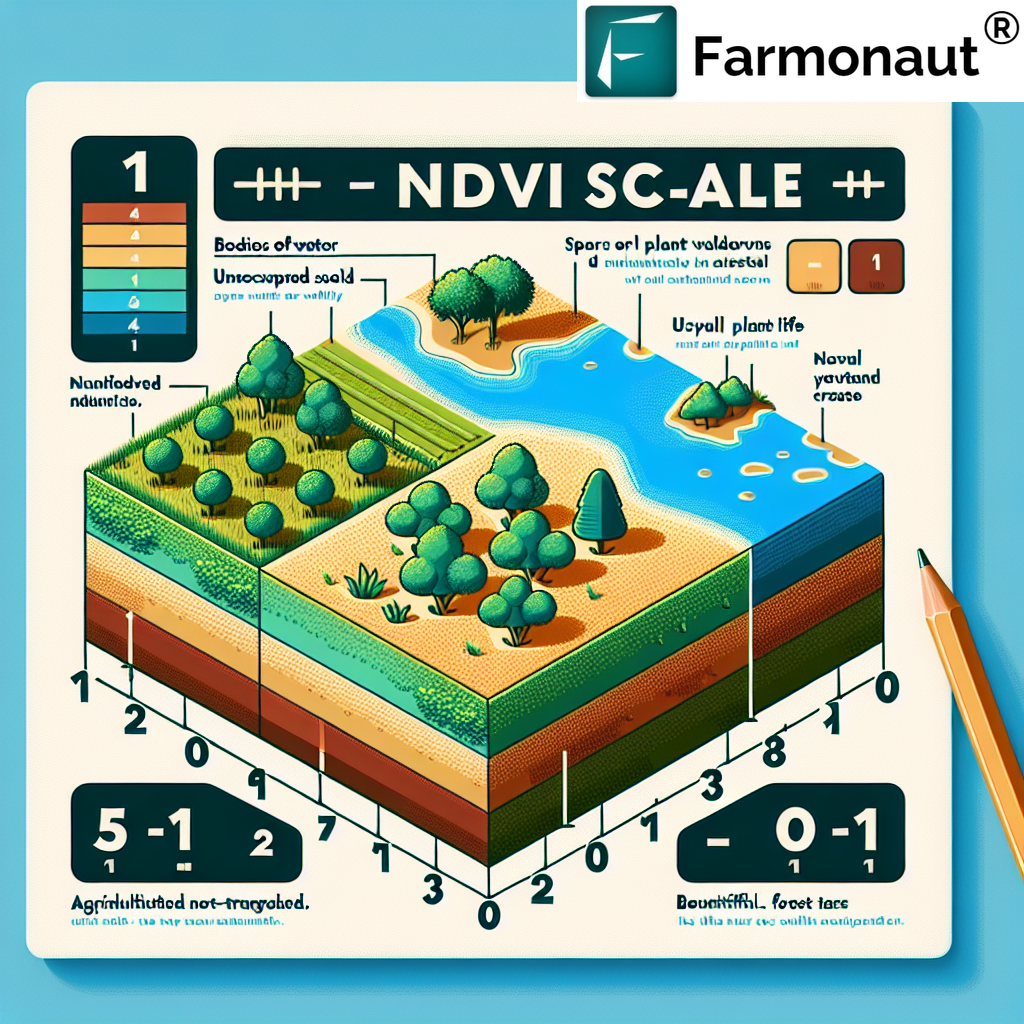
NDVI values range from -1 to +1. But what do these NDVI values mean? Let’s break it down:
- -1 to 0: These values typically represent non-vegetated areas such as water bodies, snow, ice, or bare soil.
- 0 to 0.1: Barren areas of rock, sand, or snow.
- 0.2 to 0.5: Sparse vegetation such as shrubs and grasslands or senescing crops.
- 0.6 to 0.9: Dense vegetation such as temperate and tropical rainforests or crops at their peak growth stage.
It’s important to note that NDVI values can vary depending on factors such as plant species, soil type, and atmospheric conditions. This is why interpretation of NDVI values requires context and expertise.
3. Interpreting NDVI Values
NDVI values interpretation is a crucial skill for anyone involved in precision agriculture. Here’s a more detailed look at how to interpret these values:
Very Low NDVI (-1 to 0.1)
These values often indicate non-vegetated areas or areas with very little vegetation. This could be:
- Water bodies (rivers, lakes, oceans)
- Bare soil
- Snow or ice-covered areas
- Urban areas or roads
Low NDVI (0.1 to 0.3)
These values typically represent areas with sparse vegetation or vegetation in early growth stages:
- Grasslands or prairies during dry seasons
- Newly planted or emerging crops
- Areas with very low plant density
Moderate NDVI (0.3 to 0.6)
This range often indicates:
- Shrublands
- Grasslands during growing seasons
- Crops in mid-growth stages
- Sparse forests
High NDVI (0.6 to 0.8)
These values are associated with:
- Dense vegetation
- Healthy, mature crops
- Temperate and tropical forests
Very High NDVI (0.8 to 1)
The highest NDVI values typically represent:
- Peak vegetation conditions
- Rainforests
- Crops at maximum health and density
At Farmonaut, we’ve developed advanced algorithms that not only calculate NDVI values but also interpret them in the context of specific crop types, growth stages, and local environmental conditions. This allows us to provide farmers with actionable insights rather than just raw data.
4. The Importance of NDVI in Agriculture
NDVI has become an indispensable tool in modern agriculture for several reasons:
Crop Health Monitoring
NDVI allows farmers to monitor crop health throughout the growing season. By tracking changes in NDVI values, we can detect stress in crops before it becomes visible to the naked eye, enabling early intervention.
Yield Prediction
There’s a strong correlation between NDVI values and potential crop yield. By analyzing NDVI data over time, we can make fairly accurate predictions about expected yields, helping farmers and agribusinesses in planning and decision-making.
Resource Optimization
NDVI maps help in identifying areas within a field that may need more or less water, fertilizer, or pest control measures. This enables precision application of resources, reducing waste and environmental impact while optimizing yield.
Drought Monitoring
NDVI is particularly useful in detecting and monitoring drought conditions. A decrease in NDVI values over time can indicate water stress in vegetation, allowing for timely irrigation or other drought mitigation measures.
Crop Insurance and Damage Assessment
NDVI data is increasingly being used in crop insurance to verify claims and assess damage from events like floods, droughts, or pests. This makes the claims process more objective and efficient.
5. How Farmonaut Utilizes NDVI
At Farmonaut, we’ve integrated NDVI analysis into our core suite of precision agriculture tools. Here’s how we leverage NDVI to benefit our users:
Satellite-Based Crop Health Monitoring
Our platform uses high-resolution satellite imagery to calculate NDVI values for entire fields. We process this data to create easy-to-understand crop health maps that farmers can access through our web and mobile applications. These maps are updated regularly, providing a near real-time view of crop health across vast areas.
AI-Powered Insights
Our Jeevn AI advisory system doesn’t just display NDVI values; it interprets them in the context of specific crops, growth stages, and local conditions. By combining NDVI data with other factors like weather patterns and soil characteristics, we provide personalized recommendations for irrigation, fertilization, and pest management.
Historical Analysis and Trend Detection
We store historical NDVI data, allowing farmers to compare current crop health with previous seasons or years. This historical perspective is invaluable for detecting long-term trends, assessing the effectiveness of different management practices, and making informed decisions about crop rotation or land use changes.
Integration with Other Data Sources
NDVI is just one piece of the puzzle. We integrate NDVI data with other sources like weather forecasts, soil moisture sensors, and even IoT devices to provide a comprehensive view of farm conditions. This holistic approach enables more accurate predictions and better-informed decision-making.
Custom Alerts and Notifications
Our system allows users to set custom thresholds for NDVI values. When these thresholds are crossed, the system automatically generates alerts, ensuring that farmers are promptly notified of potential issues in their fields.
To experience how Farmonaut can revolutionize your farming practices with advanced NDVI analysis and more, try our platform today.
6. NDVI vs. Other Vegetation Indices
While NDVI is one of the most widely used vegetation indices, it’s not the only one. Let’s compare NDVI with some other common indices:
Enhanced Vegetation Index (EVI)
EVI is designed to enhance the vegetation signal with improved sensitivity in high biomass regions. It also reduces atmospheric influences.
- Pros: Less sensitive to atmospheric conditions and soil background
- Cons: More complex to calculate
Soil Adjusted Vegetation Index (SAVI)
SAVI is similar to NDVI but includes a soil brightness correction factor.
- Pros: Better performance in areas with high soil exposure
- Cons: Requires knowledge of local soil conditions for optimal results
Normalized Difference Water Index (NDWI)
NDWI is sensitive to changes in liquid water content of vegetation canopies.
- Pros: Good for monitoring plant water stress
- Cons: Less effective for overall vegetation health assessment
At Farmonaut, we primarily use NDVI due to its robustness and wide applicability. However, our advanced algorithms also incorporate other indices when appropriate to provide the most accurate and useful insights to our users.
7. Limitations and Considerations
While NDVI is a powerful tool, it’s important to understand its limitations:
Saturation in Dense Vegetation
NDVI can saturate in areas with very high biomass, making it less effective in distinguishing between different levels of very healthy vegetation.
Sensitivity to Atmospheric Conditions
Clouds, haze, and atmospheric aerosols can affect NDVI readings. At Farmonaut, we use sophisticated cloud detection and atmospheric correction algorithms to mitigate these effects.
Influence of Soil Background
In areas with sparse vegetation, soil reflectance can significantly influence NDVI values. This is why context and expert interpretation are crucial.
Temporal Resolution
The frequency of satellite passes limits how often NDVI can be calculated. However, with our access to multiple satellite constellations, we’re able to provide updates every few days for most locations.
8. Future Trends in Vegetation Monitoring
The field of remote sensing and vegetation monitoring is rapidly evolving. Here are some trends we’re excited about at Farmonaut:
Hyperspectral Imaging
Future satellites may provide hyperspectral data, allowing for more detailed analysis of plant health and even identification of specific stressors or diseases.
Integration with IoT and Ground Sensors
Combining satellite-based NDVI with data from ground-based sensors will provide an even more comprehensive view of crop health and field conditions.
Advanced Machine Learning Models
As we accumulate more data, machine learning models will become increasingly sophisticated in interpreting NDVI and other remotely sensed data, providing even more accurate and specific recommendations.
Real-Time Monitoring
Advances in satellite technology and data processing may soon allow for near-real-time NDVI monitoring, enabling faster response to changing field conditions.
9. FAQs
Q: What do NDVI values mean in practical terms for farmers?
A: NDVI values provide a quantitative measure of vegetation health and density. For farmers, higher NDVI values generally indicate healthier, more productive crops. Lower values might signal stress, disease, or other issues that require attention.
Q: How often should I check NDVI values for my fields?
A: We recommend checking NDVI values at least weekly during the growing season. However, the optimal frequency can vary depending on crop type and growth stage. Our Farmonaut platform provides regular updates and alerts to ensure you never miss important changes in your fields.
Q: Can NDVI detect specific crop diseases or pest infestations?
A: While NDVI alone can’t identify specific diseases or pests, it can detect areas of stress in crops that might be caused by these issues. Our AI-powered system combines NDVI data with other factors to provide more specific insights and potential causes of stress.
Q: How accurate are NDVI-based yield predictions?
A: The accuracy of yield predictions based on NDVI can vary depending on factors like crop type, growth stage, and local conditions. When combined with other data sources and historical trends, as we do at Farmonaut, NDVI can contribute to highly accurate yield forecasts.
Q: Can NDVI be used for all types of crops?
A: NDVI is useful for most types of crops, but its effectiveness can vary. It’s particularly good for leafy crops and grains, but may be less effective for some fruit trees or crops with unique growth patterns. At Farmonaut, we tailor our analysis to specific crop types for optimal results.
Conclusion
Understanding and interpreting NDVI values is a powerful skill in modern agriculture. As we’ve explored in this comprehensive guide, NDVI provides valuable insights into crop health, helps optimize resource usage, and contributes to more sustainable and productive farming practices.
At Farmonaut, we’re committed to making these advanced tools accessible and actionable for farmers of all sizes. Our platform combines cutting-edge satellite technology, AI-powered analysis, and user-friendly interfaces to turn complex NDVI data into practical, farm-level insights.
Ready to harness the power of NDVI and other advanced agricultural technologies for your farm? Visit our website to learn more about our services, or download our mobile app for Android or iOS to get started today.
For developers interested in integrating our satellite and weather data into their own applications, check out our API documentation.
Subscribe to Farmonaut’s services and take your farming to the next level:
Join us in revolutionizing agriculture with data-driven insights and precision farming techniques. Together, we can create a more sustainable and productive future for farming worldwide.