Mastering NDWI: Understanding Water Thresholds and Ranges for Precision Agriculture
In the ever-evolving landscape of precision agriculture, understanding and utilizing advanced remote sensing techniques has become crucial for optimizing crop management and water resource allocation. At Farmonaut, we’re committed to providing cutting-edge solutions that empower farmers and agricultural professionals with the tools they need to make informed decisions. One such powerful tool in our arsenal is the Normalized Difference Water Index (NDWI), a satellite-derived index that plays a pivotal role in water resource management and crop health monitoring.
In this comprehensive guide, we’ll delve deep into the world of NDWI, exploring its significance, applications, and how it can revolutionize your approach to precision agriculture. We’ll cover everything from the basics of NDWI calculation to advanced techniques for interpreting NDWI data, with a special focus on understanding the NDWI range for water and the NDWI threshold for water.
Table of Contents
- Introduction to NDWI
- The Science Behind NDWI
- Understanding NDWI Range for Water
- NDWI Threshold for Water: Key Considerations
- Applications of NDWI in Precision Agriculture
- Farmonaut’s Approach to NDWI Analysis
- Case Studies: NDWI in Action
- Challenges and Limitations of NDWI
- Future Trends in Water Index Analysis
- Integrating NDWI with Other Remote Sensing Techniques
- FAQs
1. Introduction to NDWI
The Normalized Difference Water Index (NDWI) is a satellite-derived index used to delineate open water features and enhance their presence in remotely-sensed digital imagery. Developed by McFeeters in 1996, NDWI has become an indispensable tool in various fields, including hydrology, agriculture, and environmental monitoring.
At its core, NDWI water analysis leverages the reflectance characteristics of water in different spectral bands to identify and quantify water content in vegetation and open water bodies. This makes it an invaluable resource for precision agriculture, allowing farmers and agronomists to make data-driven decisions about irrigation, crop health, and water resource management.
2. The Science Behind NDWI
To truly appreciate the power of NDWI, it’s essential to understand the underlying science. NDWI is calculated using the following formula:
NDWI = (Green – NIR) / (Green + NIR)
Where:
- Green represents the reflectance in the green spectral band
- NIR represents the reflectance in the near-infrared spectral band
This formula exploits the fact that water absorbs light strongly in the near-infrared part of the spectrum while reflecting green light. By contrast, vegetation and soil reflect NIR light more strongly than green light. This difference in reflectance properties allows us to distinguish water bodies from other land cover types effectively.
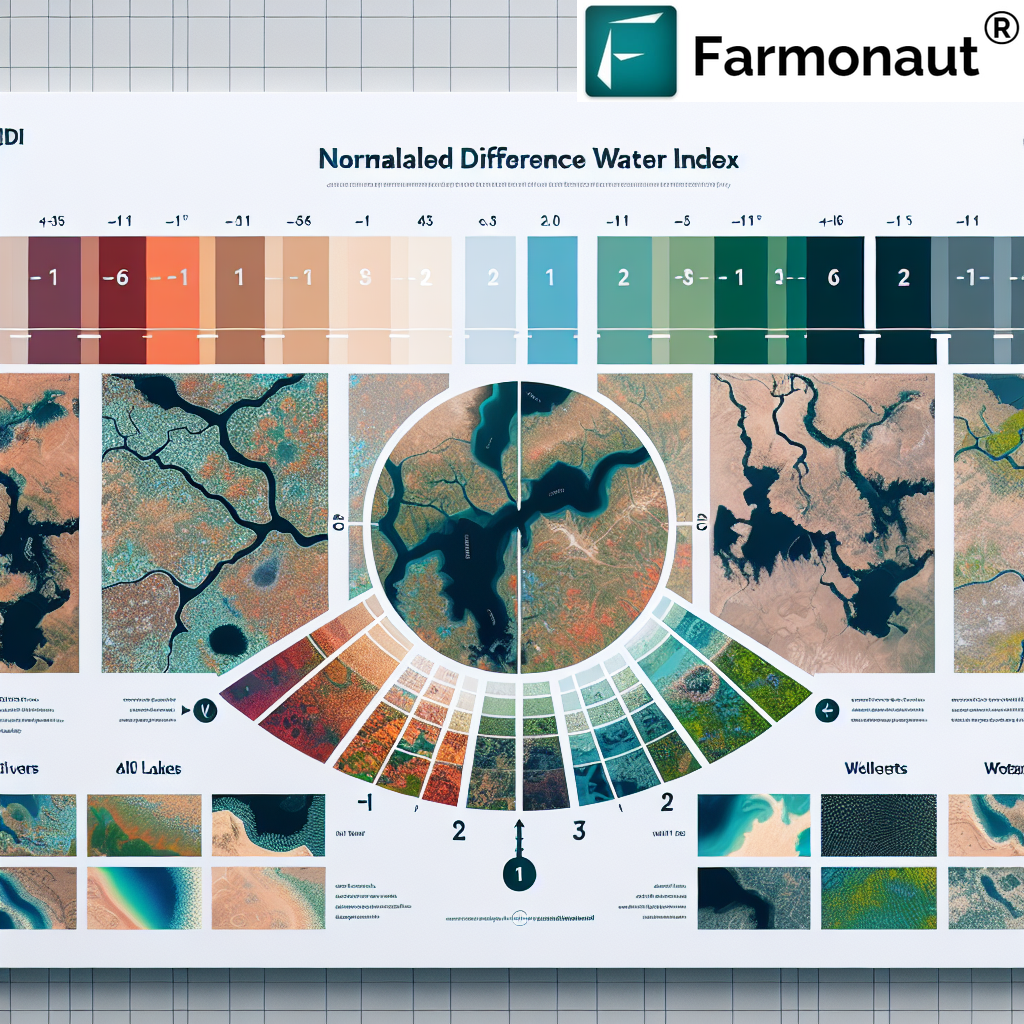
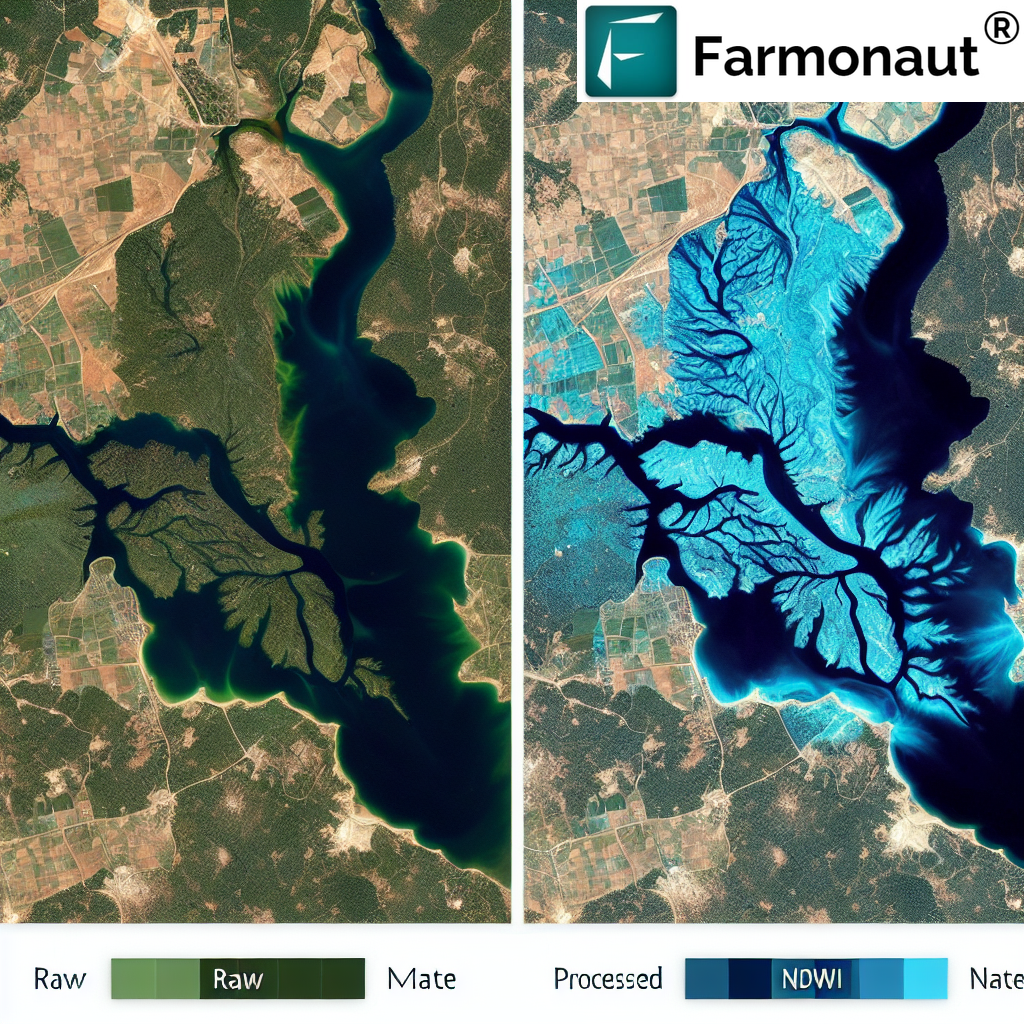
3. Understanding NDWI Range for Water
One of the key aspects of interpreting NDWI data is understanding the NDWI range for water. The NDWI values typically range from -1 to +1, with higher positive values indicating a higher likelihood of water presence. However, the exact range can vary depending on factors such as water turbidity, depth, and vegetation cover.
Generally, we consider the following ranges:
- NDWI > 0.3: High probability of open water
- 0.0 < NDWI < 0.3: Mixed pixels or very shallow water
- NDWI < 0.0: Non-water features (soil, vegetation)
It’s important to note that these ranges are not absolute and may require adjustment based on local conditions and the specific satellite sensor used.
4. NDWI Threshold for Water: Key Considerations
Determining the appropriate NDWI threshold for water is crucial for accurate water body delineation and monitoring. While a threshold of 0 is often used as a starting point, the optimal threshold can vary depending on several factors:
- Sensor characteristics
- Atmospheric conditions
- Water body type (e.g., clear lakes vs. turbid rivers)
- Surrounding land cover
- Seasonal variations
At Farmonaut, we employ advanced machine learning algorithms to dynamically adjust NDWI thresholds based on these factors, ensuring optimal accuracy in water detection across diverse agricultural landscapes.
5. Applications of NDWI in Precision Agriculture
The applications of NDWI in precision agriculture are vast and varied. Some key use cases include:
- Irrigation management: Monitoring soil moisture and optimizing irrigation schedules
- Crop stress detection: Identifying areas of water stress in crops
- Flood monitoring: Tracking flood extents and assessing crop damage
- Water resource management: Monitoring water levels in reservoirs and ponds
- Wetland mapping: Delineating and monitoring wetland areas
- Drought assessment: Evaluating the impact of drought on agricultural regions
By leveraging NDWI data, farmers can make more informed decisions about water usage, leading to improved crop yields and more sustainable farming practices.
6. Farmonaut’s Approach to NDWI Analysis
At Farmonaut, we’ve developed a sophisticated approach to NDWI analysis that combines cutting-edge satellite technology with advanced AI algorithms. Our platform integrates NDWI data with other key vegetation indices and meteorological information to provide a comprehensive view of crop health and water resource dynamics.
Key features of our NDWI analysis include:
- High-resolution satellite imagery for precise water body delineation
- AI-driven threshold adjustment for optimal accuracy
- Time-series analysis for tracking changes in water content over time
- Integration with our Jeevn AI Advisory System for personalized farm management recommendations
- Seamless data visualization through our user-friendly web and mobile applications
To experience the power of our NDWI analysis firsthand, visit our Farmonaut app or explore our satellite API for custom integrations.
7. Case Studies: NDWI in Action
To illustrate the practical applications of NDWI in precision agriculture, let’s explore a few hypothetical case studies:
Case Study 1: Optimizing Irrigation in a Drought-Prone Region
A large-scale wheat farm in a semi-arid region used Farmonaut’s NDWI analysis to optimize their irrigation strategy. By monitoring NDWI values across their fields, they were able to identify areas of water stress early and adjust their irrigation accordingly. This resulted in a 20% reduction in water usage while maintaining crop yields.
Case Study 2: Flood Impact Assessment
Following a severe flood event, a regional agricultural department utilized NDWI data from Farmonaut to rapidly assess the extent of flooding and its impact on crops. This allowed for quick and accurate damage assessment, facilitating timely disaster response and support for affected farmers.
Case Study 3: Wetland Conservation
A conservation organization partnered with local farmers to monitor and protect wetland areas adjacent to agricultural land. Using time-series NDWI analysis, they were able to track changes in wetland extent and health, informing both conservation efforts and sustainable farming practices in the surrounding areas.
8. Challenges and Limitations of NDWI
While NDWI is a powerful tool, it’s important to be aware of its limitations:
- Sensitivity to atmospheric conditions: Cloud cover and atmospheric haze can affect NDWI calculations
- Mixed pixels: Areas with both water and vegetation can be challenging to interpret
- Shallow water detection: Very shallow water bodies may be difficult to detect accurately
- Temporal resolution: Depending on the satellite used, there may be limitations in how frequently NDWI data can be updated
At Farmonaut, we address these challenges through advanced data processing techniques, multi-sensor data fusion, and continuous improvement of our algorithms.
9. Future Trends in Water Index Analysis
The field of water index analysis is rapidly evolving, with several exciting trends on the horizon:
- Integration of SAR (Synthetic Aperture Radar) data for all-weather monitoring
- Development of new water indices that address specific challenges (e.g., turbid water detection)
- Increased use of AI and machine learning for automated feature extraction and change detection
- Combination of satellite data with IoT sensors for enhanced precision and real-time monitoring
- Advancements in hyperspectral imaging for more detailed water quality analysis
At Farmonaut, we’re committed to staying at the forefront of these developments, continuously enhancing our platform to provide the most advanced and accurate water resource management tools to our users.
10. Integrating NDWI with Other Remote Sensing Techniques
To maximize the value of NDWI data, it’s often beneficial to integrate it with other remote sensing techniques and indices. At Farmonaut, we combine NDWI analysis with:
- NDVI (Normalized Difference Vegetation Index) for comprehensive crop health monitoring
- Thermal imagery for temperature-based stress detection
- Soil moisture indices for a holistic view of water availability
- Topographic data for understanding water flow and accumulation patterns
This multi-faceted approach allows for a more nuanced understanding of agricultural ecosystems, enabling more precise and effective farm management strategies.
Farmonaut Satellite System vs. Drone and IoT-based Farm Monitoring
| Feature | Farmonaut Satellite System | Drone-based Monitoring | IoT-based Monitoring |
|---|---|---|---|
| Coverage Area | Large scale (100s to 1000s of hectares) | Medium scale (10s to 100s of hectares) | Small scale (1s to 10s of hectares) |
| Frequency of Data Collection | Regular (every few days) | On-demand (requires manual flight) | Continuous (real-time data) |
| Initial Setup Cost | Low | High (equipment purchase) | Medium to High (sensor deployment) |
| Operational Complexity | Low (automated) | High (requires trained pilot) | Medium (maintenance of sensors) |
| Data Processing | Automated (AI-driven) | Semi-automated (requires post-processing) | Automated (real-time data streams) |
| Scalability | Highly scalable | Limited scalability | Moderately scalable |
| Weather Dependency | Moderate (affected by cloud cover) | High (limited by wind and precipitation) | Low (continuous operation) |
| Integration with Other Data Sources | High (seamless integration with multiple datasets) | Moderate | Moderate to High |
Conclusion
Mastering the use of NDWI in precision agriculture opens up a world of possibilities for improved water resource management and crop optimization. By understanding the NDWI range for water and the nuances of setting an appropriate NDWI threshold for water, agricultural professionals can make more informed decisions that lead to increased productivity and sustainability.
At Farmonaut, we’re dedicated to providing the most advanced and user-friendly tools for leveraging NDWI and other remote sensing techniques in agriculture. Our platform combines cutting-edge satellite technology with AI-driven insights to deliver actionable intelligence to farmers and agricultural organizations of all sizes.
Ready to revolutionize your approach to water management and precision agriculture? Explore our solutions today:
Join us in harnessing the power of NDWI and advanced satellite technology to create a more sustainable and productive future for agriculture.
FAQs
-
Q: What is the typical NDWI range for water bodies?
A: The NDWI range for water bodies typically falls between 0.3 and 1.0, with higher values indicating a higher probability of open water. However, this range can vary depending on factors such as water turbidity and depth. -
Q: How is the NDWI threshold for water determined?
A: The NDWI threshold for water is often set at 0 as a starting point, but the optimal threshold can vary based on local conditions, sensor characteristics, and the specific application. At Farmonaut, we use AI algorithms to dynamically adjust thresholds for maximum accuracy. -
Q: Can NDWI be used to detect soil moisture?
A: While NDWI is primarily used for detecting open water bodies, it can provide some indication of soil moisture content. However, for more accurate soil moisture assessment, it’s often combined with other indices and ground-based measurements. -
Q: How often is NDWI data updated in Farmonaut’s system?
A: The frequency of NDWI updates depends on the satellite constellation used. Typically, we provide updates every 3-5 days, but this can vary based on cloud cover and specific user requirements. -
Q: Is NDWI analysis affected by cloud cover?
A: Yes, cloud cover can affect NDWI calculations as it obstructs the satellite’s view of the Earth’s surface. At Farmonaut, we use advanced cloud masking techniques and multi-temporal analysis to minimize the impact of cloud cover on our NDWI data.
