Mastering Red Edge Indices: Understanding NDRE, NDREI, and Chlorophyll Index for Precision Agriculture
In the ever-evolving world of precision agriculture, we at Farmonaut are committed to bringing you the most advanced and effective tools for crop monitoring and management. Today, we’re diving deep into the fascinating realm of red edge indices – a cutting-edge technology that’s revolutionizing the way we assess crop health and productivity.
Table of Contents
- Introduction to Red Edge Indices
- What is Red Edge?
- Normalized Difference Red Edge (NDRE)
- Normalized Difference Red Edge Index (NDREI)
- Red Edge Chlorophyll Index
- Applications in Precision Agriculture
- Farmonaut’s Satellite-Based Solutions
- Comparison: Satellite vs. Drone vs. IoT
- Implementing Red Edge Indices in Your Farm Management
- Future of Red Edge Technology
- FAQs
1. Introduction to Red Edge Indices
In the realm of remote sensing and precision agriculture, red edge indices have emerged as powerful tools for assessing crop health, vigor, and productivity. These indices leverage the unique spectral properties of plants in the red edge region of the electromagnetic spectrum to provide valuable insights into crop conditions.
At Farmonaut, we harness the power of these indices through our advanced satellite-based farm management solutions. Our platform integrates red edge data to offer farmers and agronomists unparalleled insights into their crops’ health and performance.
2. What is Red Edge?
What is red edge exactly? The red edge refers to the region of rapid change in reflectance of vegetation in the near-infrared range of the electromagnetic spectrum. This transition occurs between the red band, where chlorophyll absorbs most of the light, and the near-infrared band, where leaf structures strongly reflect light.
The red edge typically occurs between 680 nm and 730 nm in the spectrum. This region is particularly sensitive to changes in chlorophyll content and leaf structure, making it an excellent indicator of plant health and stress.
3. Normalized Difference Red Edge (NDRE)
The Normalized Difference Red Edge (NDRE) is a vegetation index that utilizes the red edge band to assess plant health and chlorophyll content. It’s particularly useful for detecting subtle changes in crop condition that might not be apparent with traditional indices like NDVI (Normalized Difference Vegetation Index).
The NDRE is calculated using the following formula:
NDRE = (NIR – Red Edge) / (NIR + Red Edge)
Where:
- NIR = Reflectance in the Near-Infrared band
- Red Edge = Reflectance in the Red Edge band
NDRE values typically range from -1 to 1, with higher values indicating healthier vegetation with higher chlorophyll content.
4. Normalized Difference Red Edge Index (NDREI)
The Normalized Difference Red Edge Index (NDREI) is a variation of the NDRE that’s sometimes used interchangeably. However, it’s important to note that some researchers and platforms may use slightly different formulations or band combinations for NDREI.
The basic principle remains the same – leveraging the red edge region to assess plant health and chlorophyll content. At Farmonaut, we ensure that our satellite-based monitoring systems are calibrated to provide accurate NDREI measurements, allowing farmers to track subtle changes in crop health over time.
5. Red Edge Chlorophyll Index
The Red Edge Chlorophyll Index is another powerful tool in the arsenal of precision agriculture. This index is specifically designed to estimate the chlorophyll content in plants, which is a crucial indicator of photosynthetic activity and overall plant health.
The Red Edge Chlorophyll Index is calculated using the following formula:
CIred edge = (NIR / Red Edge) – 1
This index is particularly sensitive to changes in chlorophyll content and can detect stress in plants before visible symptoms appear. At Farmonaut, we incorporate the Red Edge Chlorophyll Index into our comprehensive crop monitoring solutions, providing farmers with early warning signs of potential issues.
6. Applications in Precision Agriculture
The applications of red edge indices in precision agriculture are vast and growing. Here are some key areas where these indices prove invaluable:
- Early Stress Detection: Red edge indices can detect plant stress before visible symptoms appear, allowing for prompt intervention.
- Nutrient Management: By accurately assessing chlorophyll content, these indices help in optimizing fertilizer application.
- Yield Prediction: Red edge data can contribute to more accurate yield forecasting models.
- Pest and Disease Monitoring: Changes in red edge indices can indicate the onset of pest infestations or diseases.
- Irrigation Management: By assessing plant vigor, these indices can help in optimizing irrigation schedules.
7. Farmonaut’s Satellite-Based Solutions
At Farmonaut, we’ve integrated red edge indices into our advanced satellite-based farm management platform. Our solutions offer:
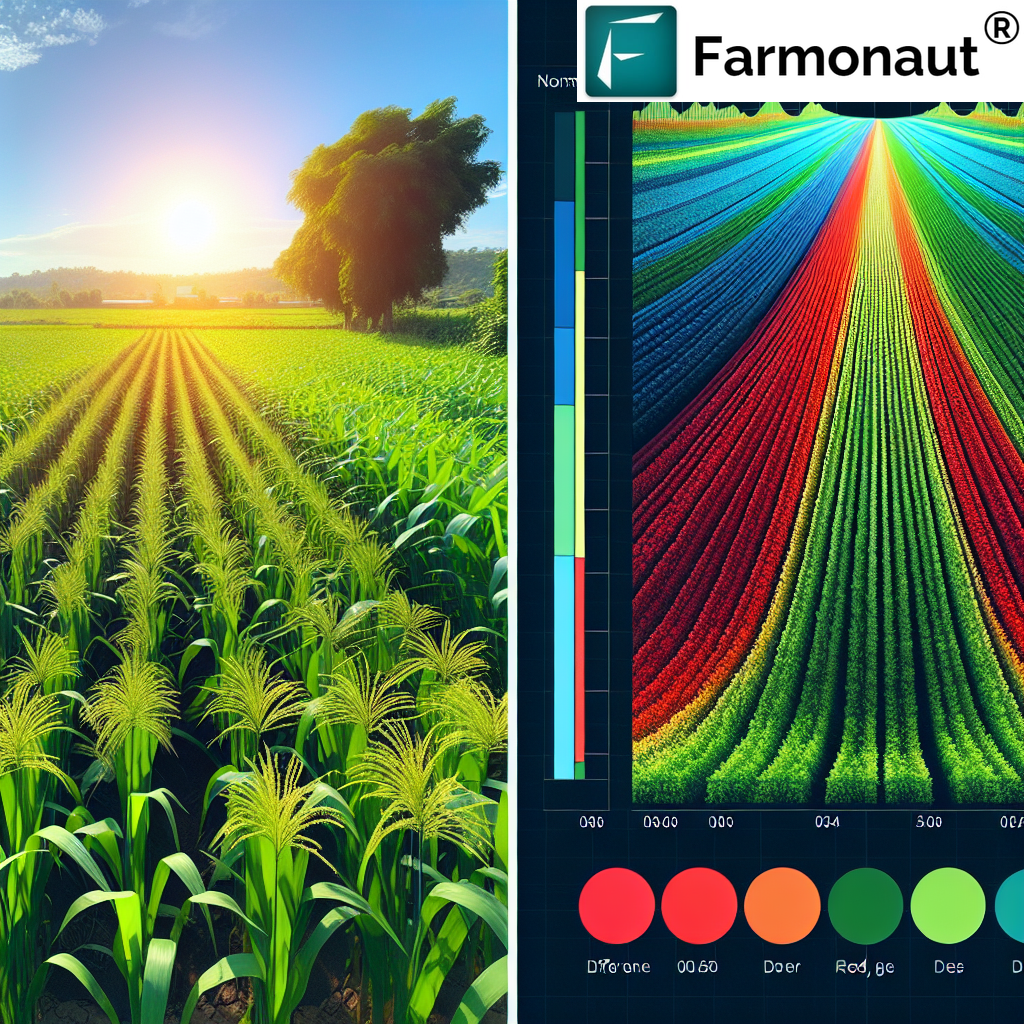
- Regular, high-resolution satellite imagery capturing red edge data
- AI-powered analysis of NDRE, NDREI, and Red Edge Chlorophyll Index
- User-friendly visualizations and reports
- Integration with our Jeevn AI Advisory System for personalized recommendations
- Mobile app access for on-the-go monitoring
To experience the power of our satellite-based solutions, visit our app redirect page or download our mobile app for Android or iOS.
8. Comparison: Satellite vs. Drone vs. IoT
While drones and IoT devices have their place in precision agriculture, satellite-based monitoring offers unique advantages, especially when it comes to implementing red edge indices at scale. Here’s how Farmonaut’s Satellite System compares:
| Feature | Farmonaut Satellite System | Drone-based Monitoring | IoT-based Monitoring |
|---|---|---|---|
| Coverage Area | Large scale (thousands of hectares) | Limited (tens of hectares per flight) | Localized (point measurements) |
| Frequency of Data Collection | Regular (every few days) | On-demand (requires manual flights) | Continuous (limited to sensor locations) |
| Red Edge Data Capture | Advanced multispectral imaging | Possible with specialized cameras | Limited or not available |
| Cost-effectiveness for Large Areas | High | Moderate | Low |
| Ease of Implementation | Easy (no on-site equipment needed) | Moderate (requires skilled operators) | Complex (requires installation and maintenance) |
| Data Processing and Analysis | Automated, AI-powered | Often requires manual processing | Varies (may require custom solutions) |
9. Implementing Red Edge Indices in Your Farm Management
Implementing red edge indices in your farm management strategy can significantly enhance your decision-making process. Here’s how you can get started with Farmonaut:
- Sign Up: Create an account on our platform or mobile app.
- Define Your Fields: Map out your fields using our intuitive interface.
- Access Satellite Data: Start receiving regular satellite imagery and analyses.
- Interpret the Indices: Use our guides and AI-powered insights to understand the red edge data.
- Take Action: Implement targeted interventions based on the insights provided.
- Monitor Progress: Track changes over time and adjust your strategies accordingly.
For developers and businesses looking to integrate our satellite and weather data into their own systems, we offer comprehensive API access. Check out our API documentation and developer docs for more information.
10. Future of Red Edge Technology
The future of red edge technology in precision agriculture is bright and filled with potential. At Farmonaut, we’re continuously working on enhancing our capabilities in this area. Some exciting developments on the horizon include:
- Integration of hyperspectral imaging for even more detailed crop analysis
- Advanced machine learning models for improved stress detection and yield prediction
- Combination of red edge data with other data sources (e.g., weather, soil) for holistic farm management
- Development of crop-specific red edge indices for optimized performance
Stay tuned to Farmonaut for the latest advancements in red edge technology and precision agriculture!
11. FAQs
Q: How often should I monitor red edge indices for my crops?
A: We recommend monitoring at least weekly during critical growth stages. Farmonaut’s satellite-based system provides regular updates to ensure you don’t miss any important changes.
Q: Can red edge indices detect all types of crop stress?
A: While red edge indices are powerful tools, they may not detect all types of stress equally. They’re particularly effective for nutrient deficiencies and some diseases. It’s best to use them in conjunction with other monitoring methods for comprehensive crop health assessment.
Q: How do weather conditions affect red edge measurements?
A: Cloud cover and atmospheric conditions can impact satellite-based measurements. At Farmonaut, we use advanced algorithms to correct for these factors and provide reliable data even in challenging conditions.
Q: Are red edge indices useful for all crop types?
A: Red edge indices are useful for most crops, but their effectiveness can vary. They’re particularly valuable for crops with dense canopies. Our system is calibrated for a wide range of crop types to ensure optimal performance.
Q: How do I interpret red edge index values?
A: Interpretation can vary depending on the specific index and crop type. Generally, higher values indicate healthier vegetation. Our platform provides guidance and AI-powered insights to help you interpret the data effectively.
Conclusion
Red edge indices have revolutionized the way we monitor and manage crops in precision agriculture. By leveraging the power of satellite technology and advanced analytics, Farmonaut brings these powerful tools directly to farmers and agribusinesses worldwide.
Ready to experience the power of red edge technology in your farm management? Subscribe to Farmonaut today and take your agricultural practices to the next level!
Join the precision agriculture revolution with Farmonaut – where cutting-edge technology meets sustainable farming practices. Together, we can build a more productive and sustainable future for agriculture.
