Maximizing Crop Health: Understanding NDVI for Plant Monitoring and Management
At Farmonaut, we’re committed to revolutionizing agriculture through advanced technology and data-driven insights. One of the most powerful tools in our arsenal is the Normalized Difference Vegetation Index (NDVI), a key metric for assessing plant health and vitality. In this comprehensive guide, we’ll explore how NDVI can transform your approach to crop management and maximize your yields.
What is NDVI and Why is it Important for Plants?
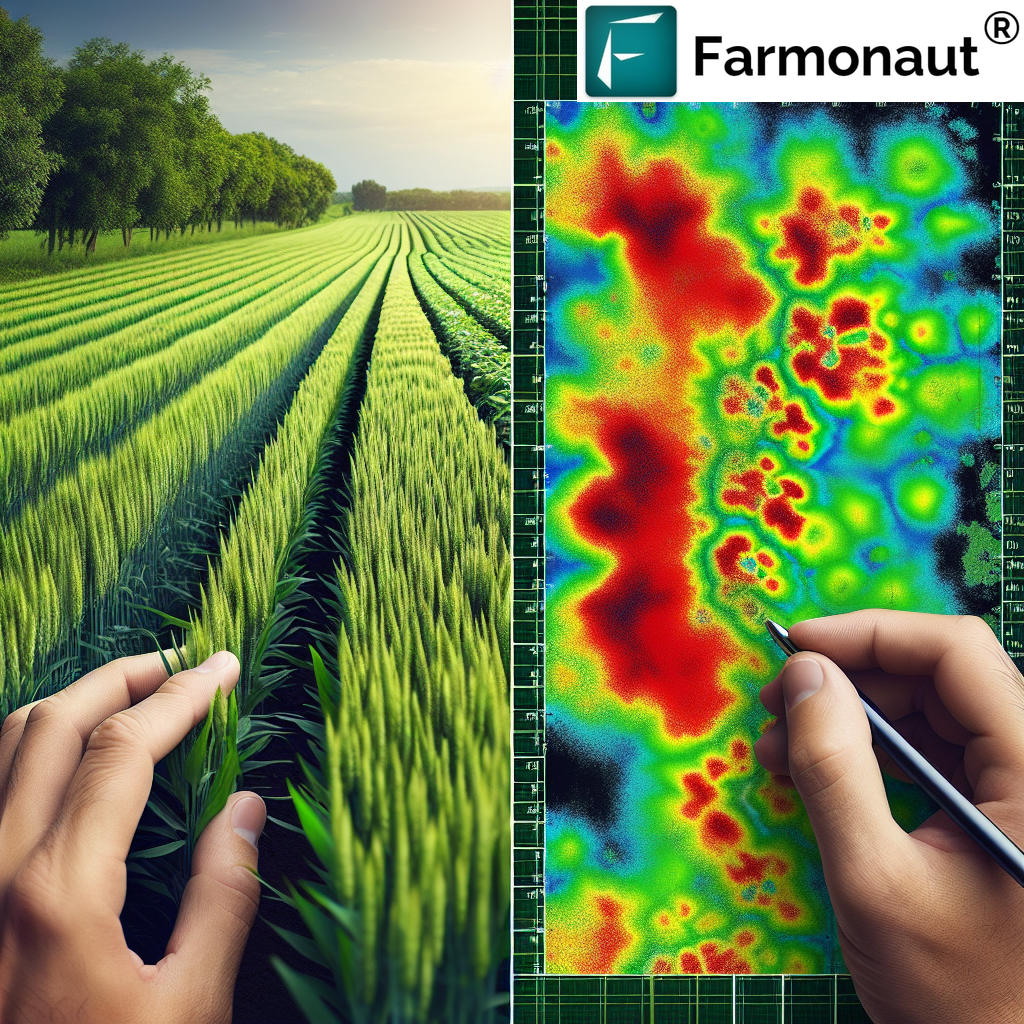
NDVI, or Normalized Difference Vegetation Index, is a crucial indicator used in remote sensing to assess the health and density of vegetation. This index is particularly valuable for monitoring ndvi plants, providing farmers and agronomists with vital information about crop conditions.
- NDVI measures the difference between near-infrared (which vegetation strongly reflects) and red light (which vegetation absorbs).
- The resulting values range from -1 to +1, with higher values indicating healthier, denser vegetation.
- NDVI is sensitive to changes in plant health, making it an excellent tool for early detection of stress or disease in crops.
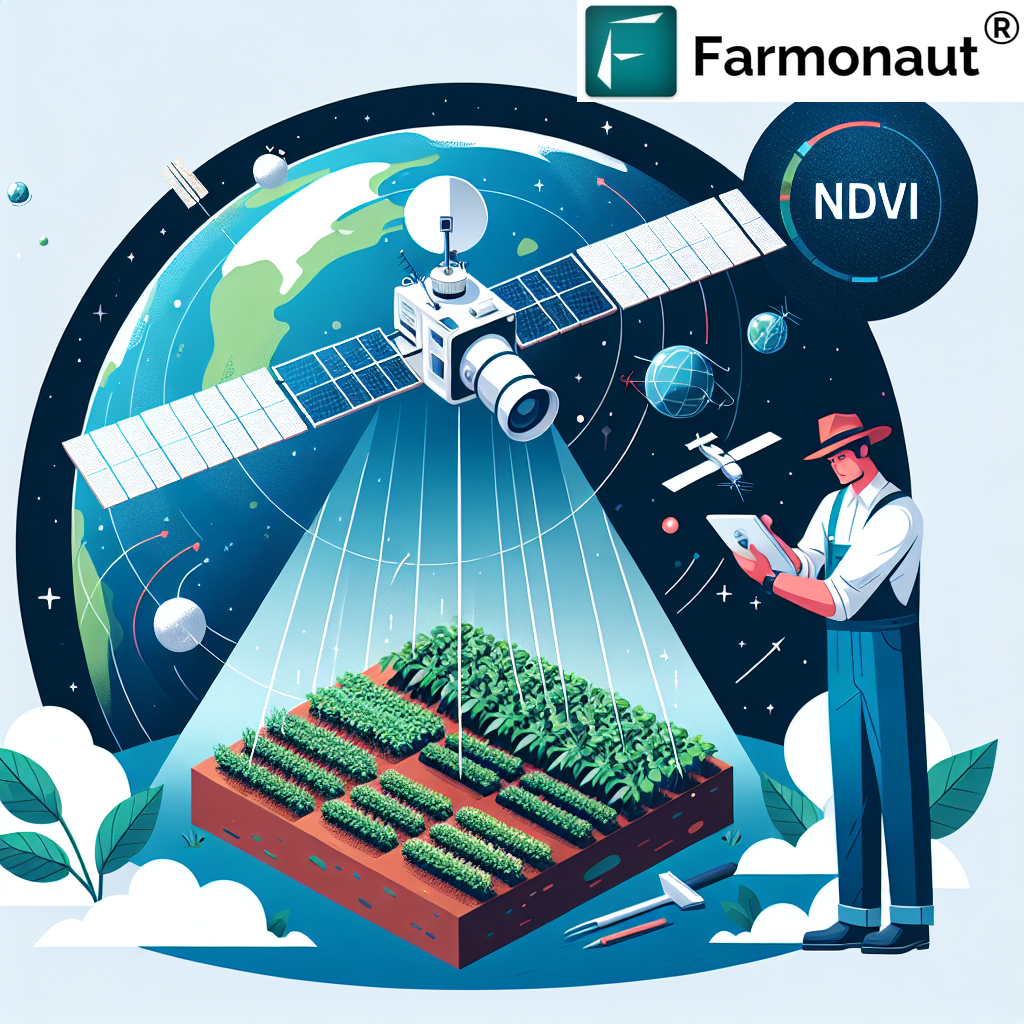
Understanding NDVI is essential for modern precision agriculture, allowing farmers to make data-driven decisions about irrigation, fertilization, and pest management. At Farmonaut, we harness the power of NDVI through our advanced satellite-based crop monitoring system.
The Science Behind NDVI Plants
The concept of NDVI is rooted in the unique way plants interact with different wavelengths of light. Healthy plants absorb most visible light (especially in the red spectrum) for photosynthesis while reflecting a large portion of near-infrared light. This characteristic spectral signature forms the basis of NDVI calculations.
The NDVI formula is:
NDVI = (NIR – RED) / (NIR + RED)
Where:
- NIR = reflection in the near-infrared spectrum
- RED = reflection in the red range of the spectrum
This simple yet powerful formula allows us to quantify vegetation health and density across large areas quickly and efficiently.
Applications of NDVI in Agriculture
The applications of NDVI in agriculture are vast and transformative. Here are some key ways we at Farmonaut utilize NDVI data to benefit our clients:
- Crop Health Monitoring: Regular NDVI assessments allow for early detection of stress in ndvi plants, enabling timely interventions.
- Yield Prediction: NDVI values correlate strongly with biomass and potential yield, helping farmers and agribusinesses plan harvests and manage supply chains more effectively.
- Irrigation Management: By identifying areas of water stress, NDVI helps optimize irrigation schedules and water use efficiency.
- Fertilizer Application: NDVI maps can guide variable-rate fertilizer applications, ensuring nutrients are applied where they’re needed most.
- Pest and Disease Detection: Changes in NDVI can indicate the presence of pests or diseases before they become visible to the naked eye.
These applications demonstrate the power of NDVI in transforming agricultural practices, making them more precise, efficient, and sustainable.
Farmonaut’s NDVI-based Crop Monitoring System
At Farmonaut, we’ve developed a state-of-the-art satellite-based crop monitoring system that leverages NDVI technology to provide unparalleled insights into crop health and performance. Our system offers several advantages over traditional monitoring methods:
| Feature | Farmonaut Satellite System | Drone-based Monitoring | IoT-based Monitoring |
|---|---|---|---|
| Coverage Area | Large scale (global) | Limited (local) | Limited (local) |
| Frequency of Data | Regular (every few days) | On-demand | Continuous |
| Cost-effectiveness | High | Medium | Low |
| Ease of Use | Very High | Medium | Low |
| Data Processing | Automated | Manual/Semi-automated | Automated |
| Scalability | Highly Scalable | Limited Scalability | Moderate Scalability |
Our satellite-based system provides a comprehensive view of crop health across vast areas, making it an ideal solution for farms of all sizes. By leveraging advanced AI and machine learning algorithms, we transform raw NDVI data into actionable insights that farmers can use to optimize their operations.
Interpreting NDVI Values for Plant Health
Understanding how to interpret NDVI values is crucial for making the most of this technology. Here’s a general guide to NDVI values and what they mean for plant health:
- -1 to 0: Indicates non-vegetated areas like water, bare soil, or infrastructure.
- 0 to 0.33: Represents unhealthy or sparse vegetation, possibly indicating stress or early growth stages.
- 0.33 to 0.66: Moderate vegetation health, typical of maturing crops or moderately dense plant cover.
- 0.66 to 1: Indicates very healthy, dense vegetation, often seen in peak growing seasons or in highly productive areas.
It’s important to note that NDVI values can vary depending on the crop type, growth stage, and local environmental conditions. At Farmonaut, we provide customized interpretations based on these factors to ensure our clients receive the most accurate and relevant insights.
Leveraging NDVI for Precision Agriculture
Precision agriculture is all about applying the right interventions at the right time and in the right place. NDVI is a cornerstone of this approach, enabling farmers to make data-driven decisions that optimize resource use and maximize yields. Here’s how we at Farmonaut help our clients leverage NDVI for precision agriculture:
- Zone Management: We use NDVI data to create management zones within fields, allowing for targeted interventions based on specific crop needs.
- Variable Rate Technology (VRT): Our NDVI maps integrate seamlessly with VRT systems, enabling precise application of inputs like fertilizers and pesticides.
- Irrigation Scheduling: By analyzing NDVI trends, we help farmers optimize their irrigation schedules, ensuring crops receive water when and where they need it most.
- Crop Scouting: NDVI anomalies guide efficient crop scouting efforts, focusing attention on areas that may require immediate intervention.
- Yield Forecasting: Historical and current NDVI data feed into our advanced yield prediction models, helping farmers and agribusinesses plan for harvest and market demands.
By integrating NDVI into precision agriculture practices, farmers can significantly reduce input costs, minimize environmental impact, and increase overall productivity.
NDVI and Climate Change Adaptation
As climate change continues to impact agricultural systems worldwide, the role of NDVI in adapting to these changes becomes increasingly important. At Farmonaut, we’re leveraging NDVI data to help farmers build resilience against climate-related challenges:
- Drought Monitoring: NDVI time series can identify areas experiencing drought stress, allowing for proactive management strategies.
- Crop Selection: Long-term NDVI trends can inform decisions about which crops are best suited to changing local climate conditions.
- Carbon Sequestration: NDVI data helps quantify biomass production, which is crucial for carbon credit programs and sustainable agriculture initiatives.
- Biodiversity Conservation: By monitoring natural vegetation alongside croplands, NDVI supports efforts to maintain ecological balance and protect biodiversity.
Our commitment to leveraging NDVI for climate change adaptation reflects our broader mission to promote sustainable and resilient agricultural practices globally.
Combining NDVI with Other Remote Sensing Indices
While NDVI is a powerful tool on its own, its effectiveness can be further enhanced when combined with other remote sensing indices. At Farmonaut, we integrate multiple indices to provide a comprehensive view of crop and environmental conditions:
- Enhanced Vegetation Index (EVI): Complements NDVI by reducing atmospheric influences and canopy background signals.
- Soil Adjusted Vegetation Index (SAVI): Minimizes soil brightness influences, particularly useful in areas with sparse vegetation.
- Normalized Difference Water Index (NDWI): Provides insights into plant and soil moisture content, complementing NDVI’s vegetation health assessment.
- Leaf Area Index (LAI): Offers a quantitative measure of the canopy foliage, enhancing our understanding of crop development stages.
By synthesizing data from these indices, we provide our clients with a nuanced and holistic view of their agricultural landscapes, enabling more informed decision-making.
The Future of NDVI in Agriculture
As technology continues to advance, the applications and potential of NDVI in agriculture are expanding rapidly. At Farmonaut, we’re at the forefront of these developments, exploring new ways to harness NDVI data for the benefit of farmers and the global food system:
- AI-Powered Predictions: Integrating NDVI data with artificial intelligence to provide even more accurate yield predictions and risk assessments.
- Hyperspectral Imaging: Exploring the use of hyperspectral sensors to provide more detailed spectral information, potentially leading to early detection of specific plant diseases or nutrient deficiencies.
- Blockchain Integration: Combining NDVI data with blockchain technology to enhance traceability in the food supply chain, providing consumers with transparent information about crop production practices.
- Ecosystem Services Valuation: Using NDVI to quantify ecosystem services provided by agricultural lands, potentially opening new revenue streams for farmers through environmental markets.
These innovative applications demonstrate the ongoing potential of NDVI to transform agriculture, making it more sustainable, efficient, and responsive to global challenges.
Farmonaut’s Commitment to Accessible NDVI Technology
At Farmonaut, we believe that the benefits of NDVI technology should be accessible to farmers of all scales. That’s why we’ve developed user-friendly platforms and services that make it easy for anyone to leverage the power of NDVI:
- Mobile App: Our mobile application provides on-the-go access to NDVI maps and insights. Download it now for Android or iOS.
- Web Platform: Our comprehensive web platform offers advanced NDVI analysis tools and historical data. Try it today.
- API Access: For developers and businesses looking to integrate NDVI data into their own systems, we offer robust API solutions. Explore our API options.
- Custom Solutions: We work with clients to develop tailored NDVI monitoring solutions that meet specific needs and integrate with existing farm management systems.
By making NDVI technology accessible and user-friendly, we’re empowering farmers worldwide to make data-driven decisions that improve their productivity and sustainability.
Case Studies: NDVI in Action
To illustrate the real-world impact of NDVI technology, let’s look at how some of our clients have benefited from incorporating NDVI into their agricultural practices:
- Large-Scale Wheat Farm in Australia: By using our NDVI-based zone management system, this farm reduced fertilizer use by 20% while maintaining yield levels, resulting in significant cost savings and reduced environmental impact.
- Smallholder Coffee Cooperative in Colombia: NDVI monitoring helped identify areas of coffee rust infestation early, allowing for targeted treatment and preventing widespread crop loss.
- Vineyard in California: Precision irrigation guided by NDVI data led to a 15% reduction in water use and a notable improvement in grape quality, enhancing the vineyard’s sustainability and profitability.
- Rice Farmers in Southeast Asia: NDVI-based yield predictions helped farmers negotiate better prices with buyers and plan their harvests more effectively, improving their economic resilience.
These case studies demonstrate the versatility and effectiveness of NDVI across different crops, scales, and geographical contexts.
Getting Started with NDVI Monitoring
Ready to harness the power of NDVI for your agricultural operations? Here’s how you can get started with Farmonaut’s NDVI monitoring services:
- Sign Up: Create an account on our platform to access our suite of NDVI monitoring tools.
- Define Your Fields: Use our intuitive mapping tool to outline the areas you want to monitor.
- Choose Your Plan: Select a subscription plan that fits your needs and budget.
- Explore Your Data: Start receiving regular NDVI updates and insights for your fields.
- Integrate and Act: Use our recommendations to inform your farming decisions and optimize your operations.
To get started, visit our application page or contact our team for personalized assistance.
FAQs About NDVI and Plant Monitoring
Q: How often should I monitor NDVI for my crops?
A: The frequency of NDVI monitoring depends on your crop type and growth stage. Generally, we recommend weekly or bi-weekly monitoring during critical growth periods.
Q: Can NDVI detect specific plant diseases?
A: While NDVI can indicate general plant stress, it cannot identify specific diseases. However, it can alert you to potential issues early, allowing for timely investigation and intervention.
Q: How accurate is NDVI for yield prediction?
A: NDVI is a strong indicator of potential yield, but accuracy can vary depending on crop type and environmental factors. When combined with other data sources and our advanced algorithms, NDVI-based yield predictions can be highly accurate.
Q: Is NDVI affected by cloud cover?
A: Yes, cloud cover can interfere with satellite-based NDVI measurements. However, our system uses advanced cloud-masking techniques and integrates data from multiple satellite passes to ensure consistent monitoring.
Q: Can NDVI be used for all types of crops?
A: NDVI is effective for most green, leafy vegetation. However, its sensitivity may vary for different crop types. Our system is calibrated to account for these differences, providing accurate insights across a wide range of crops.
Conclusion: Embracing the Future of Agriculture with NDVI
As we’ve explored throughout this guide, NDVI is a powerful tool that’s transforming the way we approach agriculture. By providing invaluable insights into crop health and performance, NDVI enables farmers to make data-driven decisions that optimize yields, reduce costs, and promote sustainability.
At Farmonaut, we’re committed to making this technology accessible and actionable for farmers of all scales. Our advanced satellite-based monitoring system, coupled with AI-powered analytics, puts the power of NDVI in the hands of farmers worldwide.
As we look to the future, the potential applications of NDVI in agriculture continue to expand. From enhancing climate resilience to supporting precision agriculture practices, NDVI will play a crucial role in meeting the global challenges of food security and sustainable resource management.
We invite you to join us on this journey towards smarter, more sustainable agriculture. Explore our services, try our platform, and discover how NDVI can transform your farming practices.
Ready to get started? Subscribe to Farmonaut’s services today and take the first step towards precision agriculture:
For more information on our API and developer resources, visit our API documentation page.
Together, let’s cultivate a future where technology and nature work in harmony to feed the world sustainably.