NDVI Explained: A Comprehensive Guide to Vegetation Health Mapping and Analysis
In the ever-evolving world of precision agriculture, understanding and utilizing advanced technologies is crucial for optimizing crop production and ensuring sustainable farming practices. One such technology that has revolutionized the way we monitor and analyze vegetation health is the Normalized Difference Vegetation Index (NDVI). In this comprehensive guide, we’ll delve deep into the world of NDVI, exploring its applications, calculations, and significance in modern agriculture.
What is NDVI and Why is it Important?
NDVI stands for Normalized Difference Vegetation Index. It is a simple yet powerful indicator used to assess the health and density of vegetation from satellite imagery. NDVI has become an invaluable tool in precision agriculture, environmental monitoring, and land management.
But what is NDVI primarily used to determine? NDVI is primarily used to determine the following:
- Vegetation health and vigor
- Biomass production
- Plant phenology (growth stages)
- Drought assessment
- Crop yield prediction
By utilizing NDVI, farmers, researchers, and land managers can gain crucial insights into plant health, allowing for more informed decision-making and targeted interventions.
The Science Behind NDVI: Understanding NDVI Wavelengths and Calculation
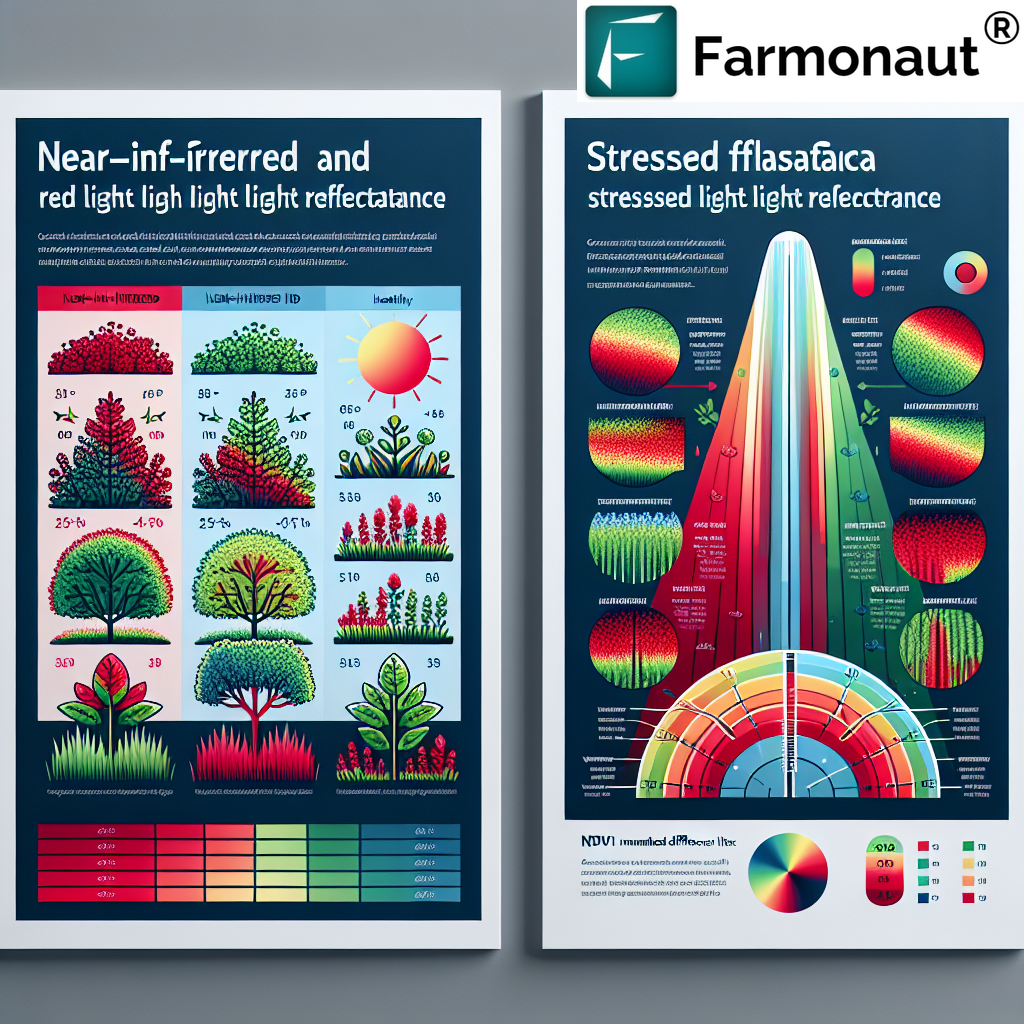
To truly grasp the power of NDVI, it’s essential to understand the science behind it. NDVI is based on the principle that healthy vegetation absorbs most of the visible light that hits it and reflects a large portion of near-infrared light.
NDVI Wavelengths
NDVI utilizes two specific NDVI wavelengths:
- Red light (visible spectrum): Typically around 620-700 nanometers
- Near-infrared (NIR) light: Usually in the range of 700-1100 nanometers
Healthy vegetation absorbs most of the red light for photosynthesis, while reflecting a significant portion of NIR light. This difference in reflectance forms the basis for NDVI calculation.
NDVI Calculation and Equation
The NDVI calculation is based on a simple mathematical formula. The NDVI equation is as follows:
NDVI = (NIR – RED) / (NIR + RED)
Where:
- NIR = Reflectance in the near-infrared band
- RED = Reflectance in the red band
This NDVI ratio produces values between -1 and +1. Generally, healthy vegetation will have higher NDVI values (closer to +1) due to higher NIR reflectance and lower red reflectance.
Understanding NDVI Values and Ranges
Interpreting NDVI values is crucial for assessing vegetation health. The NDVI ranges typically fall between -1 and +1, with different values indicating various land cover types and vegetation conditions:
- -1 to 0: Usually indicates water bodies, snow, or clouds
- 0 to 0.1: Represents barren areas of rock, sand, or snow
- 0.1 to 0.3: Shrubs and grasslands or senescing crops
- 0.3 to 0.8: Indicates healthy vegetation with increasing density
- 0.8 to 1: Dense vegetation, typically found in temperate and tropical rainforests
It’s important to note that these ranges can vary slightly depending on the specific ecosystem and time of year.
NDVI Scale and Colormap: Visualizing Vegetation Health
To make NDVI data more intuitive and visually appealing, we often use an NDVI scale and NDVI colormap. These visual representations help in quickly identifying areas of healthy vegetation, stressed plants, or bare soil.
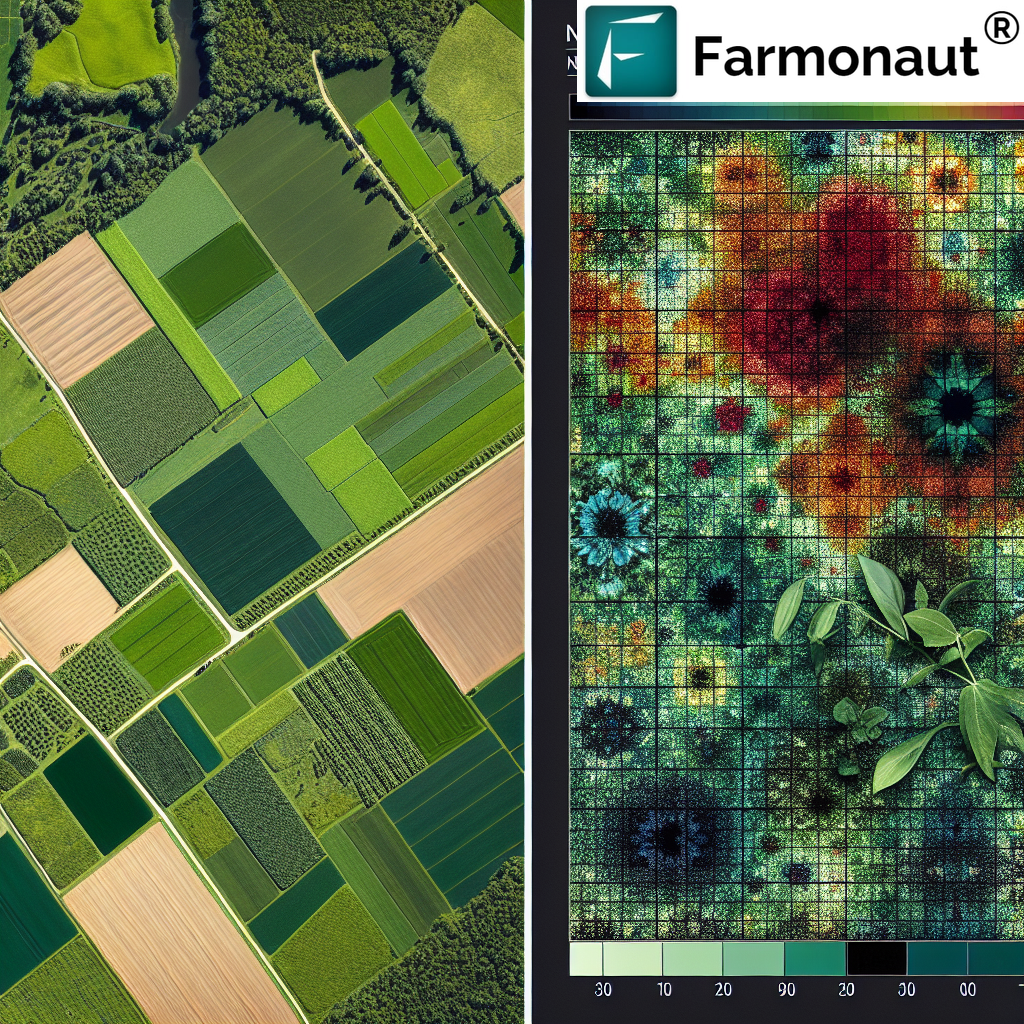
A typical NDVI colormap might use the following color scheme:
- Red: Very low NDVI values (barren areas, water)
- Orange/Yellow: Low NDVI values (sparse vegetation)
- Light Green: Moderate NDVI values (grassland, shrubs)
- Dark Green: High NDVI values (dense, healthy vegetation)
This color-coding allows for quick visual assessment of vegetation health across large areas.
NDVI Applications in Agriculture and Beyond
The applications of NDVI are vast and varied, extending far beyond just agriculture. Here are some key areas where NDVI proves invaluable:
1. Agriculture and Crop Monitoring
In agriculture, NDVI is primarily used for:
- NDVI plant health assessment: Identifying areas of stress or disease in crops
- Yield prediction: Estimating potential crop yields based on vegetation vigor
- Irrigation management: Identifying areas that may need more or less water
- Fertilizer application: Guiding precision application of nutrients
2. Environmental Monitoring
NDVI is also crucial for environmental studies, including:
- Deforestation tracking
- Drought monitoring
- Desertification assessment
- Biodiversity studies
3. Urban Planning
In urban areas, NDVI helps in:
- Assessing urban green spaces
- Monitoring urban heat islands
- Planning for sustainable urban development
4. Disaster Management
NDVI is valuable in assessing the impact of natural disasters such as:
- Floods
- Wildfires
- Hurricanes
NDVI Tools and Technologies
To harness the power of NDVI, various tools and technologies are available:
1. NDVI Software
Several software packages are available for NDVI analysis, including:
- QGIS: An open-source GIS software with NDVI QGIS capabilities
- ArcGIS: A powerful commercial GIS software with advanced NDVI tools
- ENVI: Specialized remote sensing software with robust NDVI analysis features
2. NDVI Apps
Mobile NDVI app options are becoming increasingly popular, allowing for on-the-go vegetation health assessment. Some notable apps include:
- Farmonaut: Offers satellite-based NDVI monitoring for farms (Android, iOS)
- FieldAgent: Provides drone-based NDVI mapping
- Sentera FieldAgent: Another drone-based solution for NDVI imaging
3. Satellite-based NDVI Services
Many companies offer satellite-based NDVI monitoring services, providing regular updates on vegetation health over large areas. Farmonaut’s satellite system, for instance, offers several advantages over drone and IoT-based farm monitoring:
| Feature | Farmonaut Satellite System | Drone-based Monitoring | IoT-based Monitoring |
|---|---|---|---|
| Coverage Area | Large (hundreds to thousands of hectares) | Limited (typically under 100 hectares per flight) | Limited (depends on sensor placement) |
| Frequency of Data | Regular (every few days) | On-demand (requires manual flights) | Continuous (but limited to sensor locations) |
| Initial Setup Cost | Low | High (drone purchase, training) | Moderate to High (sensor network setup) |
| Operational Complexity | Low (automated) | High (requires skilled operator) | Moderate (maintenance of sensor network) |
| Weather Dependency | Low (can penetrate some cloud cover) | High (cannot fly in bad weather) | Low (but sensors can be damaged in extreme conditions) |
For developers interested in integrating NDVI data into their own applications, Farmonaut offers a robust API. You can find more information in the Farmonaut Satellite Weather API Developer Docs.
NDVI Imaging Techniques and Resolution
NDVI imaging can be performed using various platforms, each with its own advantages and limitations:
1. Satellite-based NDVI Imaging
Satellites like Landsat, Sentinel-2, and MODIS provide regular NDVI data for the entire globe. The NDVI resolution for satellite imagery can range from 10 meters (Sentinel-2) to 250 meters (MODIS), making it suitable for monitoring large areas.
2. Drone-based NDVI Imaging
Drones equipped with multispectral cameras can capture very high-resolution NDVI images (centimeter-level) but are limited in coverage area.
3. Aircraft-based NDVI Imaging
Manned aircraft can cover larger areas than drones with high-resolution sensors, offering a middle ground between satellite and drone imaging.
Advanced NDVI Concepts: Saturation and Limitations
While NDVI is a powerful tool, it’s important to understand its limitations and advanced concepts:
NDVI Saturation
NDVI saturation occurs when the index reaches its maximum value (usually around 0.9) even though the vegetation density or health may still be increasing. This is particularly common in dense forests or highly productive agricultural areas.
Atmospheric Effects
Atmospheric conditions, such as clouds, haze, or aerosols, can affect NDVI values. Advanced atmospheric correction techniques are often employed to mitigate these effects.
Seasonal Variations
NDVI values naturally fluctuate with seasons, especially in temperate regions. It’s crucial to consider these seasonal patterns when interpreting NDVI data over time.
The Future of NDVI: Emerging Trends and Technologies
As technology advances, so does our ability to utilize NDVI more effectively:
- Integration with AI and Machine Learning: Enhancing NDVI interpretation and prediction capabilities
- Hyperspectral Imaging: Providing more detailed spectral information beyond traditional NDVI
- Fusion with Other Data Sources: Combining NDVI with soil moisture, temperature, and other environmental data for more comprehensive analysis
- Real-time NDVI Monitoring: Leveraging advancements in satellite technology and data processing for near-real-time vegetation health assessment
Conclusion: The Power of NDVI in Modern Agriculture and Environmental Management
NDVI has proven to be an indispensable tool in our quest to understand and manage vegetation health on a global scale. From helping farmers optimize their crop yields to assisting researchers in tracking global environmental changes, NDVI continues to play a crucial role in various fields.
As we move forward, the integration of NDVI with other advanced technologies promises to provide even more powerful insights, helping us address the challenges of food security, climate change, and sustainable land management.
For those looking to harness the power of NDVI in their agricultural operations, Farmonaut offers a comprehensive suite of tools and services. Our satellite-based monitoring system provides regular, high-resolution NDVI maps, allowing for timely and informed decision-making. To learn more about how Farmonaut can help you leverage NDVI for your farming needs, visit our application page.
FAQ: Frequently Asked Questions about NDVI
Q1: What does NDVI mean in English?
A: NDVI stands for Normalized Difference Vegetation Index. It’s a standardized index that allows us to generate an image displaying vegetation greenness (relative biomass).
Q2: How is NDVI calculated?
A: NDVI is calculated using the formula: NDVI = (NIR – RED) / (NIR + RED), where NIR is the reflectance in the near-infrared band and RED is the reflectance in the red band.
Q3: What are typical NDVI ranges?
A: NDVI values typically range from -1 to +1. Values below 0 usually indicate water or snow, 0-0.1 represents barren areas, 0.1-0.3 indicates shrubs and grasslands, and values above 0.3 indicate increasing levels of healthy vegetation.
Q4: How often should NDVI images be taken for agricultural purposes?
A: The frequency depends on the crop and growing conditions, but generally, weekly or bi-weekly NDVI images during the growing season can provide valuable insights for most agricultural applications.
Q5: Can NDVI detect plant diseases?
A: While NDVI can’t directly identify specific diseases, it can detect changes in plant health that may be caused by diseases. Sudden drops in NDVI values can indicate stress or disease in plants.
Q6: What’s the difference between NDVI and other vegetation indices?
A: NDVI is one of many vegetation indices. Others, like EVI (Enhanced Vegetation Index) or SAVI (Soil-Adjusted Vegetation Index), are designed to overcome some limitations of NDVI, such as saturation in dense vegetation or soil background effects.
Q7: How accurate is NDVI for crop yield prediction?
A: NDVI can be a good indicator of potential crop yield, especially when combined with other data sources. However, its accuracy can vary depending on the crop type, growth stage, and environmental conditions.
Q8: Can NDVI be used for indoor farming?
A: While traditional satellite-based NDVI isn’t suitable for indoor farming, similar principles can be applied using specialized sensors designed for indoor use to monitor plant health in controlled environments.
For more information on how to utilize NDVI and other advanced agricultural technologies in your farming operations, consider subscribing to Farmonaut’s services:
By leveraging the power of NDVI and Farmonaut’s advanced satellite monitoring system, you can take your agricultural practices to the next level, optimizing crop health, reducing resource waste, and maximizing yields. Join us in revolutionizing agriculture through technology!
