NDVI Explained: Understanding Bands, Measurements, and Significance in Remote Sensing
In the rapidly evolving world of precision agriculture and remote sensing, one term that consistently stands out is NDVI. As experts in agricultural technology and satellite-based farm management solutions, we at Farmonaut are often asked about the intricacies of NDVI and its significance in modern farming practices. In this comprehensive blog post, we’ll delve deep into the world of NDVI, exploring its components, measurements, and applications in agriculture and beyond.
Table of Contents
- What Does NDVI Stand For?
- Understanding the Bands Used in NDVI
- What Does NDVI Measure?
- The Science Behind NDVI
- Applications of NDVI in Agriculture
- NDVI and Farmonaut’s Satellite-Based Solutions
- Comparing Satellite, Drone, and IoT-Based Monitoring
- Challenges and Limitations of NDVI
- Future Trends in NDVI and Remote Sensing
- FAQ Section
1. What Does NDVI Stand For?
NDVI is an acronym that stands for Normalized Difference Vegetation Index. This index is a simple but powerful indicator used to analyze remote sensing measurements, typically from satellite imagery, to assess whether the observed target contains live green vegetation or not.
The concept of NDVI was first introduced in 1973 by Rouse et al. and has since become one of the most widely used vegetation indices in remote sensing applications. Its popularity stems from its simplicity, effectiveness, and the wealth of information it provides about vegetation health and density.
2. Understanding the Bands Used in NDVI
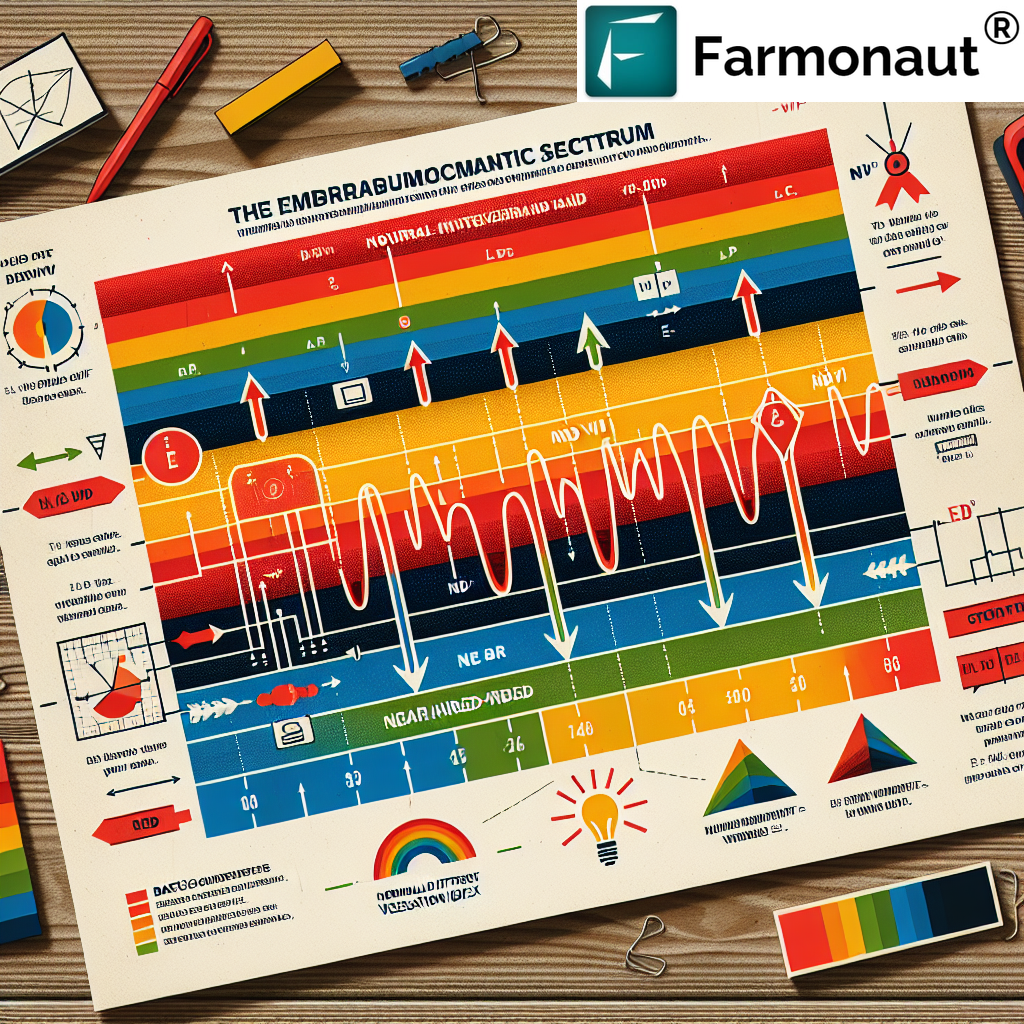
One of the most common questions we encounter is, “What bands does NDVI use?” To answer this, we need to understand a bit about the electromagnetic spectrum and how plants interact with different wavelengths of light.
NDVI utilizes two specific bands of the electromagnetic spectrum:
- Red Band: This band typically covers wavelengths between 620-670 nanometers.
- Near-Infrared (NIR) Band: This band covers wavelengths between 841-876 nanometers.
The choice of these specific bands is not arbitrary. Plants have a unique spectral signature that sets them apart from other types of land cover:
- Healthy vegetation absorbs most of the visible light that hits it, especially in the red portion of the spectrum. This is because chlorophyll, the pigment responsible for photosynthesis, absorbs red light.
- On the other hand, plants reflect a large portion of near-infrared light. The cell structure of leaves strongly reflects near-infrared light.
This difference in absorption and reflection between the red and near-infrared bands forms the basis of NDVI calculations.
3. What Does NDVI Measure?
Now that we understand the bands used in NDVI, let’s explore what NDVI measures. In essence, NDVI quantifies vegetation by measuring the difference between near-infrared (which vegetation strongly reflects) and red light (which vegetation absorbs).
Specifically, NDVI measures:
- Vegetation Density: Higher NDVI values indicate denser vegetation.
- Plant Health: Healthier plants tend to have higher NDVI values.
- Biomass: NDVI can be used as a proxy for estimating biomass in an area.
- Photosynthetic Activity: Areas with higher photosynthetic activity will have higher NDVI values.
The NDVI scale ranges from -1 to 1, where:
- Negative values generally correspond to water
- Values close to zero (-0.1 to 0.1) generally correspond to barren areas of rock, sand, or snow
- Low, positive values (0.2 to 0.4) represent shrub and grassland
- High values (0.6 to 0.8) indicate temperate and tropical rainforests
It’s important to note that NDVI is a relative measure. The exact interpretation of NDVI values can vary depending on the region, season, and type of vegetation being studied.
4. The Science Behind NDVI
To fully appreciate NDVI, it’s crucial to understand the science behind it. The NDVI is calculated using the following formula:
NDVI = (NIR – RED) / (NIR + RED)
Where:
- NIR = reflection in the near-infrared spectrum
- RED = reflection in the red range of the spectrum
This formula takes advantage of the contrast between the strong absorption of red light by vegetation chlorophyll and the strong reflection of near-infrared radiation by plant tissues. Healthy vegetation absorbs most of the visible light that hits it and reflects a large portion of the near-infrared light. Unhealthy or sparse vegetation reflects more visible light and less near-infrared light.
The principle behind NDVI is based on the fact that chlorophyll absorbs red light for use in photosynthesis, while the cell structure of the leaves strongly reflects near-infrared light. When the plant becomes dehydrated, stressed, or diseased, the spongy layer of the leaf collapses, and the plant absorbs more of the near-infrared light, rather than reflecting it. Thus, observing how NIR changes compared to red light provides an accurate indication of the presence of chlorophyll, which correlates with plant health.
5. Applications of NDVI in Agriculture
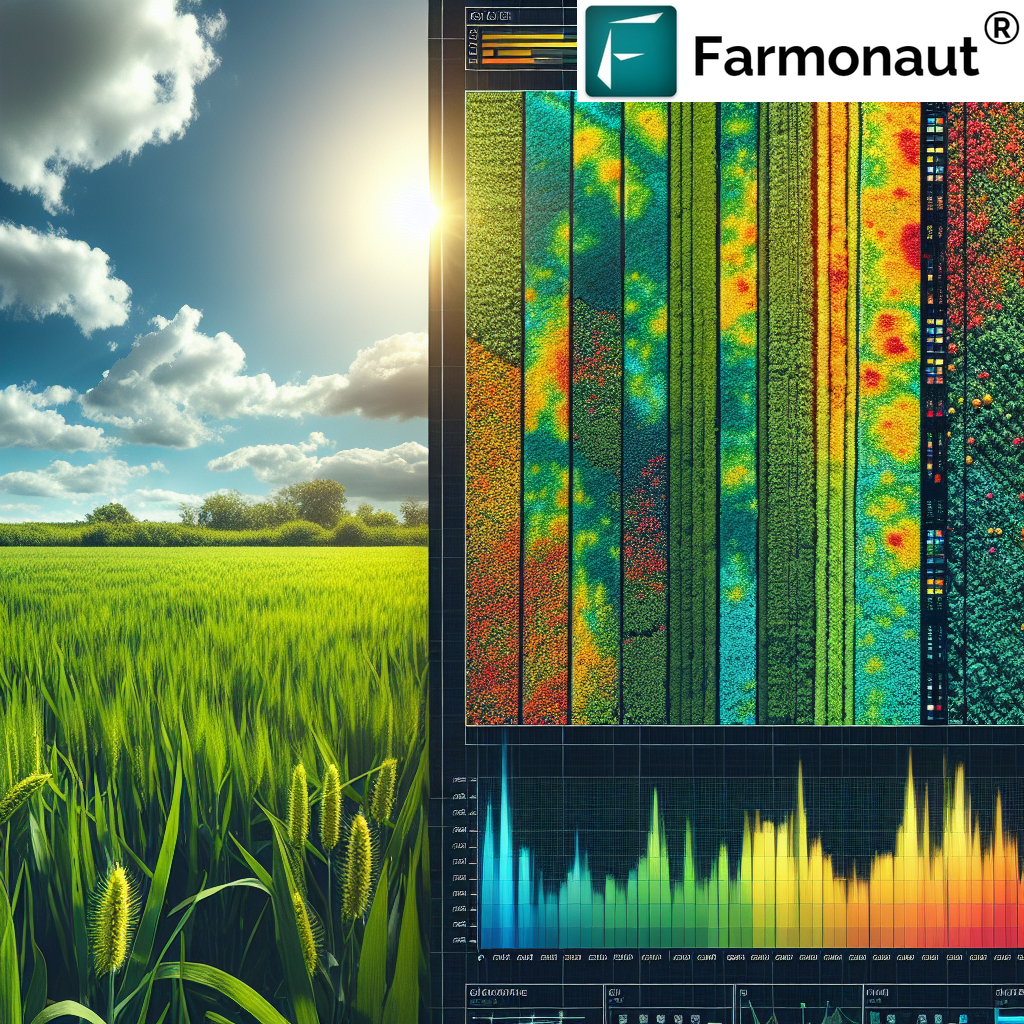
At Farmonaut, we leverage NDVI extensively in our satellite-based farm management solutions. The applications of NDVI in agriculture are numerous and significant:
- Crop Health Monitoring: NDVI helps farmers and agronomists assess the health of crops over large areas quickly and efficiently.
- Yield Prediction: By analyzing NDVI values over time, we can make predictions about potential crop yields.
- Drought Assessment: NDVI can indicate areas experiencing drought stress, allowing for targeted irrigation.
- Pest and Disease Detection: Sudden changes in NDVI can alert farmers to potential pest infestations or disease outbreaks.
- Fertilizer Management: NDVI maps can guide precision agriculture practices, ensuring fertilizers are applied where they’re most needed.
- Crop Type Identification: Different crops have distinct NDVI signatures, aiding in crop mapping and inventory.
These applications have revolutionized modern farming practices, enabling more efficient resource use and improved crop management strategies.
6. NDVI and Farmonaut’s Satellite-Based Solutions
At Farmonaut, we’ve integrated NDVI analysis into our suite of satellite-based farm management tools. Our platform provides farmers with regular NDVI updates, allowing them to track crop health and make data-driven decisions throughout the growing season.
Some key features of our NDVI-based solutions include:
- High-Resolution NDVI Maps: We provide detailed NDVI maps that allow farmers to pinpoint areas of concern within their fields.
- Historical NDVI Data: Our platform stores historical NDVI data, enabling farmers to compare current crop health with previous seasons.
- NDVI-Based Alerts: We’ve developed an alert system that notifies farmers of significant changes in NDVI values, potentially indicating crop stress or other issues.
- Integration with Other Data Sources: We combine NDVI data with weather information, soil data, and other relevant factors to provide comprehensive farm management insights.
To explore these features and more, visit our Farmonaut app or check out our API documentation for developers looking to integrate our satellite data into their own systems.
7. Comparing Satellite, Drone, and IoT-Based Monitoring
While NDVI can be calculated using various platforms, including satellites, drones, and ground-based sensors, each method has its advantages and limitations. At Farmonaut, we’ve chosen to focus on satellite-based monitoring due to its unique benefits. Here’s a comparison of these different approaches:
| Feature | Farmonaut Satellite System | Drone-based Monitoring | IoT-based Monitoring |
|---|---|---|---|
| Coverage Area | Large (Global) | Medium (Local) | Small (Field-level) |
| Frequency of Data Collection | Regular (Every few days) | On-demand | Continuous |
| Initial Setup Cost | Low | High | Medium |
| Maintenance Requirements | Low | High | Medium |
| Data Processing Complexity | Medium | High | Low |
| Scalability | High | Medium | Low |
| Weather Dependency | Medium | High | Low |
| Regulatory Constraints | Low | High | Medium |
As evident from the comparison, our satellite-based system offers a unique combination of wide coverage, regular data collection, low setup and maintenance costs, and high scalability. This makes it an ideal choice for farmers and agribusinesses looking to implement precision agriculture practices across large areas.
8. Challenges and Limitations of NDVI
While NDVI is a powerful tool, it’s important to understand its limitations:
- Saturation: NDVI can saturate in dense vegetation areas, making it less effective in distinguishing variations in very healthy or dense vegetation.
- Atmospheric Effects: Clouds, aerosols, and other atmospheric conditions can affect NDVI readings.
- Soil Background: In areas with sparse vegetation, soil reflectance can influence NDVI values.
- Temporal Resolution: The frequency of satellite passes can limit the ability to detect rapid changes in vegetation health.
- Species Differentiation: NDVI alone cannot always distinguish between different plant species.
At Farmonaut, we address these limitations by combining NDVI with other vegetation indices and data sources, providing a more comprehensive view of crop health and field conditions.
9. Future Trends in NDVI and Remote Sensing
The field of remote sensing and vegetation monitoring is rapidly evolving. Some exciting trends we’re watching include:
- Hyperspectral Imaging: This technology allows for the collection of data across hundreds of spectral bands, providing more detailed information than traditional multispectral sensors.
- Machine Learning and AI: Advanced algorithms are being developed to interpret NDVI and other remote sensing data more accurately and extract more meaningful insights.
- Integration with IoT: Combining satellite-based NDVI with ground-based IoT sensors is providing more comprehensive and accurate farm monitoring solutions.
- Increased Temporal Resolution: The launch of more satellites and constellations is improving the frequency of data collection, allowing for near-real-time monitoring.
At Farmonaut, we’re actively working on integrating these advancements into our platform to provide even more value to our users. Stay tuned to our Android and iOS apps for the latest updates.
10. FAQ Section
Q: What does NDVI stand for?
A: NDVI stands for Normalized Difference Vegetation Index. It’s a standardized index that allows us to generate an image displaying greenness (relative biomass) of vegetation.
Q: What bands does NDVI use?
A: NDVI uses two bands: the red band (typically 620-670 nm) and the near-infrared (NIR) band (typically 841-876 nm) of the electromagnetic spectrum.
Q: What does NDVI measure?
A: NDVI measures vegetation density, plant health, biomass, and photosynthetic activity. It quantifies vegetation by measuring the difference between near-infrared (which vegetation strongly reflects) and red light (which vegetation absorbs).
Q: How is NDVI calculated?
A: NDVI is calculated using the formula: NDVI = (NIR – RED) / (NIR + RED), where NIR is the reflection in the near-infrared spectrum and RED is the reflection in the red range of the spectrum.
Q: What are the typical NDVI values for different land covers?
A: Typical NDVI values range from -1 to 1, with negative values corresponding to water, values close to zero (-0.1 to 0.1) representing barren areas, low positive values (0.2 to 0.4) indicating shrub and grassland, and high values (0.6 to 0.8) representing dense vegetation like forests.
Q: How often is NDVI data updated in Farmonaut’s system?
A: The frequency of NDVI updates depends on satellite revisit times and cloud cover. Typically, we provide updates every 5-7 days, but this can vary based on specific location and weather conditions.
Q: Can NDVI detect specific crop diseases?
A: While NDVI can indicate general plant stress, it cannot identify specific diseases. However, sudden changes in NDVI values can alert farmers to potential issues that may require further investigation.
Q: How accurate is NDVI in predicting crop yields?
A: NDVI is a useful tool for yield prediction, but its accuracy can vary depending on factors like crop type, growth stage, and environmental conditions. It’s most effective when combined with other data sources and historical yield information.
Q: Can NDVI be used for all types of crops?
A: NDVI is useful for most types of crops, but its effectiveness can vary. It’s particularly good for detecting changes in leafy green vegetation but may be less effective for crops with different spectral signatures or growth patterns.
Q: How does Farmonaut ensure the accuracy of its NDVI data?
A: We use high-quality satellite imagery, advanced processing algorithms, and ground-truthing to ensure the accuracy of our NDVI data. We also continuously refine our methods based on user feedback and new research in the field.
Conclusion
NDVI has revolutionized the way we monitor and manage vegetation, particularly in agriculture. By understanding what NDVI stands for, the bands it uses, and what it measures, we can harness its power to improve crop yields, manage resources more efficiently, and promote sustainable farming practices.
At Farmonaut, we’re committed to making this powerful technology accessible to farmers and agribusinesses of all sizes. Our satellite-based solutions provide cost-effective, scalable, and reliable NDVI monitoring, enabling data-driven decision-making in agriculture.
We invite you to explore our solutions and see how NDVI and other advanced remote sensing technologies can transform your farming practices. Visit our API documentation to learn more about integrating our data into your systems, or download our app for Android or iOS to start monitoring your fields today.
Ready to take your farming to the next level with Farmonaut’s satellite-based solutions? Subscribe to our services using the form below:
Join us in revolutionizing agriculture through the power of satellite technology and data-driven insights!