NDVI Formula Explained: The Essential Guide to Calculating Vegetation Health
In the ever-evolving world of precision agriculture, understanding and utilizing advanced monitoring techniques is crucial for optimizing crop health and yield. At Farmonaut, we’re committed to bringing cutting-edge technology to farmers worldwide, and one of the most powerful tools in our arsenal is the Normalized Difference Vegetation Index (NDVI). In this comprehensive guide, we’ll delve deep into the NDVI formula, its applications, and how it’s revolutionizing modern farming practices.
What is NDVI?
NDVI, or Normalized Difference Vegetation Index, is a standardized index that allows us to generate an image displaying vegetation greenness (relative biomass). This index capitalizes on the contrast between red and near-infrared reflectance of vegetation, providing invaluable insights into plant health and vigor.
The Science Behind NDVI
Before we dive into the formula for NDVI, it’s essential to understand the scientific principles that make this index so effective:
- Chlorophyll, the pigment responsible for photosynthesis in plants, strongly absorbs visible light (from 0.4 to 0.7 µm) for use in photosynthesis.
- The cell structure of leaves, on the other hand, strongly reflects near-infrared light (from 0.7 to 1.1 µm).
- The more leaves a plant has, the more these wavelengths of light are affected, respectively.
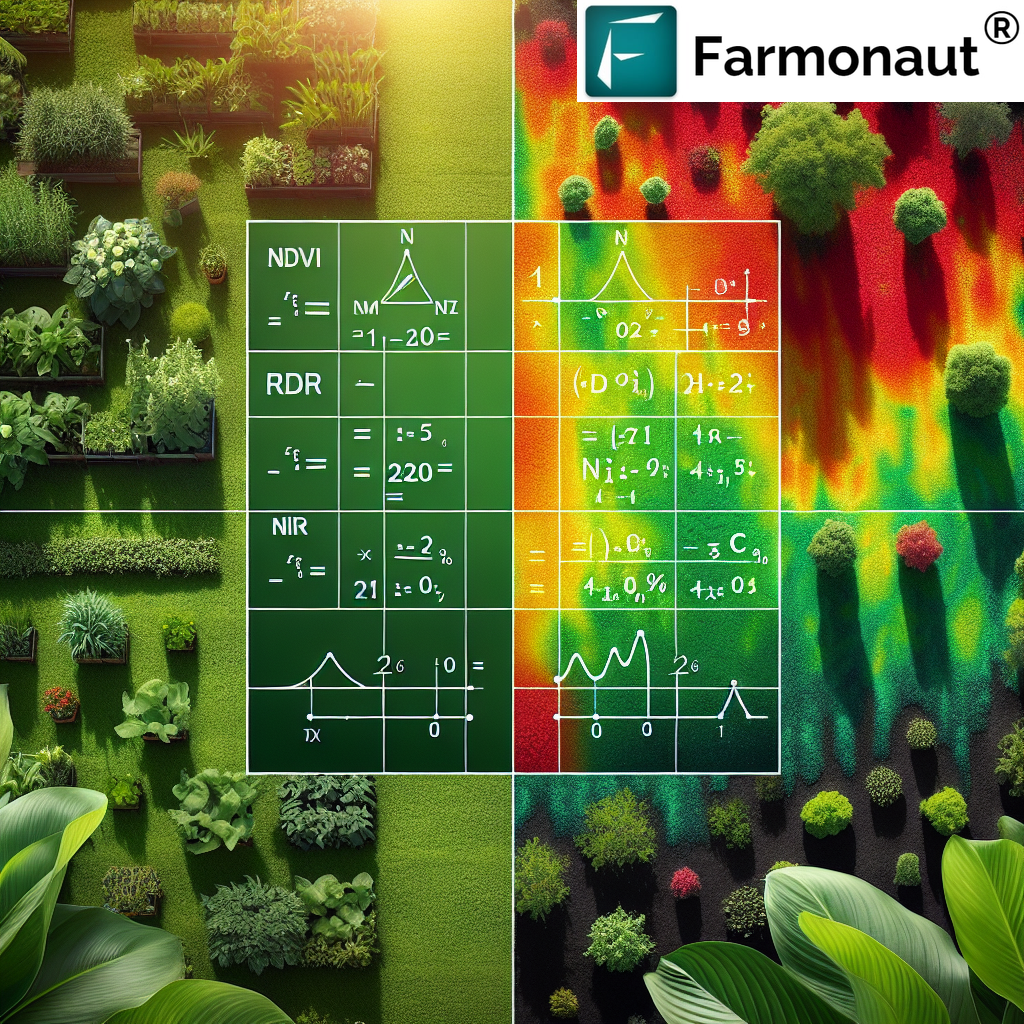
The NDVI Formula
Now, let’s explore the heart of our discussion: the NDVI formula. This simple yet powerful mathematical expression is the key to unlocking valuable information about vegetation health:
NDVI = (NIR – RED) / (NIR + RED)
Where:
- NIR = Near-infrared reflectance
- RED = Red reflectance
This formula ndvi produces values between -1.0 and +1.0. Generally, healthy vegetation will fall between values of 0.20 to 0.80.
Understanding NDVI Values
To interpret NDVI results effectively, it’s crucial to understand what different values represent:
- Negative values (< 0): Typically indicate water, ice, clouds, or snow
- Values close to zero (-0.1 to 0.1): Generally correspond to barren areas of rock, sand, or snow
- Low positive values (0.2 to 0.4): Represent shrub and grassland
- High values (0.6 to 0.8): Indicate temperate and tropical rainforests
Applications of NDVI in Agriculture
At Farmonaut, we harness the power of NDVI to provide farmers with invaluable insights. Here are some key applications:
- Crop Health Monitoring: NDVI helps identify areas of stress in crops before they’re visible to the naked eye.
- Yield Prediction: By analyzing NDVI data over time, we can make accurate predictions about crop yields.
- Irrigation Management: NDVI can indicate areas that may need more or less water, optimizing irrigation practices.
- Fertilizer Application: Areas with lower NDVI values may require additional nutrients, allowing for targeted fertilizer application.
- Pest and Disease Detection: Unusual changes in NDVI can signal the presence of pests or diseases, enabling early intervention.
How Farmonaut Leverages NDVI
At Farmonaut, we’ve integrated NDVI analysis into our comprehensive satellite-based farm management solutions. Here’s how we use this powerful tool to benefit farmers:
- Real-time Monitoring: Our platform provides up-to-date NDVI maps, allowing farmers to track crop health throughout the growing season.
- Historical Analysis: We store historical NDVI data, enabling farmers to compare current crop performance with previous seasons.
- AI-powered Insights: Our Jeevn AI advisory system incorporates NDVI data to provide personalized recommendations for crop management.
- Mobile Access: Farmers can access NDVI maps and insights on-the-go through our mobile apps, available for Android and iOS.
NDVI vs. Other Vegetation Indices
While NDVI is widely used and highly effective, it’s not the only vegetation index available. Let’s compare NDVI with some other common indices:
| Index | Formula | Advantages | Limitations |
|---|---|---|---|
| NDVI | (NIR – RED) / (NIR + RED) | Simple, widely used, good for general vegetation monitoring | Can saturate in dense vegetation |
| EVI (Enhanced Vegetation Index) | 2.5 * ((NIR – RED) / (NIR + 6 * RED – 7.5 * BLUE + 1)) | Better performance in high biomass regions | More complex calculation |
| SAVI (Soil-Adjusted Vegetation Index) | ((NIR – RED) / (NIR + RED + L)) * (1 + L) | Minimizes soil brightness influences | Requires determination of soil brightness correction factor (L) |
Farmonaut’s Satellite System vs. Drone and IoT-based Monitoring
While drones and IoT devices offer certain advantages in farm monitoring, Farmonaut’s satellite-based system provides unique benefits that make it superior in many aspects:
| Feature | Farmonaut Satellite System | Drone-based Monitoring | IoT-based Monitoring |
|---|---|---|---|
| Coverage Area | Large scale (entire farms at once) | Limited by flight time and regulations | Limited by number and placement of sensors |
| Frequency of Data Collection | Regular intervals (e.g., every 3-5 days) | As needed, but requires manual operation | Continuous, but for specific points only |
| Initial Setup Cost | Low (subscription-based) | High (equipment purchase) | Moderate to high (sensor deployment) |
| Operational Complexity | Low (automated data collection and analysis) | High (requires skilled operators) | Moderate (requires maintenance of sensors) |
| Weather Dependency | Low (can penetrate clouds with radar satellites) | High (limited by wind, rain, etc.) | Low (but sensors can be damaged in extreme conditions) |
| Data Processing | Automated with AI integration | Often requires manual processing | Automated but limited to sensor locations |
Challenges in NDVI Analysis
While NDVI is a powerful tool, it’s important to be aware of its limitations and challenges:
- Saturation: NDVI can saturate in areas with high biomass, making it less effective in very dense vegetation.
- Atmospheric Effects: Clouds, aerosols, and water vapor can affect NDVI readings.
- Soil Background: In areas with sparse vegetation, soil reflectance can influence NDVI values.
- Temporal Resolution: The frequency of satellite passes can limit the timeliness of NDVI data.
At Farmonaut, we address these challenges through advanced data processing techniques, multi-spectral analysis, and the integration of complementary data sources to provide the most accurate and actionable insights possible.
The Future of NDVI and Precision Agriculture
As technology continues to advance, we at Farmonaut are excited about the future possibilities for NDVI and precision agriculture:
- Higher Resolution Imagery: Improved satellite technology will allow for even more detailed NDVI maps.
- Integration with Machine Learning: Advanced AI algorithms will enhance the interpretation and application of NDVI data.
- Combination with Other Data Sources: Integrating NDVI with soil sensors, weather data, and other sources will provide a more comprehensive view of crop health.
- Real-time Analysis: Faster data processing and transmission will enable near real-time NDVI analysis and decision-making.
How to Get Started with Farmonaut’s NDVI Solutions
Ready to harness the power of NDVI for your farm? Here’s how you can get started with Farmonaut:
- Visit our web application or download our mobile app for Android or iOS.
- Sign up for an account and select your subscription plan.
- Define your farm boundaries using our intuitive mapping tools.
- Start receiving regular NDVI updates and insights for your fields.
- Explore our additional features, including weather forecasts, crop advisories, and more.
For developers and businesses looking to integrate our NDVI data into their own applications, we offer a robust API. Check out our API documentation to learn more.
Conclusion
The NDVI formula is more than just a mathematical equation; it’s a gateway to understanding and optimizing crop health on a level that was once unimaginable. At Farmonaut, we’re committed to making this powerful tool accessible to farmers of all sizes, empowering them to make data-driven decisions that increase yields, reduce resource waste, and promote sustainable farming practices.
By leveraging satellite technology, artificial intelligence, and our deep understanding of agricultural processes, we’re not just providing NDVI data – we’re offering a comprehensive solution that transforms how farms are managed in the 21st century.
Join us in revolutionizing agriculture. Explore our solutions, try our platform, and experience the difference that precision farming can make for your crops and your bottom line.
FAQs
Q: How often is NDVI data updated on the Farmonaut platform?
A: We typically provide NDVI updates every 3-5 days, depending on satellite availability and weather conditions.
Q: Can NDVI detect specific crop diseases?
A: While NDVI can indicate areas of plant stress that might be caused by diseases, it cannot identify specific diseases. However, it can alert farmers to potential issues early on, allowing for timely investigation and intervention.
Q: Is NDVI effective for all crop types?
A: NDVI is useful for most crop types, but its effectiveness can vary. It’s particularly good for leafy crops but may be less effective for crops with lower leaf area or unique growth patterns.
Q: How does cloud cover affect NDVI measurements?
A: Clouds can obstruct satellite views and affect NDVI measurements. At Farmonaut, we use advanced cloud-masking techniques and, when necessary, integrate data from multiple satellite passes to provide the most accurate NDVI maps possible.
Q: Can Farmonaut’s NDVI data be integrated with other farm management software?
A: Yes, we offer API access that allows for integration with various farm management systems. Check our API documentation for more details.
Q: How does Farmonaut ensure the accuracy of its NDVI data?
A: We use a combination of high-quality satellite imagery, advanced processing algorithms, and ground-truthing techniques to ensure the accuracy of our NDVI data. Our AI systems also continuously learn and improve based on feedback and real-world results.
Q: Is training required to interpret NDVI maps effectively?
A: While basic interpretation of NDVI maps is relatively straightforward, we provide resources and support to help our users get the most out of their data. Our AI-powered insights also help translate NDVI data into actionable recommendations.
Q: How does NDVI contribute to sustainable farming practices?
A: By providing precise information about crop health and stress, NDVI helps farmers optimize their use of water, fertilizers, and pesticides. This leads to more efficient resource use, reduced environmental impact, and more sustainable farming practices overall.
Ready to transform your farming practices with the power of NDVI and satellite technology? Subscribe to Farmonaut today and take the first step towards precision agriculture:
Join the Farmonaut community today and experience the future of farming!
