NDVI Imagery Explained: Revolutionizing Agriculture with Precision Insights
In the ever-evolving landscape of modern agriculture, precision farming techniques have become indispensable for maximizing crop yields, optimizing resource utilization, and ensuring sustainable practices. Among these innovative tools, NDVI imagery stands out as a game-changer, offering farmers and agronomists unprecedented insights into crop health and field conditions. At Farmonaut, we’re at the forefront of this agricultural revolution, harnessing the power of satellite technology to bring NDVI imagery and its benefits to farmers worldwide.
What is NDVI Imagery?
NDVI, which stands for Normalized Difference Vegetation Index, is a simple yet powerful indicator used to assess the health and vigor of vegetation from satellite imagery. But what is NDVI imagery exactly, and how does it work?
NDVI imagery is derived from multispectral satellite data, specifically focusing on the reflection of light in the near-infrared (NIR) and red portions of the electromagnetic spectrum. Healthy vegetation absorbs most of the visible light that hits it while reflecting a large portion of near-infrared light. In contrast, unhealthy or sparse vegetation reflects more visible light and less near-infrared light.
The NDVI is calculated using the following formula:
NDVI = (NIR – RED) / (NIR + RED)
Where:
- NIR = reflection in the near-infrared spectrum
- RED = reflection in the red range of the spectrum
This calculation results in a value between -1 and 1, where higher values indicate healthier vegetation.
The Significance of NDVI Imagery in Agriculture
NDVI imagery has become an invaluable tool in precision agriculture for several reasons:
- Crop Health Monitoring: NDVI provides a clear visual representation of crop health across entire fields, allowing farmers to quickly identify areas of stress or poor growth.
- Early Problem Detection: By regularly analyzing NDVI imagery, we can detect issues such as pest infestations, diseases, or nutrient deficiencies before they become visible to the naked eye.
- Precision Application of Inputs: Farmers can use NDVI maps to apply fertilizers, pesticides, and water more precisely, targeting only the areas that need them most.
- Yield Prediction: NDVI values correlate strongly with potential crop yields, helping farmers and agronomists make more accurate yield forecasts.
- Temporal Analysis: By comparing NDVI images over time, we can track crop development throughout the growing season and from year to year.
How Farmonaut Leverages NDVI Imagery
At Farmonaut, we’ve integrated advanced NDVI imagery analysis into our suite of precision agriculture tools. Our satellite-based crop health monitoring system provides farmers with regular NDVI updates, allowing them to make informed decisions about their crops throughout the growing season.
Here’s how we utilize NDVI imagery to benefit our users:
- Regular Field Scans: We provide frequent NDVI scans of your fields, giving you up-to-date information on crop health and development.
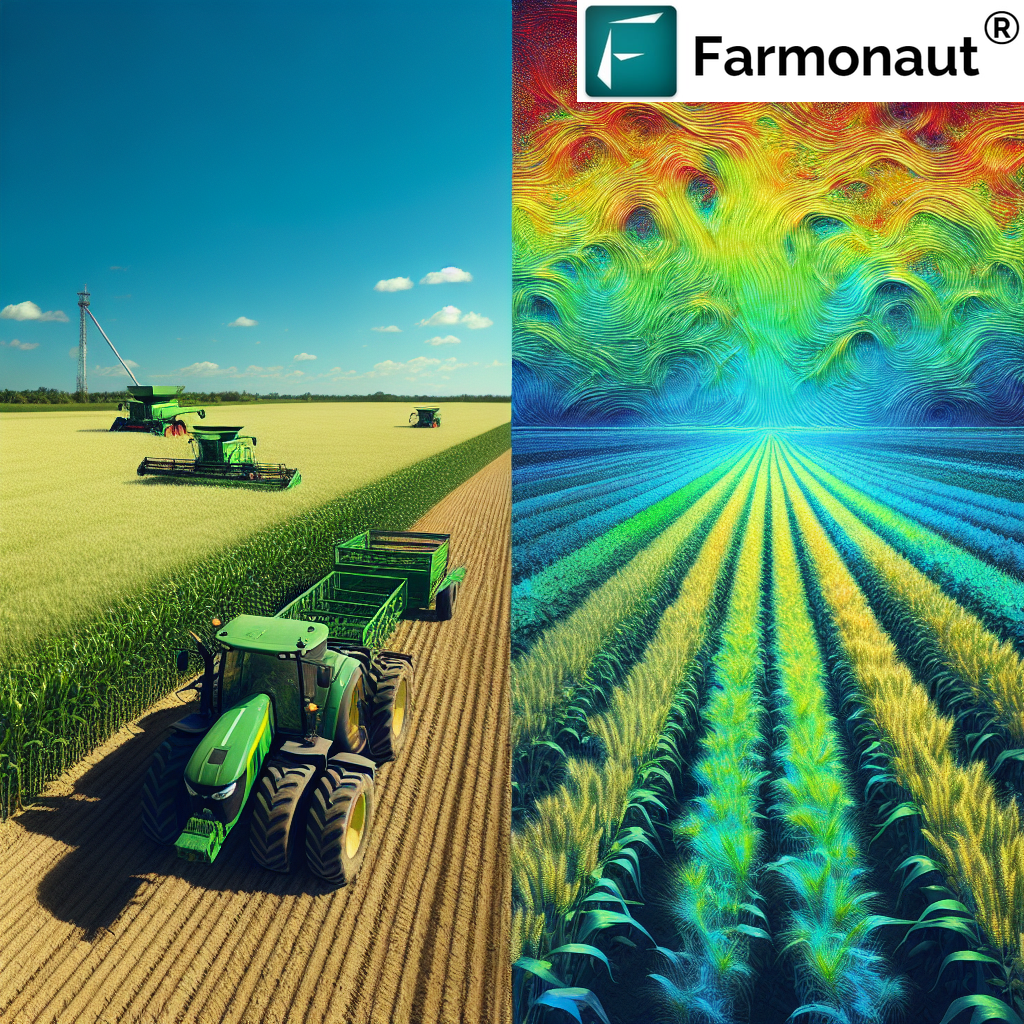
- Easy-to-Interpret Visualizations: Our platform translates complex NDVI data into easy-to-understand color-coded maps, making it simple for farmers to identify areas of concern.
- Historical Comparisons: We enable farmers to compare current NDVI readings with historical data, helping to identify trends and anomalies in crop performance.
- Integration with Other Data: We combine NDVI imagery with other data sources, such as weather information and soil moisture levels, to provide a comprehensive view of field conditions.
- Actionable Insights: Our AI-powered advisory system, Jeevn AI, uses NDVI data along with other inputs to generate personalized recommendations for crop management.
To experience the power of NDVI imagery and our other precision agriculture tools, sign up for Farmonaut today.
The Science Behind NDVI Imagery
To truly appreciate the value of NDVI imagery, it’s important to understand the science that makes it possible. NDVI is based on the principle that healthy vegetation absorbs most of the visible light that hits it and reflects a large portion of the near-infrared light. Unhealthy or sparse vegetation, on the other hand, reflects more visible light and less near-infrared light.
This difference in light absorption and reflection is due to the structure of plant leaves:
- Chlorophyll: This pigment in plant leaves strongly absorbs visible light (from 0.4 to 0.7 µm) for use in photosynthesis.
- Leaf Structure: The cell structure of leaves strongly reflects near-infrared light (from 0.7 to 1.1 µm).
By measuring these differences in reflection, we can create an index that quantifies vegetation health and density. The beauty of NDVI lies in its simplicity and effectiveness. It’s a normalized index, which means it helps compensate for effects like changing illumination conditions, surface slope, and viewing angle.
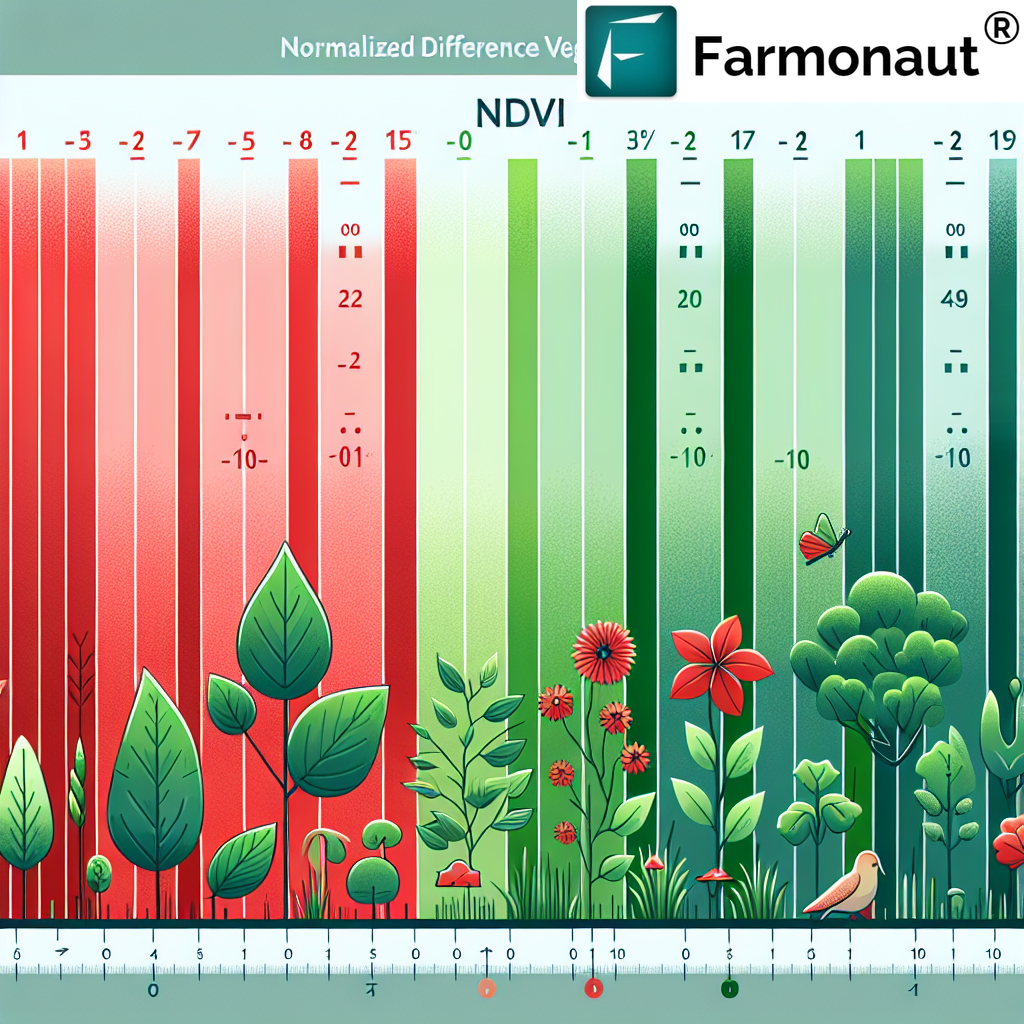
Interpreting NDVI Values
NDVI values range from -1 to 1, with different ranges indicating various types of ground cover:
- -1 to 0: Typically indicates water bodies, snow, or clouds
- 0 to 0.1: Barren areas of rock, sand, or snow
- 0.2 to 0.5: Sparse vegetation such as shrubs and grasslands
- 0.6 to 1.0: Dense vegetation like temperate and tropical rainforests
In agricultural contexts, we often focus on the higher end of the scale, with values above 0.6 generally indicating healthy crops. However, the exact interpretation can vary depending on the crop type, growth stage, and local conditions.
The Evolution of NDVI Technology
The concept of NDVI was first introduced in 1973 by Rouse et al. Initially, NDVI was primarily used in scientific research and large-scale environmental monitoring. However, with advancements in satellite technology and data processing capabilities, NDVI has become increasingly accessible and valuable for individual farmers and agronomists.
At Farmonaut, we’ve been at the forefront of this democratization of NDVI technology. By leveraging advanced satellite imagery and AI-powered analysis, we’ve made it possible for farmers of all scales to benefit from this powerful tool.
Beyond NDVI: Other Vegetation Indices
While NDVI is one of the most widely used vegetation indices, it’s not the only one. At Farmonaut, we also utilize other indices to provide a more comprehensive view of crop health and field conditions:
- Enhanced Vegetation Index (EVI): This index is optimized to enhance the vegetation signal with improved sensitivity in high biomass regions.
- Soil Adjusted Vegetation Index (SAVI): This index is designed to minimize soil brightness influences in areas with low vegetative cover.
- Normalized Difference Water Index (NDWI): This index is useful for monitoring changes in water content of leaves.
By combining these indices with NDVI, we can provide farmers with a more nuanced understanding of their crops and field conditions.
Practical Applications of NDVI Imagery in Agriculture
The applications of NDVI imagery in agriculture are vast and varied. Here are some of the key ways farmers and agronomists can leverage this technology:
1. Crop Health Monitoring
NDVI imagery allows for continuous monitoring of crop health throughout the growing season. By regularly analyzing NDVI maps, farmers can:
- Identify areas of stress or poor growth
- Detect early signs of pest infestations or diseases
- Monitor the effectiveness of different management practices
- Track crop development and maturity
2. Precision Fertilizer Application
By identifying areas of low NDVI values, farmers can target their fertilizer applications more precisely. This approach:
- Reduces overall fertilizer use
- Minimizes environmental impact
- Improves crop uniformity
- Increases cost-efficiency
3. Irrigation Management
NDVI can be used as an indicator of crop water stress. By monitoring NDVI values, farmers can:
- Optimize irrigation schedules
- Identify areas prone to water stress
- Improve water use efficiency
4. Yield Estimation and Forecasting
NDVI values have a strong correlation with potential crop yields. This allows farmers and agronomists to:
- Make more accurate yield predictions
- Identify high and low-performing areas within fields
- Plan harvesting operations more effectively
5. Crop Insurance and Damage Assessment
NDVI imagery can be used to assess crop damage from events like droughts, floods, or pest outbreaks. This can be valuable for:
- Documenting crop losses for insurance claims
- Assessing the effectiveness of recovery measures
- Planning future risk management strategies
NDVI Imagery: Farmonaut’s Approach
At Farmonaut, we’ve developed a comprehensive system for delivering NDVI insights to our users. Here’s how our approach sets us apart:
1. High-Frequency Updates
We provide regular NDVI updates throughout the growing season, allowing farmers to track changes in crop health in near real-time. This frequency of data enables quick responses to emerging issues.
2. User-Friendly Interface
Our platform presents NDVI data in an easy-to-understand format. Color-coded maps and intuitive visualizations make it simple for users to interpret the information and identify areas of concern.
3. Integration with Other Data Sources
We don’t just provide standalone NDVI imagery. Our system integrates NDVI data with other crucial information such as weather forecasts, soil moisture levels, and historical crop performance. This holistic approach provides a more comprehensive understanding of field conditions.
4. AI-Powered Insights
Our Jeevn AI advisory system uses NDVI data as one of its inputs to generate personalized recommendations for crop management. This AI-driven approach helps farmers translate raw data into actionable insights.
5. Historical Analysis
We enable users to compare current NDVI readings with historical data, helping to identify long-term trends and anomalies in crop performance.
6. Mobile Access
Our NDVI insights are accessible through both web and mobile applications, allowing farmers to monitor their crops from anywhere. Download our app for Android or iOS to get started.
The Advantages of Satellite-Based NDVI Imagery
While there are various methods for collecting NDVI data, including drones and ground-based sensors, satellite-based NDVI imagery offers several unique advantages:
| Feature | Farmonaut Satellite System | Drone-based Monitoring | IoT-based Monitoring |
|---|---|---|---|
| Coverage Area | Large scale (Global) | Limited (Local) | Very Limited (Point-based) |
| Frequency of Updates | High (Daily to weekly) | Moderate (On-demand) | High (Continuous) |
| Initial Setup Cost | Low | High | Moderate to High |
| Operational Complexity | Low | High | Moderate |
| Data Processing | Automated | Manual or Semi-automated | Automated |
| Scalability | High | Low | Moderate |
| Weather Dependency | Low | High | Low |
Challenges and Limitations of NDVI Imagery
While NDVI imagery is a powerful tool, it’s important to understand its limitations:
- Saturation: NDVI can saturate in dense vegetation, making it less effective for distinguishing between high levels of biomass.
- Atmospheric Effects: Clouds, haze, and atmospheric particles can interfere with NDVI readings.
- Soil Background: In areas with sparse vegetation, soil reflectance can influence NDVI values.
- Temporal Resolution: While satellite-based NDVI offers frequent updates, it may not capture rapid changes occurring between imaging dates.
At Farmonaut, we’re constantly working to address these limitations through advanced data processing techniques and by integrating NDVI with other data sources.
The Future of NDVI Imagery in Agriculture
As technology continues to advance, we anticipate several exciting developments in the field of NDVI imagery:
- Higher Resolution: Improvements in satellite technology will lead to even more detailed NDVI maps.
- Faster Processing: Advancements in AI and cloud computing will enable near real-time NDVI analysis.
- Integration with IoT: Combining satellite-based NDVI with ground-based sensors will provide an even more comprehensive view of crop health.
- Predictive Analytics: Machine learning models will use historical NDVI data to make more accurate predictions about crop development and yields.
At Farmonaut, we’re committed to staying at the forefront of these developments, continually enhancing our platform to provide the most advanced and useful tools to our users.
Getting Started with NDVI Imagery
Ready to harness the power of NDVI imagery for your farm? Here’s how you can get started with Farmonaut:
- Sign Up: Visit our registration page to create your Farmonaut account.
- Define Your Fields: Use our intuitive mapping tool to outline your fields.
- Access NDVI Data: Start receiving regular NDVI updates for your fields.
- Analyze and Act: Use our platform to interpret the NDVI data and make informed decisions about your crops.
- Integrate with Other Tools: Explore how NDVI data works alongside our other features like weather forecasting and AI-powered recommendations.
For developers interested in integrating our NDVI data into their own applications, check out our API documentation.
Frequently Asked Questions (FAQ)
1. What does NDVI stand for?
NDVI stands for Normalized Difference Vegetation Index. It’s a standardized index used to measure vegetation health and density using satellite imagery.
2. How often is NDVI imagery updated on Farmonaut?
Our NDVI imagery is typically updated every 3-5 days, depending on satellite availability and weather conditions.
3. Can NDVI imagery detect specific crop diseases?
While NDVI can’t identify specific diseases, it can detect areas of stress in crops which may be caused by diseases. This allows farmers to investigate these areas more closely.
4. Is NDVI imagery effective for all crop types?
NDVI is effective for most crop types, but its interpretation may vary depending on the specific crop and its growth stage. Our platform provides crop-specific insights to help with interpretation.
5. How does cloud cover affect NDVI imagery?
Cloud cover can obstruct satellite views, potentially affecting NDVI readings. However, our system uses advanced algorithms to minimize the impact of cloud cover and provide consistent data.
6. Can NDVI imagery help with irrigation management?
Yes, NDVI can indicate areas of water stress in crops, helping farmers optimize their irrigation practices.
7. How accurate are yield predictions based on NDVI?
While NDVI correlates strongly with potential yields, accuracy can vary based on factors like crop type and local conditions. We combine NDVI with other data sources to improve prediction accuracy.
8. Is specialized equipment needed to use Farmonaut’s NDVI imagery?
No, our satellite-based system doesn’t require any on-farm equipment. You can access all NDVI data through our web platform or mobile app.
9. How does Farmonaut’s NDVI imagery compare to drone-based solutions?
Our satellite-based NDVI offers wider coverage and more frequent updates than typical drone solutions, without the need for on-site equipment or operations.
10. Can NDVI imagery help with organic farming practices?
Yes, NDVI can be particularly valuable for organic farmers by helping to identify areas of stress early, allowing for timely intervention with organic management practices.
Conclusion
NDVI imagery has revolutionized the way we approach agriculture, providing unprecedented insights into crop health and field conditions. At Farmonaut, we’re proud to be at the forefront of this revolution, making advanced NDVI technology accessible to farmers of all scales.
By harnessing the power of satellite imagery, artificial intelligence, and our deep understanding of agricultural practices, we’re empowering farmers to make more informed decisions, optimize their resources, and ultimately, produce better crops more sustainably.
Ready to experience the power of NDVI imagery for yourself? Sign up for Farmonaut today and take the first step towards precision agriculture.
For more information about our API and developer resources, visit our API documentation page.
Join us in shaping the future of agriculture with NDVI imagery and precision farming techniques. Together, we can create a more sustainable and productive agricultural sector for generations to come.
