NDVI Index: Revolutionizing Vegetation Monitoring in Agriculture
In the ever-evolving world of agriculture, staying ahead of the curve is crucial for farmers and agribusinesses alike. At Farmonaut, we understand the importance of leveraging cutting-edge technology to enhance crop management and boost productivity. One of the most powerful tools in our arsenal is the NDVI index, a game-changing metric that has revolutionized how we monitor and assess vegetation health. In this comprehensive guide, we’ll dive deep into the world of NDVI, exploring its significance, applications, and how it’s transforming modern agriculture.
What is NDVI Index?
The NDVI index, or Normalized Difference Vegetation Index, is a standardized way to measure and assess the health and density of vegetation using remote sensing technology. But what exactly does this mean, and why is it so important for agriculture?
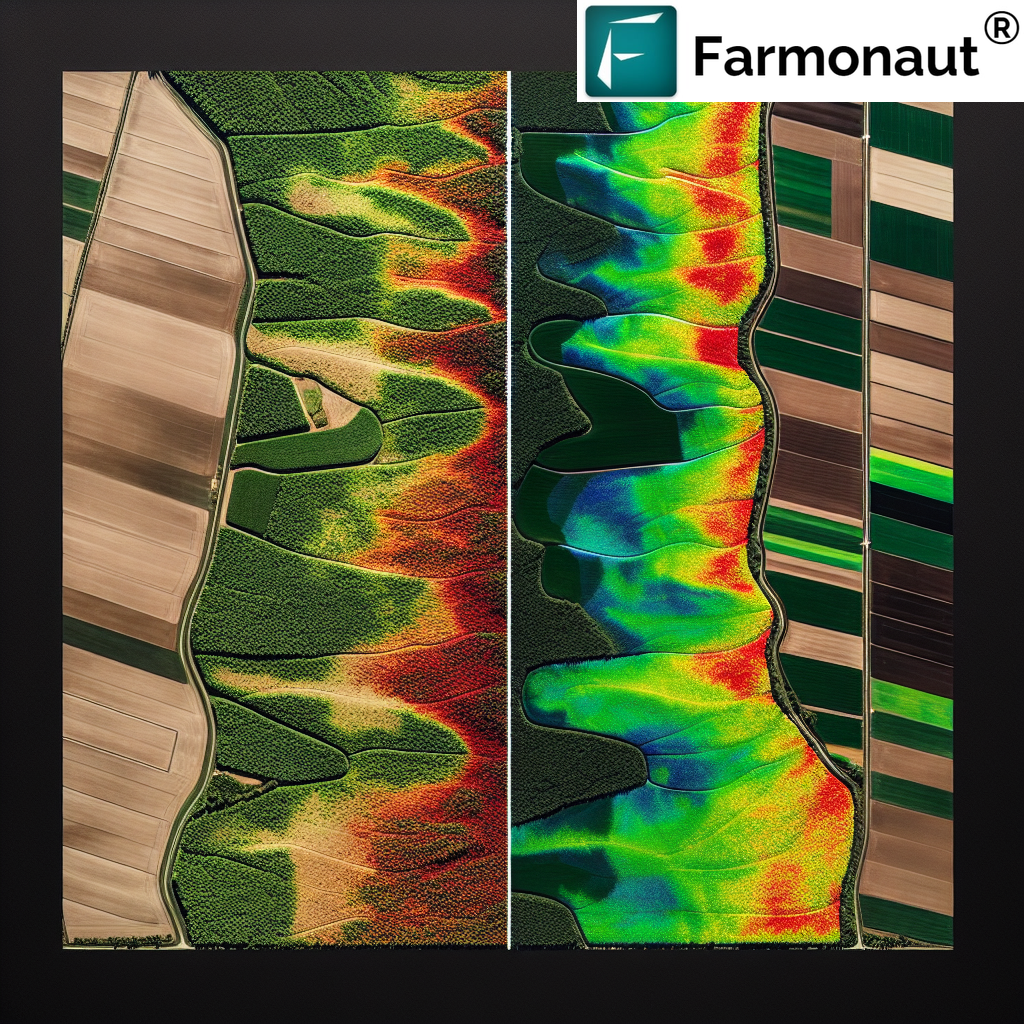
NDVI is calculated using the visible and near-infrared light reflected by vegetation. Healthy plants absorb most of the visible light that hits them and reflect a large portion of the near-infrared light. Unhealthy or sparse vegetation, on the other hand, reflects more visible light and less near-infrared light. By measuring these differences in reflectance, we can create a clear picture of vegetation health and density across large areas.
The Science Behind NDVI
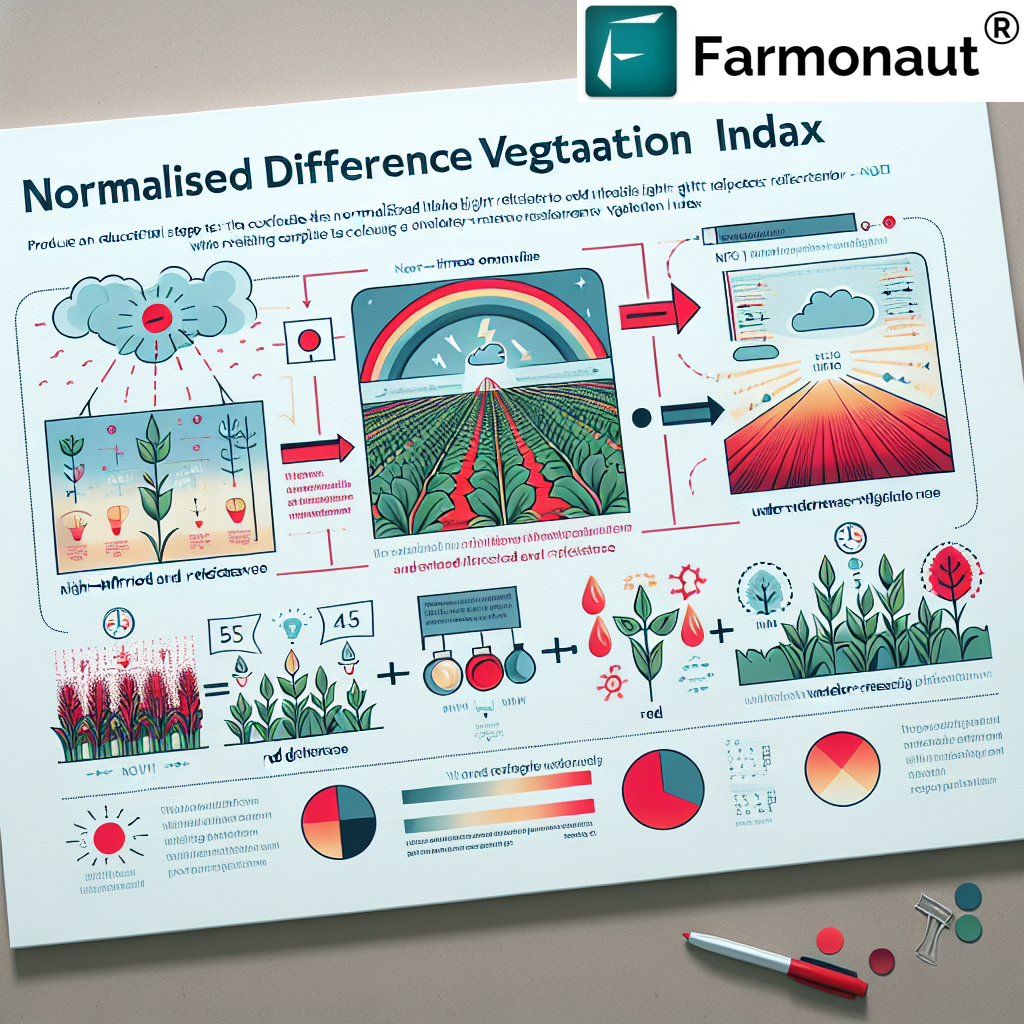
The NDVI vegetation index is calculated using the following formula:
NDVI = (NIR – RED) / (NIR + RED)
Where:
- NIR = reflection in the near-infrared spectrum
- RED = reflection in the red range of the spectrum
This formula yields a value between -1 and 1, where higher values indicate healthier and denser vegetation, while lower values suggest stressed or sparse vegetation.
Why NDVI Matters in Agriculture
The NDVI index has become an indispensable tool in modern agriculture for several reasons:
- Early Detection of Crop Stress: NDVI can reveal issues with crop health before they become visible to the naked eye, allowing farmers to take preventive action.
- Precision Agriculture: By providing detailed insights into field variability, NDVI enables targeted application of inputs like water, fertilizers, and pesticides.
- Yield Prediction: NDVI data collected over time can be used to forecast crop yields, helping farmers and agribusinesses make informed decisions.
- Resource Optimization: With accurate information on crop health, farmers can optimize their use of resources, reducing waste and improving sustainability.
- Large-Scale Monitoring: Satellite-based NDVI allows for the monitoring of vast areas, making it invaluable for large farms and regional agricultural planning.
How Farmonaut Leverages NDVI for Agricultural Success
At Farmonaut, we’ve integrated NDVI technology into our suite of farm management solutions, offering farmers and agribusinesses unprecedented insights into their crops. Here’s how we’re putting NDVI to work:
1. Satellite-Based Crop Health Monitoring
Our advanced satellite imagery technology captures high-resolution NDVI data, providing a comprehensive view of crop health across entire fields. This allows our users to:
- Identify problem areas quickly and efficiently
- Track crop development throughout the growing season
- Make data-driven decisions on irrigation, fertilization, and pest management
2. AI-Powered Analysis with Jeevn AI
Our proprietary Jeevn AI system takes NDVI data to the next level by combining it with other key metrics and historical data. This powerful tool:
- Provides personalized crop management recommendations
- Forecasts potential issues based on NDVI trends
- Offers actionable insights to optimize crop yields
3. Integration with Blockchain for Traceability
We’ve integrated NDVI data into our blockchain-based traceability solutions, allowing:
- Verification of sustainable farming practices
- Enhanced transparency in supply chains
- Support for quality assurance in food and textile industries
The Farmonaut Advantage: Satellite vs. Drone and IoT Monitoring
While there are various methods for farm monitoring, our satellite-based system offers significant advantages over drone and IoT-based solutions:
| Feature | Farmonaut Satellite System | Drone-based Monitoring | IoT-based Monitoring |
|---|---|---|---|
| Coverage Area | Vast (Global) | Limited (Local) | Very Limited (Point-based) |
| Frequency of Data | Regular (Every few days) | On-demand (Manual flights) | Continuous (But localized) |
| Initial Investment | Low | High (Drone purchase) | Medium to High (Sensors) |
| Operational Complexity | Low (Cloud-based) | High (Pilot needed) | Medium (Maintenance required) |
| Data Processing | Automated (AI-driven) | Manual or Semi-automated | Automated (Limited scope) |
| Scalability | Highly Scalable | Limited Scalability | Moderate Scalability |
Practical Applications of NDVI in Agriculture
The NDVI index has a wide range of applications in agriculture. Let’s explore some of the most impactful ways farmers and agribusinesses are using this technology:
1. Crop Health Assessment
NDVI provides a quick and accurate way to assess the overall health of crops across large areas. By analyzing NDVI maps, farmers can:
- Identify areas of stress or poor growth
- Detect pest infestations or disease outbreaks early
- Monitor the effectiveness of different crop management practices
2. Irrigation Management
Water stress is a critical factor in crop health, and NDVI can help optimize irrigation strategies:
- Detect areas of water stress before visible symptoms appear
- Guide precision irrigation systems for targeted water application
- Monitor the effectiveness of irrigation practices over time
3. Fertilizer Application
NDVI data can inform more efficient and targeted fertilizer application:
- Identify areas of nutrient deficiency
- Guide variable-rate fertilizer applications
- Reduce overall fertilizer use while maintaining or improving yields
4. Yield Forecasting
By analyzing NDVI trends throughout the growing season, farmers and agribusinesses can make more accurate yield predictions:
- Estimate potential yields early in the season
- Adjust management practices to optimize yield
- Plan for harvest and post-harvest operations more effectively
5. Crop Insurance and Risk Management
NDVI data is increasingly being used in the crop insurance industry:
- Verify crop conditions for insurance claims
- Assess and quantify crop damage from weather events or pests
- Provide objective data for dispute resolution
Interpreting NDVI Data: A Guide for Farmers
Understanding how to interpret NDVI data is crucial for making the most of this powerful tool. Here’s a basic guide to help farmers and agronomists make sense of NDVI readings:
- NDVI values below 0: Typically indicate water, bare soil, or artificial surfaces
- NDVI values 0.1 to 0.3: Suggest sparse vegetation, such as shrubs or grasslands
- NDVI values 0.3 to 0.6: Indicate moderate to good vegetation health, typical of many crops during growth
- NDVI values above 0.6: Suggest very healthy, dense vegetation
It’s important to note that these values can vary depending on the crop type, growth stage, and local conditions. At Farmonaut, our AI systems are trained to interpret NDVI data in the context of specific crops and regions, providing more accurate and actionable insights.
The Future of NDVI in Agriculture
As technology continues to advance, we at Farmonaut are excited about the future possibilities for NDVI and other remote sensing technologies in agriculture:
1. Integration with Machine Learning
By combining NDVI data with machine learning algorithms, we’re developing even more sophisticated prediction models for crop yield, disease outbreaks, and optimal harvest times.
2. Hyperspectral Imaging
While NDVI uses specific bands of light, hyperspectral imaging captures a much wider range of the electromagnetic spectrum. This could provide even more detailed insights into crop health and soil conditions.
3. Real-Time Decision Support
As satellite technology improves, we’re moving towards real-time NDVI monitoring, allowing for immediate response to changing crop conditions.
4. Integration with IoT and Precision Agriculture
By combining NDVI data with ground-based sensors and precision agriculture equipment, we’re creating holistic farm management systems that optimize every aspect of crop production.
How to Get Started with NDVI Monitoring
If you’re interested in leveraging NDVI technology for your farm or agribusiness, here’s how you can get started with Farmonaut:
- Sign Up: Visit our application page to create an account.
- Define Your Fields: Use our intuitive mapping tool to outline your fields.
- Access NDVI Data: Start receiving regular NDVI updates for your fields.
- Analyze and Act: Use our AI-powered insights to make informed decisions about your crops.
- Mobile Access: Download our mobile app for Android or iOS to access NDVI data on the go.
For developers and businesses looking to integrate NDVI data into their own systems, check out our API documentation and developer resources.
Conclusion: Embracing the Power of NDVI
The NDVI index has truly revolutionized the way we approach agriculture, offering unprecedented insights into crop health and enabling more sustainable, efficient farming practices. At Farmonaut, we’re committed to making this powerful technology accessible to farmers and agribusinesses of all sizes.
By embracing NDVI and other advanced agricultural technologies, we can work together to meet the growing global demand for food while preserving our precious natural resources. Whether you’re a small family farm or a large agricultural corporation, the power of NDVI is within your reach.
Ready to transform your approach to crop management? Join the Farmonaut community today and experience the future of agriculture.
FAQ: Common Questions About NDVI and Farmonaut
Q: How often is NDVI data updated in the Farmonaut system?
A: Our satellite-based system provides NDVI updates every 3-5 days, depending on cloud cover and satellite availability.
Q: Can NDVI detect specific crop diseases?
A: While NDVI can’t diagnose specific diseases, it can detect areas of stress in crops that may indicate disease presence. Our AI system combines NDVI data with other factors to provide more specific insights.
Q: Is NDVI effective for all crop types?
A: NDVI is useful for most vegetation types, but its effectiveness can vary. Our system is calibrated for a wide range of crops to provide the most accurate insights possible.
Q: How does weather affect NDVI readings?
A: Cloud cover can interfere with satellite-based NDVI measurements. Our system accounts for this by using multiple satellite sources and advanced cloud-filtering algorithms.
Q: Can Farmonaut’s NDVI system be integrated with my existing farm management software?
A: Yes, we offer API access that allows for integration with many popular farm management systems. Contact our support team for more information.
Subscribe to Farmonaut
Ready to harness the power of NDVI and other advanced agricultural technologies? Subscribe to Farmonaut today:
Join us in revolutionizing agriculture with cutting-edge technology and data-driven insights. Together, we can create a more sustainable and productive future for farming.