NDVI vs NDWI: Understanding Key Vegetation Indices for Precision Agriculture
In the ever-evolving world of precision agriculture, understanding and utilizing various vegetation indices has become crucial for farmers, agronomists, and agricultural researchers. At Farmonaut, we recognize the importance of these indices in providing valuable insights into crop health, water stress, and overall vegetation dynamics. In this comprehensive blog post, we’ll delve deep into two of the most important vegetation indices: NDVI (Normalized Difference Vegetation Index) and NDWI (Normalized Difference Water Index).
Table of Contents
- Introduction to Vegetation Indices
- Understanding NDVI
- Understanding NDWI
- NDVI vs NDWI: A Comparative Analysis
- Applications in Precision Agriculture
- How Farmonaut Utilizes NDVI and NDWI
- The Future of Vegetation Indices in Agriculture
- FAQs
1. Introduction to Vegetation Indices
Vegetation indices are mathematical combinations or transformations of spectral bands that accentuate vegetation properties. These indices exploit the unique reflectance patterns of vegetation in different parts of the electromagnetic spectrum. By analyzing these indices, we can gain valuable insights into various aspects of plant health, biomass, chlorophyll content, and water stress.
At Farmonaut, we leverage advanced satellite technology to capture and analyze these indices, providing farmers with actionable insights to optimize their crop management strategies. Our satellite-based crop health monitoring system uses multispectral imagery to calculate various vegetation indices, including NDVI and NDWI.
2. Understanding NDVI
The Normalized Difference Vegetation Index (NDVI) is one of the most widely used vegetation indices in remote sensing and precision agriculture. NDVI capitalizes on the fact that healthy vegetation strongly absorbs visible light (particularly red light) for photosynthesis while reflecting a large portion of near-infrared (NIR) light.
How NDVI Works
NDVI is calculated using the following formula:
NDVI = (NIR – Red) / (NIR + Red)
Where:
- NIR = reflectance in the near-infrared band
- Red = reflectance in the red band
The resulting NDVI values range from -1 to +1, where:
- Values close to +1 indicate dense, healthy vegetation
- Values around 0 typically represent bare soil or water
- Negative values often indicate clouds, snow, or water
Benefits of NDVI
- Excellent indicator of overall plant health and vigor
- Helps in estimating crop yield potential
- Useful for detecting vegetation changes over time
- Assists in identifying areas of stress or disease in crops
Limitations of NDVI
- Can saturate in areas with dense vegetation
- Sensitive to atmospheric conditions and soil background
- May not always accurately represent water stress in plants
3. Understanding NDWI
The Normalized Difference Water Index (NDWI) is another crucial vegetation index that focuses on the water content in vegetation and soil moisture. While NDVI primarily assesses overall plant health, NDWI is specifically designed to detect water stress and estimate vegetation water content.
How NDWI Works
There are several formulations of NDWI, but one of the most common is:
NDWI = (NIR – SWIR) / (NIR + SWIR)
Where:
- NIR = reflectance in the near-infrared band
- SWIR = reflectance in the short-wave infrared band
NDWI values typically range from -1 to +1, where:
- Higher positive values indicate higher vegetation water content
- Lower or negative values suggest water stress or dry conditions
Benefits of NDWI
- Excellent for detecting water stress in vegetation
- Helps in estimating vegetation water content
- Useful for monitoring drought conditions
- Can assist in irrigation management
Limitations of NDWI
- May be affected by soil background in areas with sparse vegetation
- Can be sensitive to atmospheric conditions
- Interpretation may vary depending on vegetation type and growth stage
4. NDVI vs NDWI: A Comparative Analysis
When it comes to precision agriculture, both NDVI and NDWI play crucial roles in providing valuable insights into crop health and water stress. Let’s compare these two indices to understand their strengths and use cases:
| Aspect | NDVI | NDWI |
|---|---|---|
| Primary Focus | Overall vegetation health and biomass | Vegetation water content and water stress |
| Spectral Bands Used | Near-Infrared and Red | Near-Infrared and Short-Wave Infrared |
| Sensitivity to Water Stress | Moderate | High |
| Sensitivity to Chlorophyll Content | High | Low |
| Use in Yield Estimation | Commonly used | Less common, but can be helpful |
| Drought Monitoring | Indirect indicator | Direct indicator |
| Irrigation Management | Useful, but less specific | Highly effective |
At Farmonaut, we recognize that both NDVI and NDWI offer unique and complementary insights. Our advanced satellite-based crop monitoring system utilizes both indices to provide a comprehensive view of crop health and water stress. This combination allows farmers to make more informed decisions about irrigation, fertilization, and overall crop management.
5. Applications in Precision Agriculture
The combined use of NDVI and NDWI in precision agriculture opens up a wide range of applications that can significantly improve farm management and crop yields. Here are some key applications:
Crop Health Monitoring
NDVI is excellent for assessing overall crop health and vigor. By regularly monitoring NDVI values, farmers can:
- Detect early signs of crop stress or disease
- Identify areas of poor growth or nutrient deficiencies
- Track crop development throughout the growing season
- Estimate potential yield
Water Stress Detection and Irrigation Management
NDWI shines in this area, providing crucial information about crop water content. Farmers can use NDWI to:
- Detect water stress before visible symptoms appear
- Optimize irrigation scheduling
- Identify areas prone to water stress within fields
- Monitor the effectiveness of irrigation practices
Variable Rate Application
By combining NDVI and NDWI data, farmers can implement precise variable rate applications of:
- Fertilizers
- Irrigation water
- Pesticides and herbicides
This targeted approach can lead to significant resource savings and improved crop performance.
Drought Monitoring and Management
NDWI is particularly useful for drought monitoring on a larger scale. Agricultural agencies and policymakers can use NDWI data to:
- Assess regional drought conditions
- Plan water resource allocation
- Implement timely drought mitigation strategies
Yield Forecasting
While NDVI is more commonly used for yield estimation, combining NDVI and NDWI can provide a more accurate picture. This combination can help:
- Improve yield prediction models
- Assess the impact of water stress on potential yield
- Plan harvesting and logistics more effectively
Crop Insurance and Risk Assessment
Both indices can be valuable tools for crop insurance providers and farmers in assessing risk:
- Verify crop conditions for insurance claims
- Assess the impact of weather events on crops
- Provide historical data for risk assessment
6. How Farmonaut Utilizes NDVI and NDWI
At Farmonaut, we’ve integrated both NDVI and NDWI into our advanced satellite-based crop monitoring system. Our platform leverages these indices to provide farmers with comprehensive insights into their crops’ health and water status. Here’s how we utilize these indices:
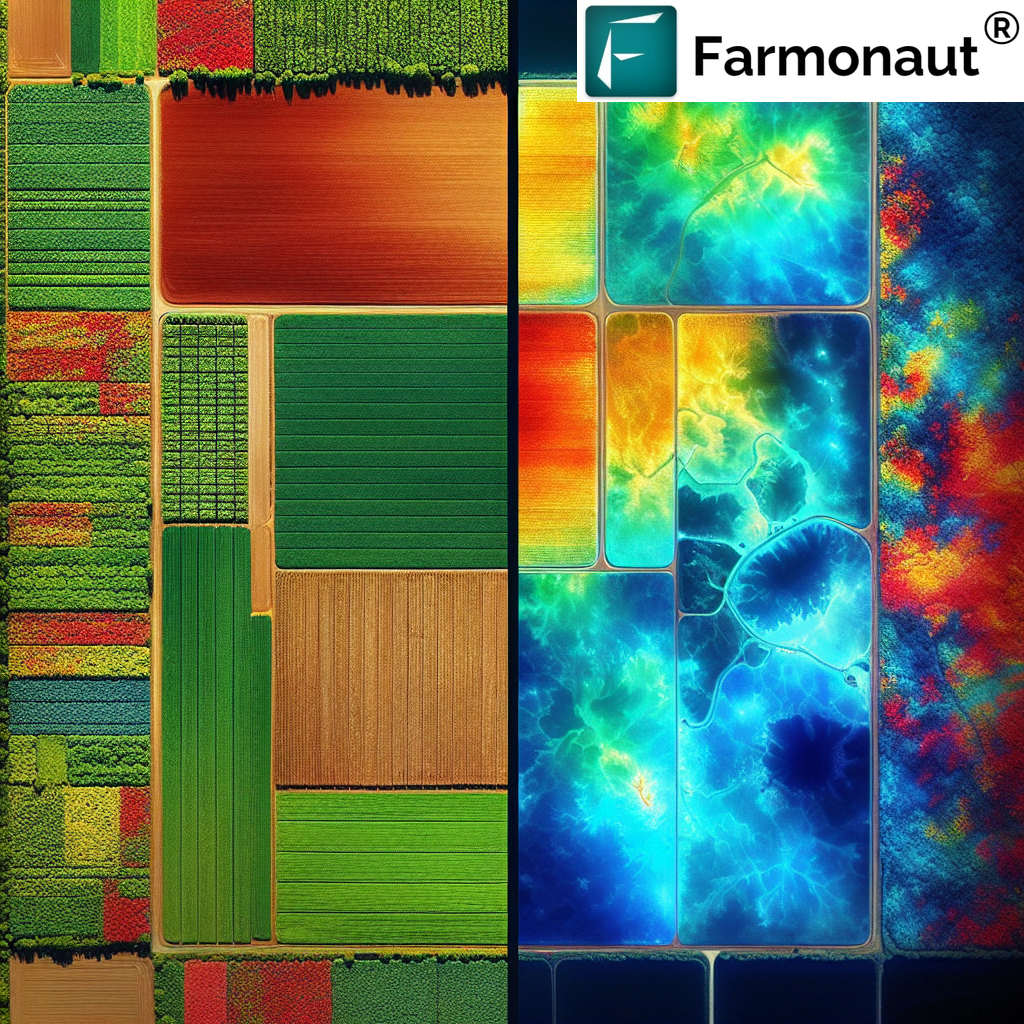
Satellite-Based Crop Health Monitoring
Our system uses high-resolution satellite imagery to calculate NDVI and NDWI values for entire fields. This allows farmers to:
- Get a bird’s-eye view of their crops’ health and water status
- Identify problem areas quickly and efficiently
- Track changes in crop health and water content over time
AI-Powered Analysis
Our Jeevn AI Advisory System analyzes NDVI and NDWI data along with other parameters to provide:
- Personalized crop management recommendations
- Early warnings for potential crop stress or disease
- Optimized irrigation schedules
Mobile App Integration
Farmers can access NDVI and NDWI maps and insights through our user-friendly mobile app, available on both Android and iOS platforms. This allows for:
- Real-time monitoring of crop health and water stress
- In-field decision-making support
- Easy sharing of information with agronomists or consultants
Historical Data Analysis
Our system stores historical NDVI and NDWI data, enabling farmers to:
- Compare current crop performance with previous seasons
- Identify long-term trends in field productivity
- Make informed decisions about crop rotation and field management
Integration with Other Farm Management Tools
Through our API, farmers can integrate NDVI and NDWI data with other farm management tools, allowing for:
- Seamless data flow between different agricultural technologies
- Enhanced decision-making capabilities
- More comprehensive farm management strategies
By leveraging both NDVI and NDWI, Farmonaut provides a more comprehensive and nuanced view of crop health and water stress than systems relying on a single index. This integrated approach empowers farmers to make more informed decisions, optimize resource use, and ultimately improve crop yields and farm profitability.
7. The Future of Vegetation Indices in Agriculture
As we look to the future, the role of vegetation indices like NDVI and NDWI in agriculture is set to expand and evolve. At Farmonaut, we’re at the forefront of these developments, constantly innovating to provide farmers with the most advanced and useful tools. Here’s our perspective on the future of vegetation indices in agriculture:
Integration with AI and Machine Learning
The combination of vegetation indices with artificial intelligence and machine learning algorithms will lead to:
- More accurate prediction models for crop yield and quality
- Automated detection of crop diseases and pests
- Personalized crop management recommendations tailored to specific field conditions
Higher Resolution and Frequency of Data
Advancements in satellite technology and data processing will enable:
- More frequent updates of NDVI and NDWI data, potentially daily or even multiple times per day
- Higher spatial resolution, allowing for more precise management of smaller areas within fields
- Better discrimination between crop types and growth stages
Development of New Indices
Research is ongoing to develop new vegetation indices that can provide even more specific information about crop health and stress. We anticipate:
- Indices tailored to specific crop types or growth stages
- Indices that can better distinguish between different types of stress (e.g., water stress vs. nutrient stress)
- Combination indices that leverage multiple spectral bands for more comprehensive analysis
Integration with IoT and Sensor Networks
The fusion of satellite-derived vegetation indices with ground-based sensor data will provide:
- More accurate and localized crop health assessments
- Real-time validation and calibration of satellite data
- Enhanced decision support for precision agriculture practices
Improved Climate Change Adaptation
Vegetation indices will play a crucial role in helping farmers adapt to climate change by:
- Monitoring long-term trends in crop health and water stress
- Assisting in the selection of crop varieties best suited to changing conditions
- Supporting the development of more resilient farming practices
Enhanced Carbon Sequestration Monitoring
As carbon markets develop, vegetation indices will be instrumental in:
- Quantifying carbon sequestration in agricultural lands
- Verifying the effectiveness of carbon-smart farming practices
- Supporting carbon credit programs for farmers
At Farmonaut, we’re committed to staying at the cutting edge of these developments. Our ongoing research and development efforts focus on integrating the latest advancements in vegetation index technology into our platform, ensuring that farmers have access to the most powerful and effective tools for precision agriculture.
8. FAQs
Q1: What is the main difference between NDVI and NDWI?
A1: The main difference lies in their focus. NDVI primarily assesses overall vegetation health and biomass, while NDWI specifically targets vegetation water content and water stress. NDVI uses red and near-infrared bands, whereas NDWI typically uses near-infrared and short-wave infrared bands.
Q2: Can NDVI and NDWI be used together?
A2: Absolutely! In fact, using NDVI and NDWI together provides a more comprehensive view of crop health. At Farmonaut, we integrate both indices to give farmers a fuller picture of their crops’ condition, combining insights on overall plant health and water stress.
Q3: How often should I monitor NDVI and NDWI for my crops?
A3: The frequency of monitoring depends on various factors, including crop type, growth stage, and local conditions. However, weekly or bi-weekly monitoring is often sufficient for most crops. With Farmonaut’s satellite-based system, you can access up-to-date NDVI and NDWI data as frequently as every 3-5 days, depending on your subscription plan.
Q4: Are NDVI and NDWI affected by cloud cover?
A4: Yes, cloud cover can affect the calculation of both NDVI and NDWI as it obstructs the satellite’s view of the Earth’s surface. However, at Farmonaut, we use advanced cloud detection and removal algorithms to minimize this impact and provide clear, usable data.
Q5: Can NDVI and NDWI be used for all crop types?
A5: While NDVI and NDWI are generally applicable to most crop types, their interpretation may vary depending on the specific crop and its growth stage. At Farmonaut, our AI system is trained on a wide variety of crops to provide accurate, crop-specific interpretations of these indices.
Q6: How does Farmonaut’s use of NDVI and NDWI compare to drone-based or IoT-based systems?
A6: While drone and IoT systems can provide high-resolution data, Farmonaut’s satellite-based system offers several advantages:
| Feature | Farmonaut Satellite System | Drone-based System | IoT-based System |
|---|---|---|---|
| Coverage Area | Entire fields and regions | Limited by flight time and regulations | Limited by sensor placement |
| Frequency of Data | Every 3-5 days | Dependent on manual flights | Continuous, but localized |
| Setup and Maintenance | No on-site equipment needed | Requires drone and pilot | Requires sensor installation and maintenance |
| Cost-effectiveness | High, especially for large areas | Moderate, increases with area | Variable, depends on number of sensors |
| Data Processing | Automated, cloud-based | Often requires manual processing | Automated, but may require calibration |
Q7: How can I start using Farmonaut’s NDVI and NDWI monitoring for my farm?
A7: Getting started with Farmonaut is easy! Simply visit our app page to sign up and download our mobile app. You can also explore our API options here if you’re interested in integrating our data into your existing farm management systems.
Ready to revolutionize your farming with advanced satellite-based crop monitoring? Subscribe to Farmonaut today!
By leveraging the power of NDVI and NDWI through Farmonaut’s advanced satellite-based system, you’re taking a significant step towards more efficient, productive, and sustainable farming. Join the precision agriculture revolution today!
