Understanding NDVI: A Comprehensive Guide to NDVI Range Values and Their Significance in Agriculture
In the ever-evolving world of precision agriculture, one metric stands out as a crucial indicator of crop health and vigor: the Normalized Difference Vegetation Index (NDVI). At Farmonaut, we recognize the immense value of NDVI in revolutionizing farming practices. In this comprehensive guide, we’ll delve deep into the NDVI range of values, exploring their significance and how they can be leveraged to enhance agricultural productivity.
What is NDVI?
Before we dive into the NDVI range values, let’s first understand what NDVI is and why it’s so important in agriculture.
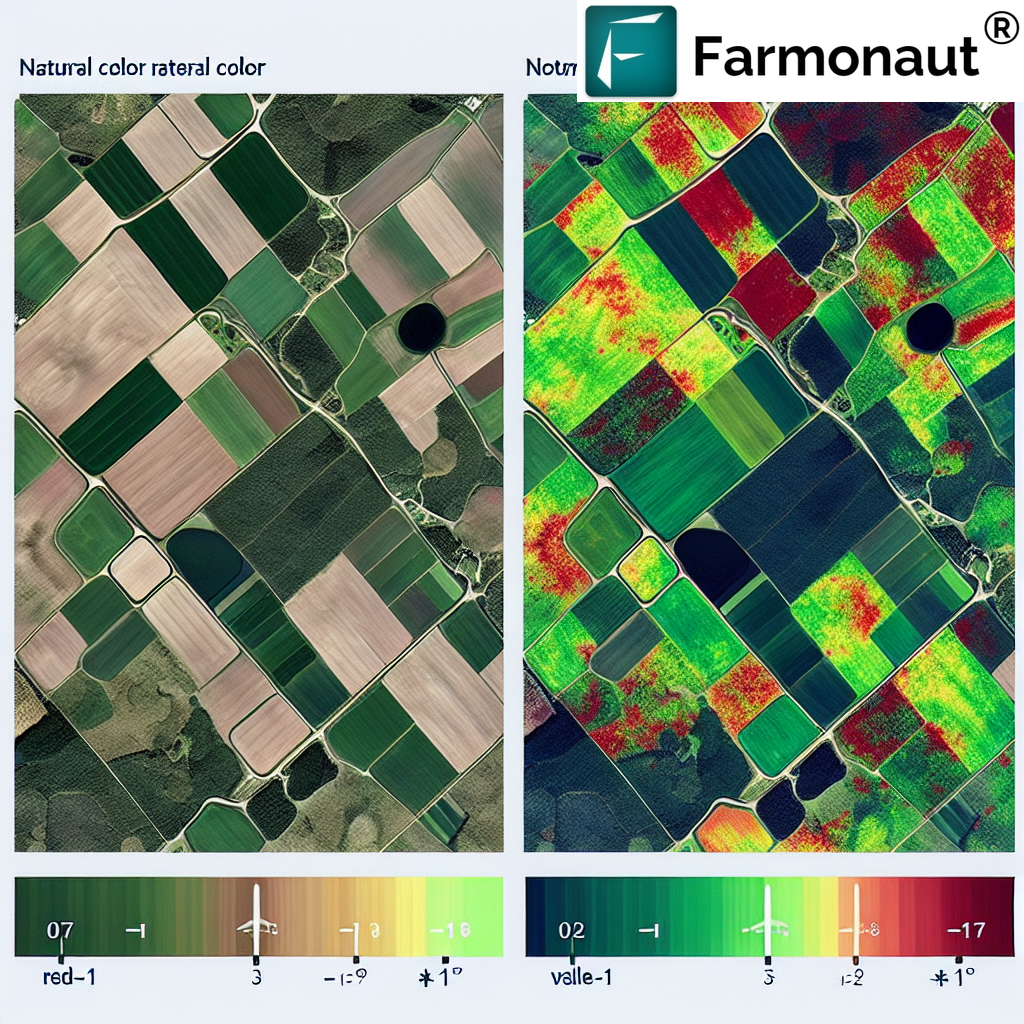
NDVI is a standardized index that allows us to generate an image displaying vegetation greenness (relative biomass). This index capitalizes on the contrast between red and near-infrared reflectance of vegetation. Healthy vegetation absorbs most of the visible light that hits it and reflects a large portion of the near-infrared light. Unhealthy or sparse vegetation reflects more visible light and less near-infrared light.
The NDVI Formula
The NDVI is calculated using the following formula:
NDVI = (NIR – RED) / (NIR + RED)
Where:
- NIR = Near-infrared reflectance
- RED = Red reflectance
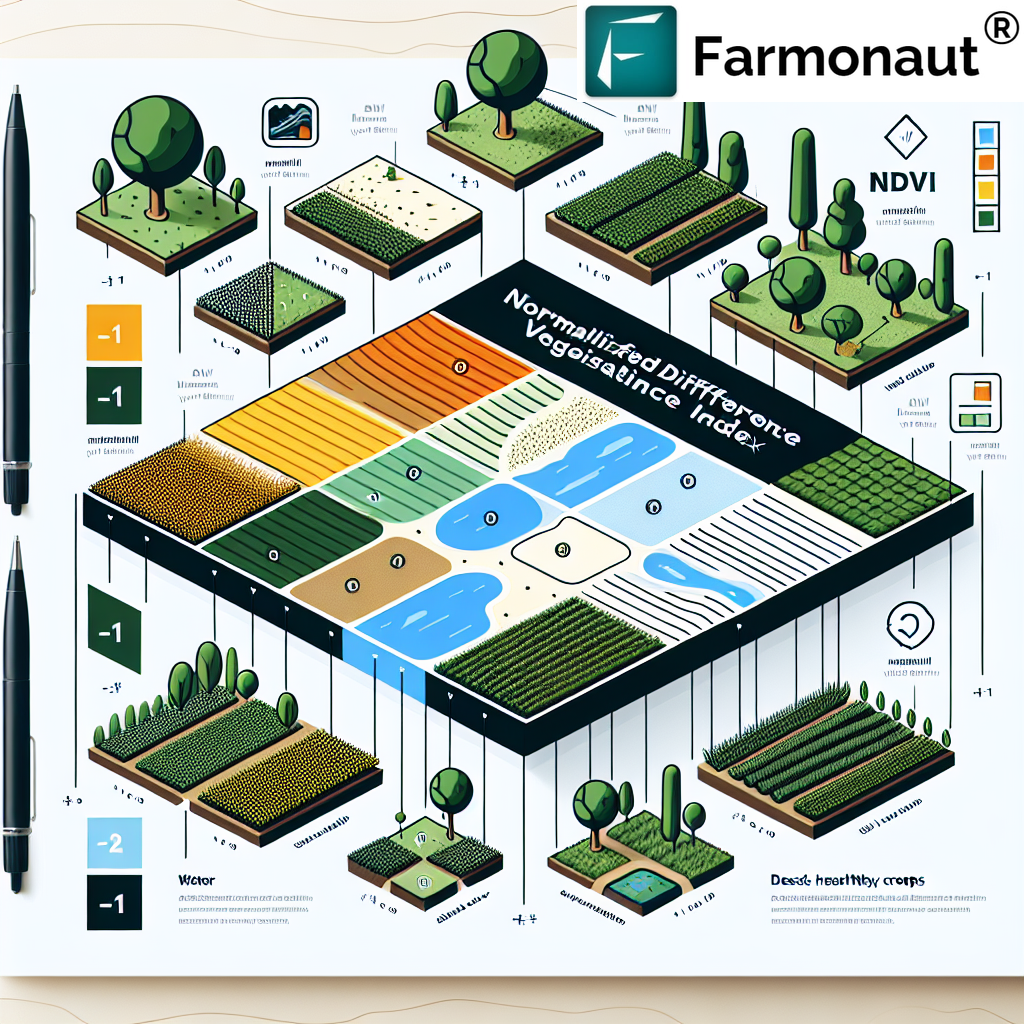
Understanding the NDVI Range of Values
The NDVI values range from -1 to +1. However, the practical range for green vegetation is typically between 0.1 and 0.9. Let’s break down what different values in this range signify:
- -1 to 0: These values typically represent non-vegetated areas such as water bodies, snow, ice, or bare soil.
- 0 to 0.1: This range often indicates barren areas of rock, sand, or snow.
- 0.1 to 0.3: These values represent sparse vegetation such as shrubs and grasslands.
- 0.3 to 0.6: This range indicates moderate vegetation, typical of temperate and tropical forests during the dry season.
- 0.6 to 0.8: These values represent dense vegetation found in temperate and tropical forests during the rainy season.
- 0.8 to 0.9: This range indicates very dense, healthy vegetation.
The Significance of NDVI Range Values in Agriculture
Understanding the NDVI range values is crucial for several reasons in agriculture:
1. Crop Health Monitoring
By tracking NDVI values over time, we can monitor crop health throughout the growing season. A sudden drop in NDVI could indicate stress factors such as pest infestation, disease, or water shortage.
2. Yield Prediction
NDVI values have a strong correlation with crop yield. Higher NDVI values generally indicate healthier plants and potentially higher yields.
3. Irrigation Management
NDVI can help in identifying areas of water stress in crops. Lower than expected NDVI values might indicate the need for irrigation.
4. Fertilizer Application
Areas with lower NDVI values might benefit from additional fertilizer application. This allows for targeted and efficient use of resources.
5. Pest and Disease Detection
Early detection of pests and diseases is possible through NDVI monitoring. Affected areas often show a decrease in NDVI values before visible symptoms appear.
How Farmonaut Leverages NDVI for Precision Agriculture
At Farmonaut, we’ve integrated advanced NDVI analysis into our satellite-based farm management solutions. Here’s how we use NDVI to benefit our users:
- Real-time Crop Health Monitoring: Our platform provides up-to-date NDVI maps, allowing farmers to track crop health across their fields continuously.
- AI-Powered Insights: Our Jeevn AI Advisory System analyzes NDVI data along with other parameters to provide personalized recommendations for crop management.
- Historical Analysis: We enable farmers to compare current NDVI values with historical data, helping identify trends and make informed decisions.
- Zonal Statistics: Our system calculates average NDVI values for different zones within a field, allowing for precise management of resources.
- Alert System: We’ve implemented an alert system that notifies farmers when NDVI values fall below certain thresholds, enabling quick response to potential issues.
To experience these features firsthand, you can try our app or explore our API services.
Farmonaut Satellite System vs. Drone and IoT-based Farm Monitoring
While drones and IoT devices have their place in modern agriculture, Farmonaut’s satellite-based system offers several unique advantages:
| Feature | Farmonaut Satellite System | Drone-based Monitoring | IoT-based Monitoring |
|---|---|---|---|
| Coverage Area | Large scale (thousands of hectares) | Limited (Few hundred hectares per flight) | Limited (Depends on sensor placement) |
| Frequency of Data Collection | Regular (Every few days) | On-demand (Requires manual flights) | Continuous (But limited to sensor locations) |
| Initial Setup Cost | Low | High (Drone purchase, training) | Medium to High (Sensor network setup) |
| Maintenance | Minimal (Cloud-based system) | High (Drone maintenance, battery replacement) | Medium (Sensor maintenance, battery replacement) |
| Weather Dependency | Low (Can penetrate light cloud cover) | High (Cannot fly in adverse weather) | Low (But may be affected by extreme conditions) |
| Data Processing | Automated (AI-powered analysis) | Often requires manual processing | Automated but limited to sensor data |
| Scalability | Highly scalable | Limited by flight time and regulations | Requires additional sensor deployment |
Interpreting NDVI Values: A Deeper Dive
While understanding the general NDVI range values is crucial, interpreting these values requires consideration of several factors:
1. Crop Type
Different crops have varying NDVI signatures. For example:
- Corn typically has higher NDVI values (0.7-0.9) during peak growth stages.
- Wheat might have lower NDVI values (0.4-0.7) even when healthy, especially in early growth stages.
2. Growth Stage
NDVI values change throughout the growing season:
- Early season: Lower NDVI values as plants are establishing.
- Mid-season: Peak NDVI values during maximum vegetative growth.
- Late season: Declining NDVI values as crops mature and dry.
3. Environmental Conditions
Factors like soil type, moisture levels, and recent weather events can influence NDVI values. For instance, a recent rainfall might temporarily boost NDVI values.
4. Time of Day
NDVI values can vary slightly depending on the time of day the imagery is captured, due to changes in sun angle and shadow effects.
Advanced Applications of NDVI in Precision Agriculture
At Farmonaut, we’re constantly exploring innovative ways to leverage NDVI data. Here are some advanced applications we’re developing:
1. Crop Classification
By analyzing NDVI patterns over time, we can distinguish between different crop types, aiding in large-scale crop mapping and yield estimation.
2. Biomass Estimation
NDVI has a strong correlation with biomass. We’re refining models to estimate crop biomass accurately using NDVI data, which is crucial for yield forecasting.
3. Drought Monitoring
By comparing current NDVI values with long-term averages, we can identify areas experiencing drought stress, allowing for timely interventions.
4. Biodiversity Assessment
In natural ecosystems, NDVI patterns can indicate biodiversity levels. We’re exploring how this can be applied to agroforestry and sustainable farming practices.
5. Carbon Sequestration Estimation
NDVI data can be used to estimate carbon sequestration in vegetation. We’re developing models to help farmers quantify their carbon footprint and potential carbon credits.
Challenges in NDVI Interpretation
While NDVI is a powerful tool, it’s important to be aware of its limitations:
- Saturation: NDVI can saturate in areas of dense vegetation, making it less sensitive to changes in very healthy crops.
- Atmospheric Effects: Cloud cover, haze, and atmospheric particles can affect NDVI calculations.
- Soil Background: In areas with sparse vegetation, soil reflectance can influence NDVI values.
- Mixed Pixels: In areas with diverse vegetation or at field edges, NDVI values may represent a mix of different surface types.
At Farmonaut, we employ advanced algorithms and multi-spectral analysis to mitigate these challenges, ensuring the most accurate and reliable NDVI data for our users.
The Future of NDVI in Agriculture
As technology advances, we anticipate several exciting developments in the use of NDVI for agriculture:
- Higher Resolution Imagery: Improved satellite technology will allow for even more detailed NDVI mapping.
- Integration with IoT: Combining satellite-based NDVI with ground-based IoT sensors will provide a more comprehensive view of crop health.
- AI-Powered Predictive Models: Advanced machine learning algorithms will enhance our ability to predict crop yields and detect issues based on NDVI patterns.
- Hyperspectral Analysis: Moving beyond traditional NDVI, hyperspectral imaging will allow for more nuanced vegetation analysis.
- Real-Time Decision Support: Faster data processing and delivery will enable near-real-time decision making based on NDVI insights.
How to Get Started with Farmonaut’s NDVI-Based Solutions
Ready to leverage the power of NDVI for your farming operations? Here’s how you can get started with Farmonaut:
- Download our app from the Google Play Store or the Apple App Store.
- Sign up for an account and input your field boundaries.
- Start receiving regular NDVI updates and insights for your fields.
- Explore our advanced features like AI-powered recommendations and historical analysis.
- For developers and businesses looking to integrate our NDVI data into their systems, check out our API documentation.
Frequently Asked Questions (FAQ)
Q: What does NDVI stand for?
A: NDVI stands for Normalized Difference Vegetation Index. It’s a standardized index used to measure vegetation health and density.
Q: What is the typical NDVI range for healthy vegetation?
A: The NDVI range for healthy vegetation typically falls between 0.6 and 0.9. However, this can vary depending on the crop type and growth stage.
Q: How often should I monitor NDVI values?
A: We recommend monitoring NDVI values at least weekly during the growing season. However, Farmonaut provides updates every few days, allowing for more frequent monitoring if desired.
Q: Can NDVI detect all types of crop stress?
A: While NDVI is excellent at detecting many types of crop stress, it’s not a catch-all solution. Some stresses might not immediately affect chlorophyll content or leaf structure, which NDVI measures. That’s why we combine NDVI with other indices and data sources for comprehensive crop monitoring.
Q: How accurate is NDVI-based yield prediction?
A: NDVI-based yield prediction can be quite accurate, especially when combined with other data sources and historical yield information. However, factors like sudden weather events or late-season stresses can affect final yields.
Q: Can Farmonaut’s NDVI monitoring replace field scouting?
A: While our NDVI monitoring is a powerful tool, we recommend using it in conjunction with field scouting. NDVI can help direct scouting efforts to areas of concern, making the process more efficient.
Q: How does cloud cover affect NDVI measurements?
A: Heavy cloud cover can interfere with satellite-based NDVI measurements. However, our system uses multiple satellite sources and advanced algorithms to minimize the impact of cloud cover on data availability.
Conclusion
Understanding and leveraging the NDVI range of values is crucial for modern, precision agriculture. At Farmonaut, we’re committed to making this powerful tool accessible and actionable for farmers of all scales. By combining satellite-based NDVI monitoring with AI-powered insights, we’re helping farmers optimize their operations, increase yields, and practice sustainable agriculture.
As we continue to innovate and expand our services, we invite you to join us on this journey towards smarter, more efficient farming. Whether you’re a small-scale farmer looking to optimize your operations or a large agribusiness seeking comprehensive farm management solutions, Farmonaut has the tools and expertise to help you succeed.
Ready to revolutionize your farming practices with NDVI-based insights? Subscribe to Farmonaut today and take the first step towards precision agriculture:
Join the Farmonaut community today and experience the future of agriculture!
