Understanding NDVI: From Negative Values to Positive Impact in Agriculture
In the ever-evolving world of precision agriculture, one metric stands out as a crucial indicator of crop health and vitality: the Normalized Difference Vegetation Index (NDVI). At Farmonaut, we recognize the immense value of NDVI in revolutionizing farming practices and enhancing agricultural productivity. In this comprehensive guide, we’ll delve deep into the meaning of NDVI, explore its significance in modern farming, and unravel the mysteries behind NDVI values, including the intriguing realm of NDVI negative values.
What is NDVI? Unraveling the NDVI Meaning
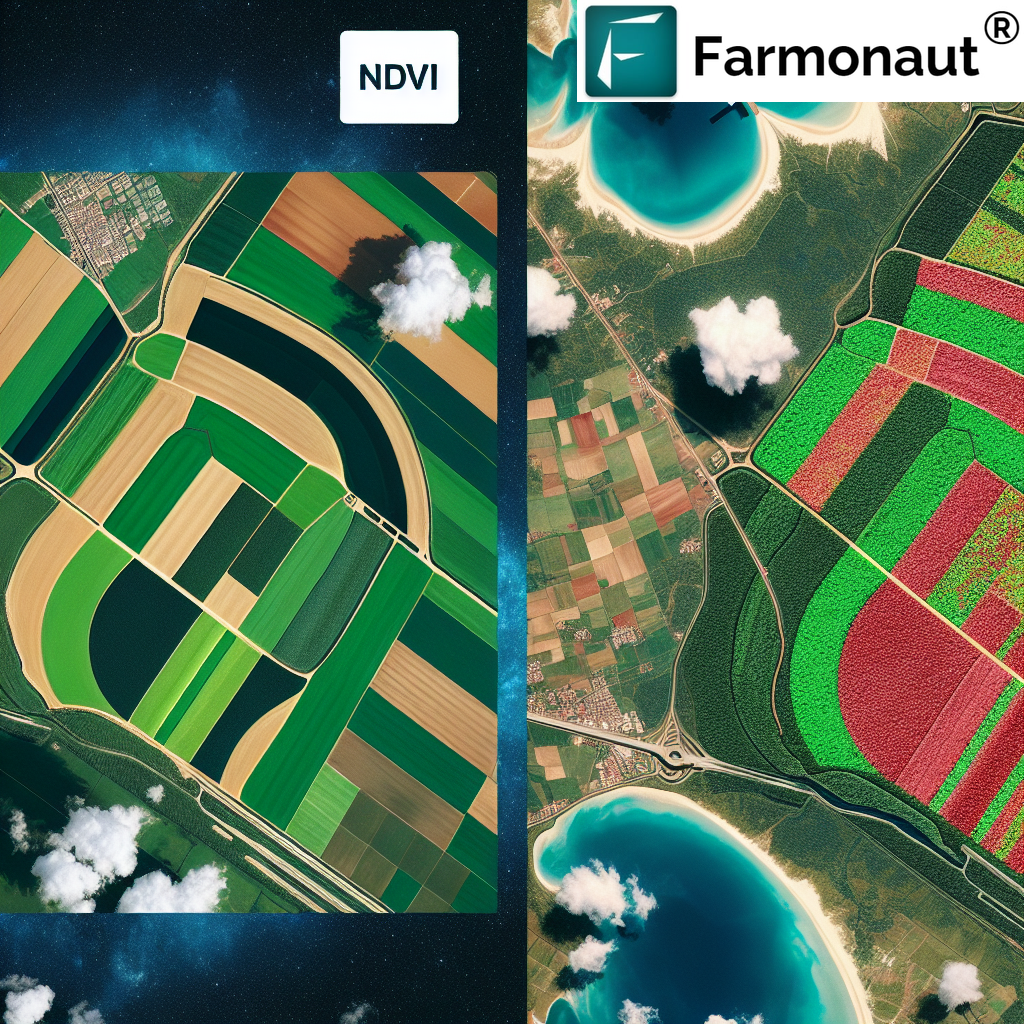
The Normalized Difference Vegetation Index (NDVI) is a simple yet powerful numerical indicator used to analyze remote sensing measurements, typically from satellite imagery, to assess whether the observed target contains live green vegetation. But what exactly does NDVI mean for farmers and agricultural professionals?
At its core, the NDVI meaning revolves around quantifying vegetation by measuring the difference between near-infrared (which vegetation strongly reflects) and red light (which vegetation absorbs). This difference is then normalized to create an index that ranges from -1 to 1.
- NDVI = (NIR – RED) / (NIR + RED)
- NIR: Near-Infrared reflectance
- RED: Red reflectance
Understanding the meaning of NDVI is crucial for modern farmers and agricultural professionals. It provides invaluable insights into crop health, biomass, leaf area index, and overall plant vigor. At Farmonaut, we harness the power of NDVI to offer our users precise, actionable data that can transform their farming practices.
Decoding NDVI Values: What Do They Really Mean?
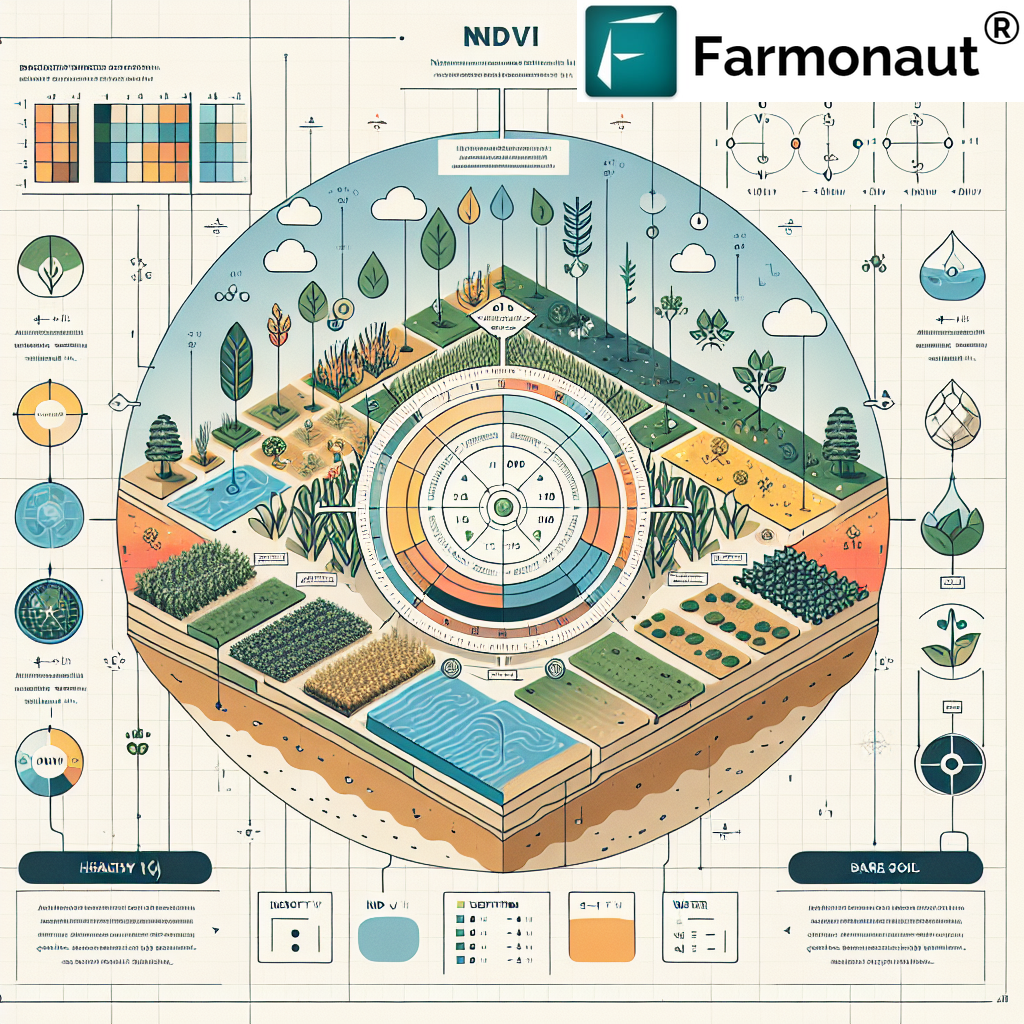
The interpretation of NDVI values is key to unlocking their potential in agriculture. Let’s break down what different NDVI ranges signify:
- -1 to 0: Non-vegetation areas (water, barren land, clouds, snow)
- 0 to 0.1: Rocks, sand, or snow
- 0.2 to 0.3: Shrubs and grassland
- 0.4 to 0.5: Moderate vegetation
- 0.6 to 0.8: Dense vegetation (forests, crops at peak health)
- 0.9 to 1: Very dense, healthy vegetation
Understanding these ranges is crucial for interpreting satellite imagery and making informed decisions about crop management. At Farmonaut, our advanced algorithms process NDVI data to provide clear, actionable insights for farmers.
The Enigma of NDVI Negative Values: What Do They Indicate?
One of the most intriguing aspects of NDVI is the occurrence of negative values. But what is the NDVI negative values meaning? Contrary to what some might assume, negative NDVI values aren’t errors or irrelevant data. They carry significant meaning in agricultural remote sensing.
The NDVI negative values meaning typically indicates:
- Water bodies: Lakes, rivers, and oceans often show negative NDVI values due to their strong absorption of near-infrared light.
- Snow and ice: These surfaces reflect visible light more than near-infrared, resulting in negative NDVI.
- Clouds: Similar to snow, clouds can yield negative NDVI values.
- Man-made structures: Buildings, roads, and other non-vegetative structures can produce negative NDVI readings.
At Farmonaut, we’ve developed sophisticated algorithms to interpret these negative values accurately, ensuring that our users receive the most comprehensive and reliable data about their fields.
The Impact of NDVI in Modern Agriculture
The application of NDVI in agriculture has revolutionized farming practices worldwide. Here’s how understanding NDVI values can benefit farmers:
- Crop Health Monitoring: Regular NDVI measurements allow farmers to track crop health throughout the growing season, enabling early detection of stress or disease.
- Yield Prediction: NDVI values correlate strongly with potential crop yields, helping farmers and agribusinesses make informed decisions about harvesting and market strategies.
- Irrigation Management: By analyzing NDVI patterns, farmers can optimize irrigation schedules, ensuring efficient water usage.
- Fertilizer Application: NDVI maps can guide precision fertilizer application, reducing waste and improving crop nutrition.
- Pest and Disease Management: Early detection of anomalies in NDVI values can alert farmers to potential pest infestations or disease outbreaks.
At Farmonaut, we leverage these NDVI applications to provide our users with comprehensive farm management solutions. Our satellite-based monitoring system offers real-time NDVI data, empowering farmers to make data-driven decisions that boost productivity and sustainability.
Farmonaut’s Approach to NDVI: Precision Agriculture at Your Fingertips
At Farmonaut, we’ve revolutionized the way farmers access and utilize NDVI data. Our platform offers:
- High-resolution satellite imagery for accurate NDVI mapping
- User-friendly interface for easy interpretation of NDVI values
- AI-powered analysis for actionable insights
- Integration with other farm management tools for comprehensive decision-making
By leveraging cutting-edge technology, we make precision agriculture accessible to farmers of all scales. Our mobile app puts the power of satellite-based NDVI monitoring right in your pocket, allowing you to track crop health anytime, anywhere.
Beyond NDVI: Farmonaut’s Comprehensive Agricultural Solutions
While NDVI is a cornerstone of our services, Farmonaut offers a range of solutions designed to revolutionize farming practices:
- Jeevn AI Advisory System: Our AI-driven personalized farm advisory tool delivers real-time insights, weather forecasts, and expert crop management strategies.
- Blockchain-Based Product Traceability: Enhance trust and reduce fraud in supply chains with our transparent, secure blockchain solutions.
- Fleet and Resource Management: Optimize your agricultural operations with our advanced fleet management tools.
- Carbon Footprinting: Monitor and reduce your environmental impact with real-time emissions tracking.
For developers and businesses looking to integrate our powerful satellite and weather data into their own systems, we offer comprehensive API access. Check out our API documentation to learn more about harnessing the power of Farmonaut’s data.
Why Choose Farmonaut’s Satellite System Over Drone and IoT-Based Monitoring?
| Feature | Farmonaut Satellite System | Drone-Based Monitoring | IoT-Based Monitoring |
|---|---|---|---|
| Coverage Area | Large-scale (global) | Limited (local) | Very limited (field-specific) |
| Cost-Effectiveness | High | Moderate | Low (requires hardware investment) |
| Data Frequency | Regular (based on satellite passes) | On-demand (requires manual flights) | Continuous (real-time) |
| Ease of Use | High (no on-site equipment needed) | Moderate (requires piloting skills) | Moderate (requires setup and maintenance) |
| Data Processing | Automated (AI-driven) | Semi-automated | Automated (sensor-specific) |
| Scalability | Highly scalable | Limited scalability | Moderate scalability |
The Future of NDVI and Precision Agriculture
As technology continues to advance, the applications of NDVI in agriculture are set to expand even further. At Farmonaut, we’re at the forefront of these developments, constantly innovating to bring the latest in precision agriculture to our users.
Some exciting future trends we’re exploring include:
- Integration of NDVI data with machine learning for even more accurate yield predictions
- Combining NDVI with other spectral indices for more comprehensive crop health analysis
- Development of hyperspectral imaging techniques for even more detailed vegetation analysis
- Integration of NDVI data with autonomous farming systems for truly smart agriculture
Stay tuned to Farmonaut’s developer documentation for the latest updates on our API capabilities and how you can leverage our cutting-edge technology in your agricultural applications.
Empowering Farmers with NDVI: Farmonaut’s Mission
At Farmonaut, our mission goes beyond simply providing NDVI data. We’re committed to empowering farmers with the knowledge and tools they need to thrive in the modern agricultural landscape. By making precision agriculture accessible and affordable, we’re helping to ensure food security, promote sustainable farming practices, and support rural economies worldwide.
Whether you’re a small-scale farmer looking to optimize your crop yields or a large agribusiness seeking to streamline operations, Farmonaut has the solutions you need. Our platform is designed to grow with you, offering scalable solutions that adapt to your changing needs.
Ready to experience the power of satellite-based NDVI monitoring and precision agriculture? Download our app today:
FAQs About NDVI and Farmonaut
Q: What does NDVI stand for?
A: NDVI stands for Normalized Difference Vegetation Index. It’s a numerical indicator used to analyze remote sensing measurements and assess the presence of live green vegetation in a target area.
Q: How is NDVI calculated?
A: NDVI is calculated using the formula: NDVI = (NIR – RED) / (NIR + RED), where NIR is the near-infrared reflectance and RED is the red reflectance.
Q: What do negative NDVI values mean?
A: Negative NDVI values typically indicate non-vegetative surfaces such as water bodies, snow, ice, clouds, or man-made structures. They occur when the red reflectance is higher than the near-infrared reflectance.
Q: How often does Farmonaut update its NDVI data?
A: Farmonaut provides regular updates based on satellite passes, which can vary depending on your location and subscription plan. For the most up-to-date information, please check our app or website.
Q: Can Farmonaut’s NDVI monitoring work for small farms?
A: Absolutely! Farmonaut’s solutions are designed to be scalable, making them suitable for farms of all sizes, from small holdings to large agricultural operations.
Q: How accurate is satellite-based NDVI compared to ground measurements?
A: Satellite-based NDVI measurements have shown high correlations with ground-based measurements in numerous studies. While there can be some variations due to atmospheric conditions, Farmonaut uses advanced algorithms to ensure high accuracy in our NDVI data.
Q: Can I integrate Farmonaut’s NDVI data into my own farm management software?
A: Yes, Farmonaut offers API access that allows you to integrate our satellite and weather data, including NDVI, into your own systems. Check out our API documentation for more details.
Join the Precision Agriculture Revolution with Farmonaut
As we’ve explored in this comprehensive guide, understanding NDVI and its applications in agriculture can truly transform your farming practices. At Farmonaut, we’re committed to making this powerful technology accessible to farmers worldwide, helping to drive a new era of sustainable, efficient, and productive agriculture.
Ready to take your farming to the next level? Subscribe to Farmonaut today and start harnessing the power of satellite-based NDVI monitoring and precision agriculture:
Join us in revolutionizing agriculture, one field at a time. With Farmonaut, the future of farming is in your hands.
