Here’s a comprehensive blog post incorporating the requested elements:
Understanding NDWI: From Basics to Advanced Applications in Remote Sensing and Water Management
In the ever-evolving world of remote sensing and environmental monitoring, various indices have been developed to help us better understand and manage our natural resources. One such crucial index is the Normalized Difference Water Index (NDWI). At Farmonaut, we recognize the importance of NDWI in precision agriculture and water resource management. In this comprehensive guide, we’ll delve deep into the world of NDWI, exploring its definition, applications, and comparisons with other related indices.
Table of Contents
- What is NDWI?
- NDWI Full Form and Its Significance
- NDWI Formula and Calculation
- NDWI McFeeters: The Original Concept
- Applications of NDWI in Remote Sensing
- NDWI Maps: Visualizing Water Content
- NDMI vs NDWI: Understanding the Differences
- NDWI in Different Languages: NDWI Adalah and NDWI Индекс
- Farmonaut’s Approach to NDWI in Precision Agriculture
- FAQs about NDWI
1. What is NDWI?
The Normalized Difference Water Index (NDWI) is a remote sensing-derived index that is used to monitor changes in water content in water bodies, as well as changes in plant water content. It is particularly useful for monitoring droughts, irrigated lands, and wetlands.
NDWI utilizes the near-infrared (NIR) and short-wave infrared (SWIR) bands of satellite imagery to highlight water features and enhance the presence of water in remotely sensed imagery. This index is sensitive to changes in the water content of leaves, making it an invaluable tool in agriculture and environmental monitoring.
2. NDWI Full Form and Its Significance
The full form of NDWI is Normalized Difference Water Index. This name encapsulates its primary function: to provide a normalized measure of water content in vegetation and open water bodies. The term “normalized” is crucial as it allows for consistent comparisons across different images and time periods.
The significance of NDWI lies in its ability to:
- Detect and monitor drought conditions
- Assess plant water stress
- Map flood extent and monitor flood dynamics
- Identify and delineate open water bodies
- Monitor changes in wetlands and irrigated agricultural areas
3. NDWI Formula and Calculation
The NDWI formula, as originally proposed by Gao (1996), is:
NDWI = (NIR – SWIR) / (NIR + SWIR)
Where:
- NIR = Near-Infrared band
- SWIR = Short-Wave Infrared band
This formula produces values ranging from -1 to 1, where higher values indicate higher water content. The specific band wavelengths used can vary depending on the satellite sensor, but typically:
- NIR is around 0.86 μm
- SWIR is around 1.24 μm
At Farmonaut, we use advanced satellite imagery and spectral analysis to calculate NDWI with high precision. Our platform allows farmers and environmental managers to easily access NDWI data for their areas of interest.
4. NDWI McFeeters: The Original Concept
While Gao’s NDWI is widely used for vegetation water content, another variant of NDWI was introduced by McFeeters in 1996. This version, often referred to as “NDWI McFeeters,” is specifically designed to delineate open water features.
The NDWI McFeeters formula is:
NDWI McFeeters = (Green – NIR) / (Green + NIR)
Where:
- Green = Green band
- NIR = Near-Infrared band
This formula is particularly effective for mapping open water bodies and is less sensitive to built-up land than the original NDWI. At Farmonaut, we utilize both NDWI variants depending on the specific application and client needs.
5. Applications of NDWI in Remote Sensing
NDWI has a wide range of applications in remote sensing and environmental monitoring:
- Drought Monitoring: NDWI can detect early signs of vegetation water stress, making it invaluable for drought early warning systems.
- Crop Health Assessment: Farmers can use NDWI to monitor crop water content and optimize irrigation schedules.
- Wetland Mapping: NDWI is effective in delineating wetland boundaries and monitoring changes over time.
- Flood Mapping: During flood events, NDWI can be used to map the extent of inundation and monitor flood progression.
- Water Resource Management: By tracking changes in water bodies, NDWI aids in the sustainable management of water resources.
- Forest Fire Risk Assessment: Low NDWI values in forested areas can indicate increased fire risk due to dry vegetation.
At Farmonaut, we leverage NDWI in our precision agriculture solutions, helping farmers make informed decisions about irrigation and crop management.
6. NDWI Maps: Visualizing Water Content
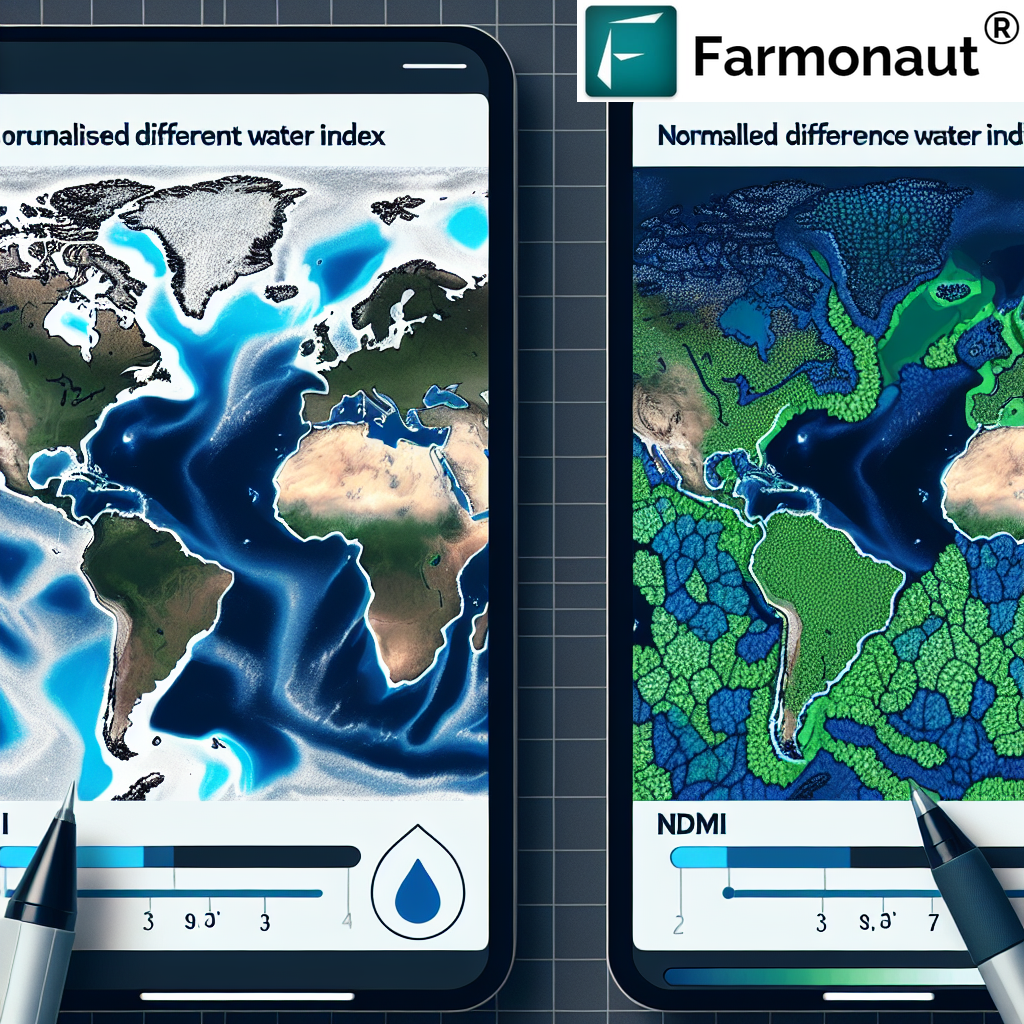
NDWI maps are powerful visual tools that represent water content across a landscape. These maps typically use a color scale where:
- Blue colors indicate high water content or open water
- Green colors represent moderate water content in vegetation
- Yellow to red colors show low water content or dry areas
NDWI maps can be generated for various scales, from individual fields to entire regions. They provide a quick and intuitive way to assess water distribution and identify areas of water stress or abundance.
Our Farmonaut platform offers user-friendly NDWI map generation, allowing users to visualize water content across their areas of interest with just a few clicks. To explore this feature, visit our app.
7. NDMI vs NDWI: Understanding the Differences
While NDWI is widely used for water content assessment, another similar index is the Normalized Difference Moisture Index (NDMI). It’s important to understand the differences between these two indices:
| Aspect | NDWI | NDMI |
|---|---|---|
| Full Form | Normalized Difference Water Index | Normalized Difference Moisture Index |
| Primary Use | Water content in leaves and canopies | Vegetation water content and soil moisture |
| Formula | (NIR – SWIR) / (NIR + SWIR) | (NIR – SWIR) / (NIR + SWIR) |
| Bands Used | NIR (~0.86 μm) and SWIR (~1.24 μm) | NIR (~0.86 μm) and SWIR (~1.65 μm) |
| Sensitivity | More sensitive to leaf water content | More sensitive to overall vegetation moisture |
At Farmonaut, we utilize both NDWI and NDMI in our comprehensive crop monitoring system, providing farmers with a holistic view of their field’s water status.
8. NDWI in Different Languages: NDWI Adalah and NDWI Индекс
As NDWI gains global importance, it’s being referenced in various languages. Here are some examples:
- NDWI Adalah: This is the Indonesian term for NDWI. “Adalah” means “is” in Indonesian, so “NDWI adalah” translates to “NDWI is” or “NDWI means”.
- NDWI Индекс: This is the Russian term for NDWI. “Индекс” (Index) is added to clarify that NDWI is an index.
Regardless of the language, the concept and application of NDWI remain the same. At Farmonaut, we’re committed to making our NDWI tools accessible to farmers and researchers worldwide, bridging language barriers in precision agriculture.
9. Farmonaut’s Approach to NDWI in Precision Agriculture
At Farmonaut, we’ve integrated NDWI into our suite of precision agriculture tools. Our approach includes:
- High-Resolution Satellite Imagery: We use advanced satellite data to calculate NDWI with high accuracy.
- User-Friendly Interface: Our platform allows easy access to NDWI maps and data.
- Integration with Other Indices: We combine NDWI with other vegetation indices for comprehensive crop health assessment.
- Historical Data Analysis: Users can track NDWI changes over time to identify trends and patterns.
- AI-Powered Insights: Our Jeevn AI system uses NDWI data to provide personalized crop management advice.
To experience how Farmonaut leverages NDWI for precision agriculture, check out our Android app or iOS app.
Farmonaut Satellite System vs Drone and IoT-based Farm Monitoring
| Feature | Farmonaut Satellite System | Drone-based Monitoring | IoT-based Monitoring |
|---|---|---|---|
| Coverage Area | Large scale (regional to global) | Limited (local) | Very limited (field-specific) |
| Frequency of Data Collection | Regular (every few days) | On-demand (requires manual flight) | Continuous |
| Initial Setup Cost | Low | High (drone purchase required) | Medium to High (sensors needed) |
| Operational Complexity | Low (automated) | High (requires trained pilot) | Medium (requires maintenance) |
| Data Processing | Automated with AI | Often requires manual processing | Automated but limited in scope |
| Scalability | Highly scalable | Limited scalability | Moderate scalability |
| Weather Dependency | Low (can penetrate clouds) | High (affected by wind, rain) | Low |
| Integration with Other Data | Easy integration with global datasets | Limited integration capabilities | Good for local data integration |
10. FAQs about NDWI
Q1: What is the main difference between NDWI and NDVI?
A1: While both are vegetation indices, NDWI focuses on water content in vegetation and water bodies, whereas NDVI (Normalized Difference Vegetation Index) primarily measures vegetation health and density.
Q2: Can NDWI be used for all types of crops?
A2: Yes, NDWI can be applied to various crop types. However, interpretation may vary depending on the crop’s specific water requirements and growth stages.
Q3: How often should NDWI be calculated for effective crop monitoring?
A3: The frequency depends on the specific application, but for most agricultural purposes, weekly or bi-weekly calculations are sufficient. Farmonaut’s platform provides regular updates based on the latest satellite imagery.
Q4: Is NDWI affected by atmospheric conditions?
A4: Yes, atmospheric conditions can affect NDWI calculations. However, modern remote sensing techniques and atmospheric correction algorithms help minimize these effects.
Q5: How accurate is NDWI in detecting water stress in crops?
A5: NDWI is quite effective in detecting water stress, especially when used in conjunction with other indices and ground-truth data. Farmonaut’s system combines multiple data sources for high accuracy.
Conclusion
NDWI is a powerful tool in the realm of remote sensing and precision agriculture. Its ability to detect water content in vegetation and delineate water bodies makes it invaluable for farmers, environmental managers, and researchers alike. At Farmonaut, we’re committed to harnessing the power of NDWI and other advanced remote sensing techniques to revolutionize agriculture and water resource management.
For those interested in leveraging NDWI and other cutting-edge agricultural technologies, we invite you to explore our services:
For developers interested in integrating our satellite and weather data into their own applications, check out our API documentation and developer resources.
By embracing technologies like NDWI and partnering with innovative platforms like Farmonaut, we can work towards a more sustainable and productive agricultural future. Join us in this journey towards precision agriculture and effective water management!
