Understanding Negative NDVI Values: What They Mean for Crop Health and Vegetation Analysis
In the world of precision agriculture and remote sensing, the Normalized Difference Vegetation Index (NDVI) plays a crucial role in assessing crop health and monitoring vegetation. At Farmonaut, we frequently encounter questions about NDVI values, particularly regarding the occurrence and significance of negative NDVI values. In this comprehensive blog post, we’ll delve deep into the concept of negative NDVI, exploring what it means, why it occurs, and how it impacts our understanding of crop health and vegetation analysis.
What is NDVI?
Before we dive into the intricacies of negative NDVI values, let’s briefly recap what NDVI is and why it’s so important in agriculture and remote sensing.
NDVI is a widely used vegetation index that quantifies the density and health of vegetation by measuring the difference between near-infrared (NIR) light, which healthy vegetation strongly reflects, and red light, which vegetation absorbs. The formula for NDVI is:
NDVI = (NIR – Red) / (NIR + Red)
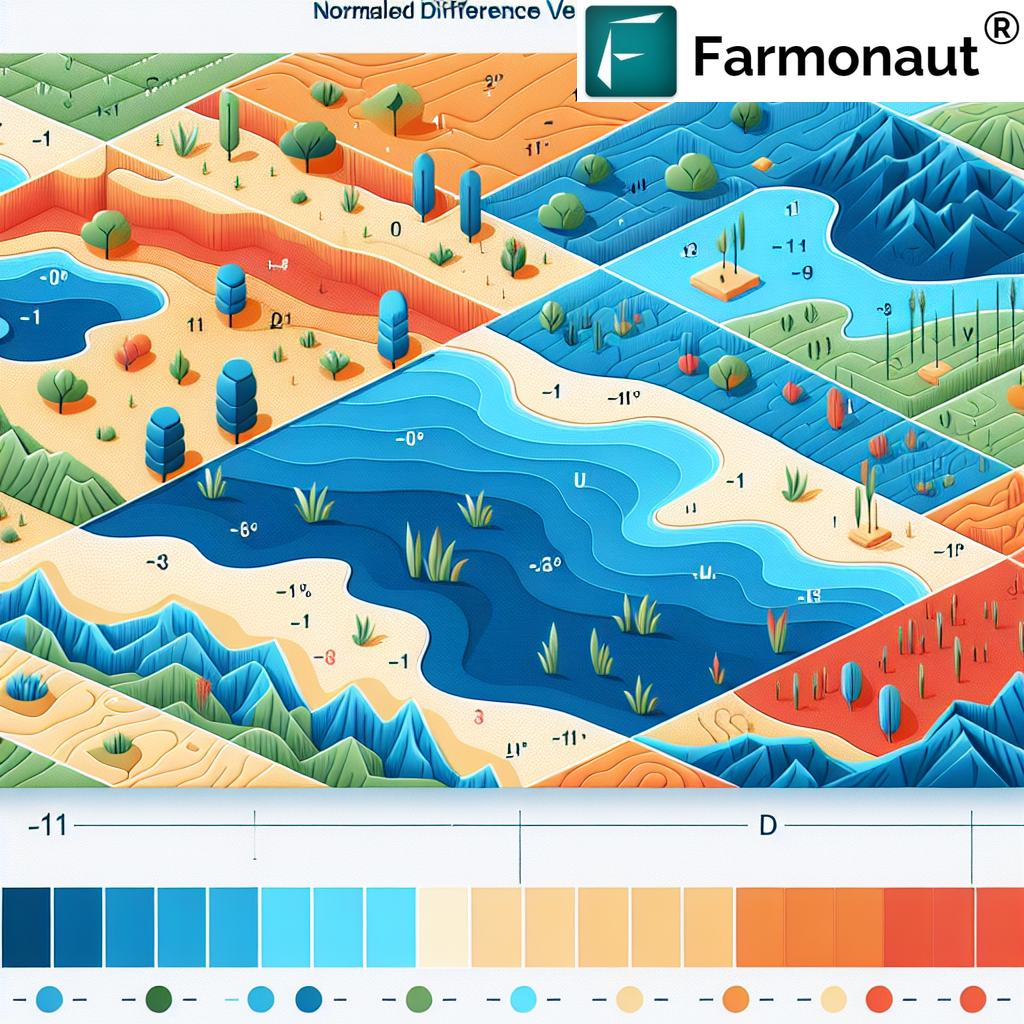
This index ranges from -1 to +1, with higher values typically indicating healthier and denser vegetation. However, the occurrence of negative NDVI values often raises questions among farmers and researchers alike.
Can NDVI Be Negative?
One of the most common questions we encounter at Farmonaut is, “can NDVI be negative?” The short answer is yes, NDVI can indeed be negative. While positive NDVI values are more commonly associated with vegetation, negative NDVI values do occur and carry significant meaning in certain scenarios.
Understanding Negative NDVI Values
Negative NDVI values typically range from -1 to 0 and occur when the red reflectance is higher than the near-infrared reflectance. This situation is less common in healthy vegetation but can be observed in various circumstances:
- Water bodies
- Snow and ice
- Clouds
- Bare soil
- Dead or severely stressed vegetation
At Farmonaut, our satellite-based crop health monitoring system is designed to detect and interpret these negative NDVI values, providing farmers with valuable insights into their fields’ conditions beyond just healthy vegetation.
What Causes Negative NDVI?
To understand why negative NDVI occurs, we need to look at the factors that influence the reflectance of red and near-infrared light:
1. Water Bodies
Water absorbs more near-infrared light than red light, leading to negative NDVI values. This is particularly useful for identifying flooded areas or tracking water resources in agricultural regions.
2. Snow and Ice
Similar to water, snow and ice reflect more red light than near-infrared light, resulting in negative NDVI. This can be crucial information for farmers in colder climates or at higher altitudes.
3. Clouds
Clouds can cause negative NDVI values due to their high reflectance of both red and near-infrared light. At Farmonaut, our advanced algorithms help differentiate between cloud cover and actual ground conditions.
4. Bare Soil
Depending on its composition and moisture content, bare soil can sometimes produce negative NDVI values. This information is valuable for assessing field preparation and planting stages.
5. Dead or Severely Stressed Vegetation
In extreme cases of plant stress or death, vegetation may reflect more red light than near-infrared, leading to negative NDVI values. This can be an early warning sign for farmers to take corrective action.
Interpreting Negative NDVI Values in Agriculture
At Farmonaut, we believe that understanding negative NDVI values is crucial for comprehensive crop health monitoring and vegetation analysis. Here’s how we interpret these values in various agricultural scenarios:
1. Early Detection of Water Stress
Slight negative NDVI values in typically vegetated areas can indicate the onset of severe water stress. Our AI-powered Jeevn AI Advisory System uses this information to alert farmers about potential irrigation needs before visible symptoms appear.
2. Identifying Flood-Prone Areas
Persistent negative NDVI in low-lying areas of a field may suggest poor drainage or flood-prone zones. This information helps farmers make informed decisions about land use and crop selection.
3. Monitoring Snow Cover and Frost Damage
In colder regions, negative NDVI values can help track snow cover and potential frost damage to crops. This is particularly valuable for winter crop management and early spring planting decisions.
4. Assessing Soil Conditions
Negative NDVI values in bare soil can provide insights into soil moisture and composition. Our satellite-based monitoring system uses this data to help farmers optimize their soil preparation and planting strategies.
5. Detecting Crop Failures
Sudden shifts to negative NDVI in previously healthy crop areas can indicate severe stress or crop failure. This early warning system allows farmers to take swift action to mitigate losses.
How Farmonaut Utilizes Negative NDVI Data
At Farmonaut, we’ve developed sophisticated algorithms that not only detect negative NDVI values but also interpret them in the context of overall farm health and productivity. Here’s how we leverage this data:
- Comprehensive Health Mapping: We integrate negative NDVI values into our overall crop health maps, providing a more nuanced view of field conditions.
- Precision Irrigation Planning: By analyzing patterns of negative NDVI, we help farmers optimize their irrigation strategies, reducing water waste and improving crop yields.
- Early Warning System: Our platform alerts farmers to sudden changes in NDVI, including shifts to negative values, enabling rapid response to potential issues.
- Historical Analysis: We track negative NDVI values over time, helping farmers understand long-term trends in field conditions and make informed decisions about crop rotation and land use.
To experience how Farmonaut can help you leverage NDVI data, including negative NDVI values, for your farm, try our app today.
The Importance of Context in Interpreting Negative NDVI
While negative NDVI values provide valuable information, it’s crucial to interpret them within the proper context. At Farmonaut, we consider several factors when analyzing negative NDVI:
1. Seasonal Variations
NDVI values, including negative ones, can vary significantly throughout the growing season. What might be considered a concerning negative NDVI value during peak growing season could be normal during pre-planting or post-harvest periods.
2. Crop Type
Different crops have varying NDVI signatures. Some crops naturally have lower NDVI values, and what might be considered a negative NDVI for one crop could be within the normal range for another.
3. Local Environmental Conditions
Factors such as soil type, climate, and typical weather patterns can influence NDVI readings. Our system takes these local conditions into account when interpreting negative NDVI values.
4. Recent Weather Events
Sudden changes in NDVI, including shifts to negative values, should be interpreted in light of recent weather events such as heavy rainfall, drought, or frost.
Comparing Farmonaut’s Satellite System with Drone and IoT-based Monitoring
While drones and IoT devices offer certain advantages in farm monitoring, Farmonaut’s satellite-based system provides unique benefits, especially when it comes to detecting and interpreting negative NDVI values. Here’s a comparison:
| Feature | Farmonaut Satellite System | Drone-based Monitoring | IoT-based Monitoring |
|---|---|---|---|
| Coverage Area | Large scale (entire farms or regions) | Limited by flight time and regulations | Limited to sensor placement |
| Frequency of Data Collection | Regular intervals (as frequent as daily) | On-demand, weather dependent | Continuous, but point-specific |
| Detection of Negative NDVI | Comprehensive, with historical context | Possible, but limited by flight frequency | Limited to specific sensor locations |
| Cost-effectiveness | High (no equipment to purchase or maintain) | Moderate (equipment costs and operator fees) | Variable (depends on number of sensors) |
| Data Processing and Analysis | Advanced AI-driven analysis, including negative NDVI interpretation | Requires separate processing and analysis tools | Often limited to basic measurements |
| Integration with Other Data Sources | Seamless integration with weather data, historical trends, and AI advisories | Possible, but often requires additional software | Typically limited to on-site data |
As you can see, Farmonaut’s satellite-based system offers comprehensive coverage and sophisticated analysis, making it particularly effective for detecting and interpreting negative NDVI values across large areas.
Leveraging Negative NDVI Data for Precision Agriculture
At Farmonaut, we believe that understanding and utilizing negative NDVI values is key to advancing precision agriculture. Here’s how farmers can leverage this data:
1. Targeted Interventions
By identifying areas with negative NDVI, farmers can focus their efforts on the most critical parts of their fields, whether it’s addressing water stress, pest infestations, or nutrient deficiencies.
2. Resource Optimization
Understanding the distribution of negative NDVI values across a field allows for more efficient use of resources like water, fertilizers, and pesticides.
3. Crop Selection and Rotation
Long-term analysis of NDVI patterns, including negative values, can inform decisions about which crops are best suited for different areas of a farm.
4. Risk Management
Early detection of negative NDVI can help farmers and insurers better assess and manage crop risks throughout the growing season.
5. Environmental Monitoring
Negative NDVI values can indicate changes in land use or environmental conditions, helping farmers and policymakers track the long-term health of agricultural regions.
To start leveraging these insights for your farm, download our Android app or get the iOS version.
The Future of Negative NDVI Analysis in Agriculture
As technology continues to advance, we at Farmonaut are excited about the future possibilities for negative NDVI analysis in agriculture:
1. Enhanced Resolution and Frequency
Improvements in satellite technology will allow for even more detailed and frequent NDVI measurements, including better detection of subtle negative NDVI values.
2. Advanced AI and Machine Learning
Our ongoing development of AI algorithms will further improve the interpretation of negative NDVI, providing even more accurate and actionable insights to farmers.
3. Integration with IoT and Drones
While our satellite-based system offers comprehensive coverage, we’re exploring ways to integrate data from IoT devices and drones to provide an even more detailed picture of farm health, including negative NDVI areas.
4. Predictive Analytics
By analyzing historical patterns of negative NDVI values, we aim to develop predictive models that can forecast potential issues before they occur.
5. Climate Change Adaptation
As climate patterns shift, tracking changes in NDVI, including negative NDVI, will become increasingly important for adapting agricultural practices to new environmental conditions.
Farmonaut’s Commitment to Advancing NDVI Analysis
At Farmonaut, we’re dedicated to pushing the boundaries of what’s possible with NDVI analysis, including the interpretation of negative NDVI values. Our team of experts continually refines our algorithms and expands our capabilities to provide farmers with the most accurate and actionable insights possible.
We’re also committed to making this technology accessible to farmers of all sizes. That’s why we offer flexible pricing options and a range of features to suit different needs and budgets.
Leveraging Farmonaut’s API for Advanced NDVI Analysis
For developers and businesses looking to integrate advanced NDVI analysis, including negative NDVI values, into their own applications, Farmonaut offers a powerful API. Our API provides access to our comprehensive satellite data and advanced analytics, allowing you to build custom solutions tailored to your specific needs.
To learn more about how you can leverage our API for NDVI analysis, including negative NDVI detection, visit our API documentation page.
Conclusion
Understanding negative NDVI values is crucial for comprehensive crop health monitoring and precision agriculture. At Farmonaut, we’re committed to providing farmers, researchers, and agribusinesses with the tools and insights they need to interpret these values accurately and make informed decisions.
By leveraging our satellite-based monitoring system, AI-powered analytics, and comprehensive approach to NDVI analysis, including negative NDVI, farmers can optimize their operations, reduce risks, and improve yields.
We invite you to explore how Farmonaut can help you harness the power of NDVI analysis, including the interpretation of negative NDVI values, for your agricultural operations. Visit our developer documentation to learn more about integrating our technology into your systems.
FAQs
Q: What does a negative NDVI value indicate?
A: Negative NDVI values typically indicate areas with little to no vegetation, such as water bodies, snow, clouds, bare soil, or severely stressed vegetation. These values occur when the red reflectance is higher than the near-infrared reflectance.
Q: Can healthy vegetation ever have a negative NDVI?
A: It’s extremely rare for healthy vegetation to have a negative NDVI. Healthy plants typically have positive NDVI values due to their high near-infrared reflectance and low red reflectance.
Q: How accurate is Farmonaut’s detection of negative NDVI values?
A: Farmonaut’s satellite-based system is highly accurate in detecting negative NDVI values. Our advanced algorithms and regular calibration ensure reliable results. However, it’s important to interpret these values in context, considering factors like seasonal variations and local conditions.
Q: How often does Farmonaut update its NDVI data?
A: The frequency of our NDVI updates depends on the subscription plan. We offer options ranging from daily to weekly updates, ensuring farmers have access to timely data, including negative NDVI values.
Q: Can Farmonaut’s system differentiate between water bodies and severely stressed crops in terms of negative NDVI?
A: Yes, our advanced algorithms can differentiate between various causes of negative NDVI, including water bodies and severely stressed crops. We consider factors like historical data, surrounding vegetation, and geographical features to provide accurate interpretations.
Q: How can farmers use negative NDVI data to improve their crop management?
A: Farmers can use negative NDVI data to identify areas of concern, such as water-stressed regions, poorly draining areas, or zones of crop failure. This information can guide targeted interventions, help optimize resource allocation, and inform long-term planning decisions.
Q: Is Farmonaut’s NDVI analysis, including negative NDVI detection, available worldwide?
A: Yes, Farmonaut’s satellite-based NDVI analysis, including the detection of negative NDVI values, is available globally. Our system can provide valuable insights for agricultural operations anywhere in the world.
For more information on how Farmonaut can help you leverage NDVI data, including negative NDVI values, for your agricultural operations, please visit our website or contact our support team.
