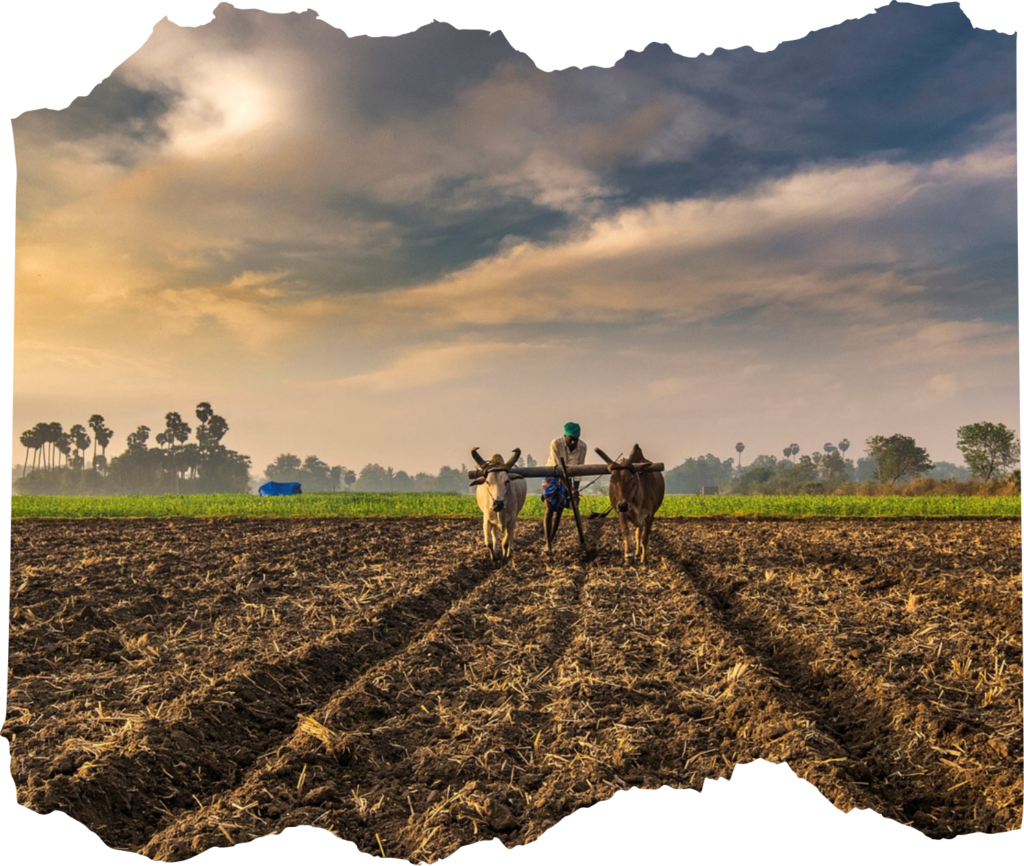
The biggest risk India is facing is the risk of climate change. Climate change effects yield of crops, lower cropped area and droughts. Higher temperature in March 2022 led to lower yield of Wheat in 2022 and erratic monsoon led to lower yield in Rice. Hit in both the crops has led to severe cereal inflation. The government is struggling to bring down prices of cereals as it impacts the most impoverished. Even with free distribution of 5 kg of grains for 80 crore people has led to lower stocks of wheat and rice in central pool. This has led government to close the scheme in December.
With India having high food component in headline inflation, the risk of inflation induced by climate change effects the whole economy. It forces RBI to slow down economy by raising interest rates despite weak aggregate demand at the lower end of pyramid, nascent recovery after 3 years of adverse impact by Corona pandemic.
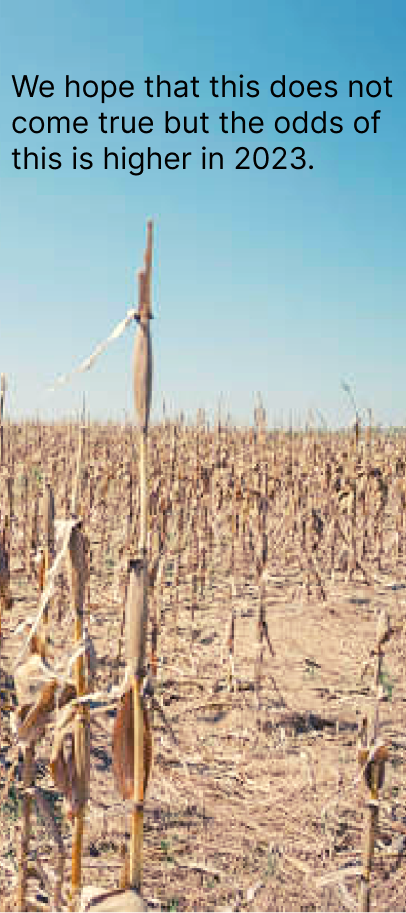
Various climate agencies are predicting more than 50% probability of EL Nino in 2023 which reduces the monsoon intensity in South Asia. The heating of Pacific leads to drought in Southeast Asia which produces palm, rubber, rice, sugarcane, pulses etc faces risk of reduction of production stroking inflationary impact on these prices which are directly related to Indian prices as India imports palm oil, rubber, pulses etc. The risk of lower rains will affect the already adverse supply position of agriculture products in the market.
The consumption in the lower end of pyramid is facing distress since 2018 will face lower income and higher inflation of goods especially food. The government will have either close exports of many agriculture commodities or forced to import more. With the war in Ukraine impacting the Agri Supply chain of grains to sunflower oil will adversely impact ability to import and the imported inflation of food items.
Global economic slowdown will reduce exports and slow Indian economy, causing income and inflation issues. This will particularly impact farmers and the poor due to peak food inflation.
FARMONAUT:
To Reduce Risk
To mitigate the incoming risk faced due to weather change, Farmonaut is providing its technology and data analytics.
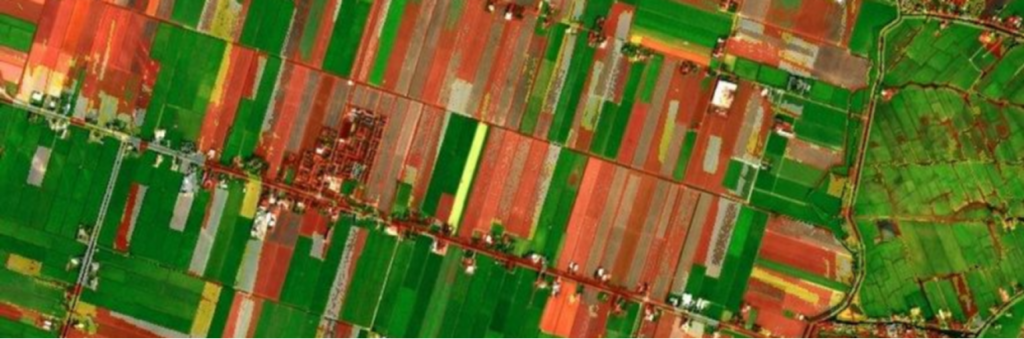
Farmonaut is revolutionizing agriculture through satellite data with a vision to help farmers and agriculture enthusiast worldwide in cost-effective way. By providing data on Crop Health, water stress, Weather forecasts and many more; the agriculture industry can make informed decisions about crop management. As climate change continues to posses’ risk on Agriculture industry, Farmonaut’s services can play a crucial role in mitigating risks.
By utilizing Farmonaut’s platform, farmers an access up-to-date information on vegetation water stress, evapotranspiration, soil organic carbon and weather forecasts, allowing them to make data-driven decisions on fertilization, pest management, irrigation needs and advisory. This proactive approach to crop management can potentially help mitigate the effects of climate change, reduce the risk of lower crop yields, and decrease inflationary impacts on food prices.
With over 1 million hectares of farmland monitored, Farmonaut is providing data to farmers and corporates worldwide. Some of our major clients/partners: