🌱 Introduction to iOS App for AgTech Industry
In the rapidly evolving world of agriculture technology, the demand for innovative solutions is skyrocketing. An iOS app for the AgTech industry is becoming an essential tool for farmers, agronomists, and agribusinesses alike. This blog post will delve into the powerful world of visualizing farm data through satellite imagery and advanced visualization tools, with a focus on how these technologies can be integrated into iOS applications.
As the agriculture sector embraces digital transformation, the need for specialized iOS development firms for the agriculture technology industry has never been greater. These firms are at the forefront of creating cutting-edge applications that leverage satellite analysis and API integration to provide farmers with invaluable insights about their crops and land.
🛰️ The Power of Satellite Analysis in AgTech
Satellite analysis has revolutionized the way we monitor and manage agricultural lands. By harnessing the power of remote sensing technologies, farmers can now gain unprecedented insights into their fields without setting foot on them. This technology is particularly valuable for large-scale farming operations where manual inspection of vast areas is impractical and time-consuming.
The integration of satellite data into iOS apps for the AgTech industry offers several benefits:
- Real-time crop health monitoring
- Early detection of pest infestations
- Optimization of irrigation schedules
- Precise application of fertilizers
- Yield prediction and harvest planning
🔧 Leveraging Satellite API Documentation for iOS Development
For iOS developers venturing into the AgTech space, understanding and utilizing satellite API documentation is crucial. These APIs serve as the bridge between raw satellite data and user-friendly applications. A well-documented satellite image API can significantly streamline the development process, allowing developers to focus on creating intuitive and powerful features for farmers.
Key aspects of satellite API documentation include:
- Authentication methods
- Endpoint descriptions
- Request and response formats
- Rate limiting information
- Error handling procedures

🖥️ Web App Development for Agriculture Technology
While our focus is on iOS applications, it’s important to note that web app development for agriculture technology is equally crucial. Many farmers and agribusinesses prefer cross-platform solutions that can be accessed from various devices. A web app design agency for the agriculture technology industry must consider factors such as responsive design, offline functionality, and seamless integration with mobile apps.
Web applications can complement iOS apps by providing:
- Comprehensive data dashboards
- Collaborative features for team management
- Integration with existing farm management systems
- Accessibility from any device with an internet connection
🔍 Visualizing Farms with iFrame Integration
Now, let’s dive into the core of our tutorial: visualizing farms using iFrame for API users. This powerful feature allows developers to embed interactive satellite imagery and data visualizations directly into their applications, whether they’re building for iOS or the web.
To get started with iFrame integration, follow these steps:
- Obtain an API key for iFrame access
- Identify the unique field ID for visualization
- Construct the URL with required parameters
- Embed the iFrame in your application
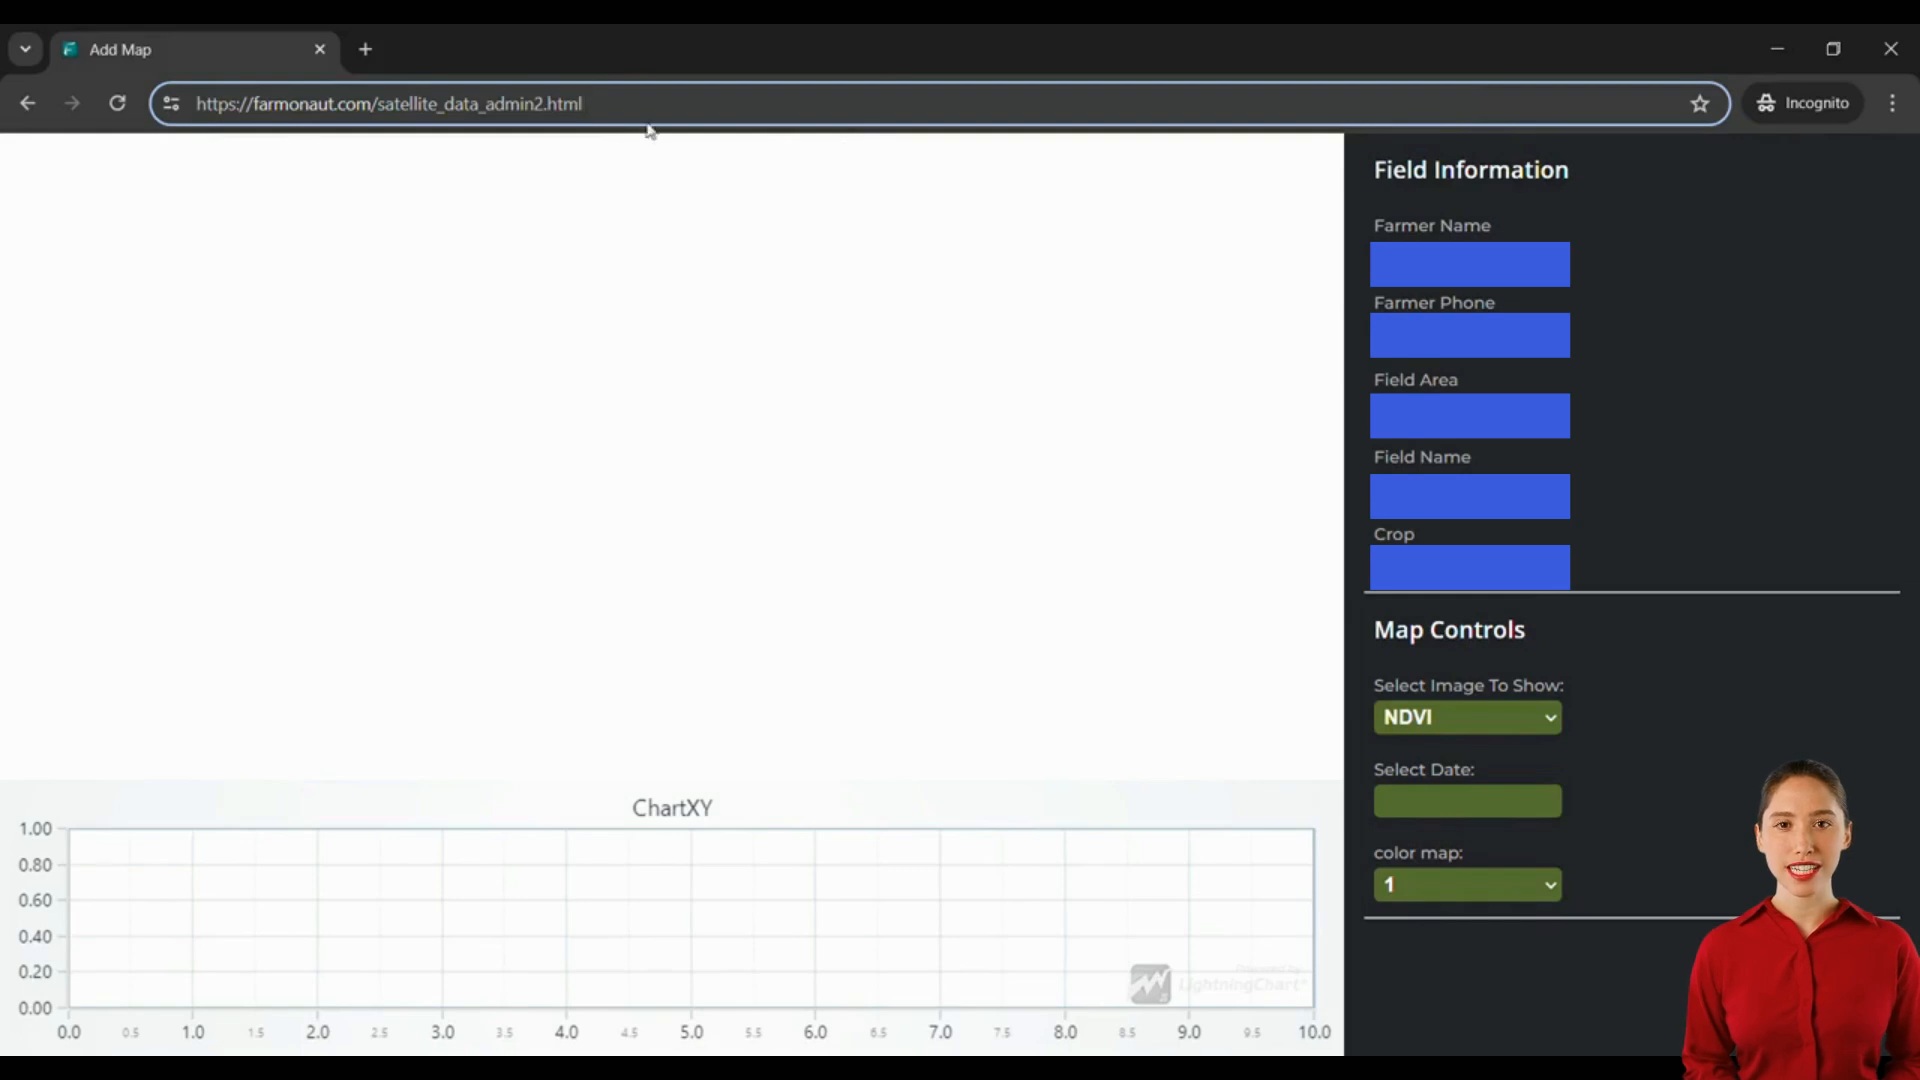
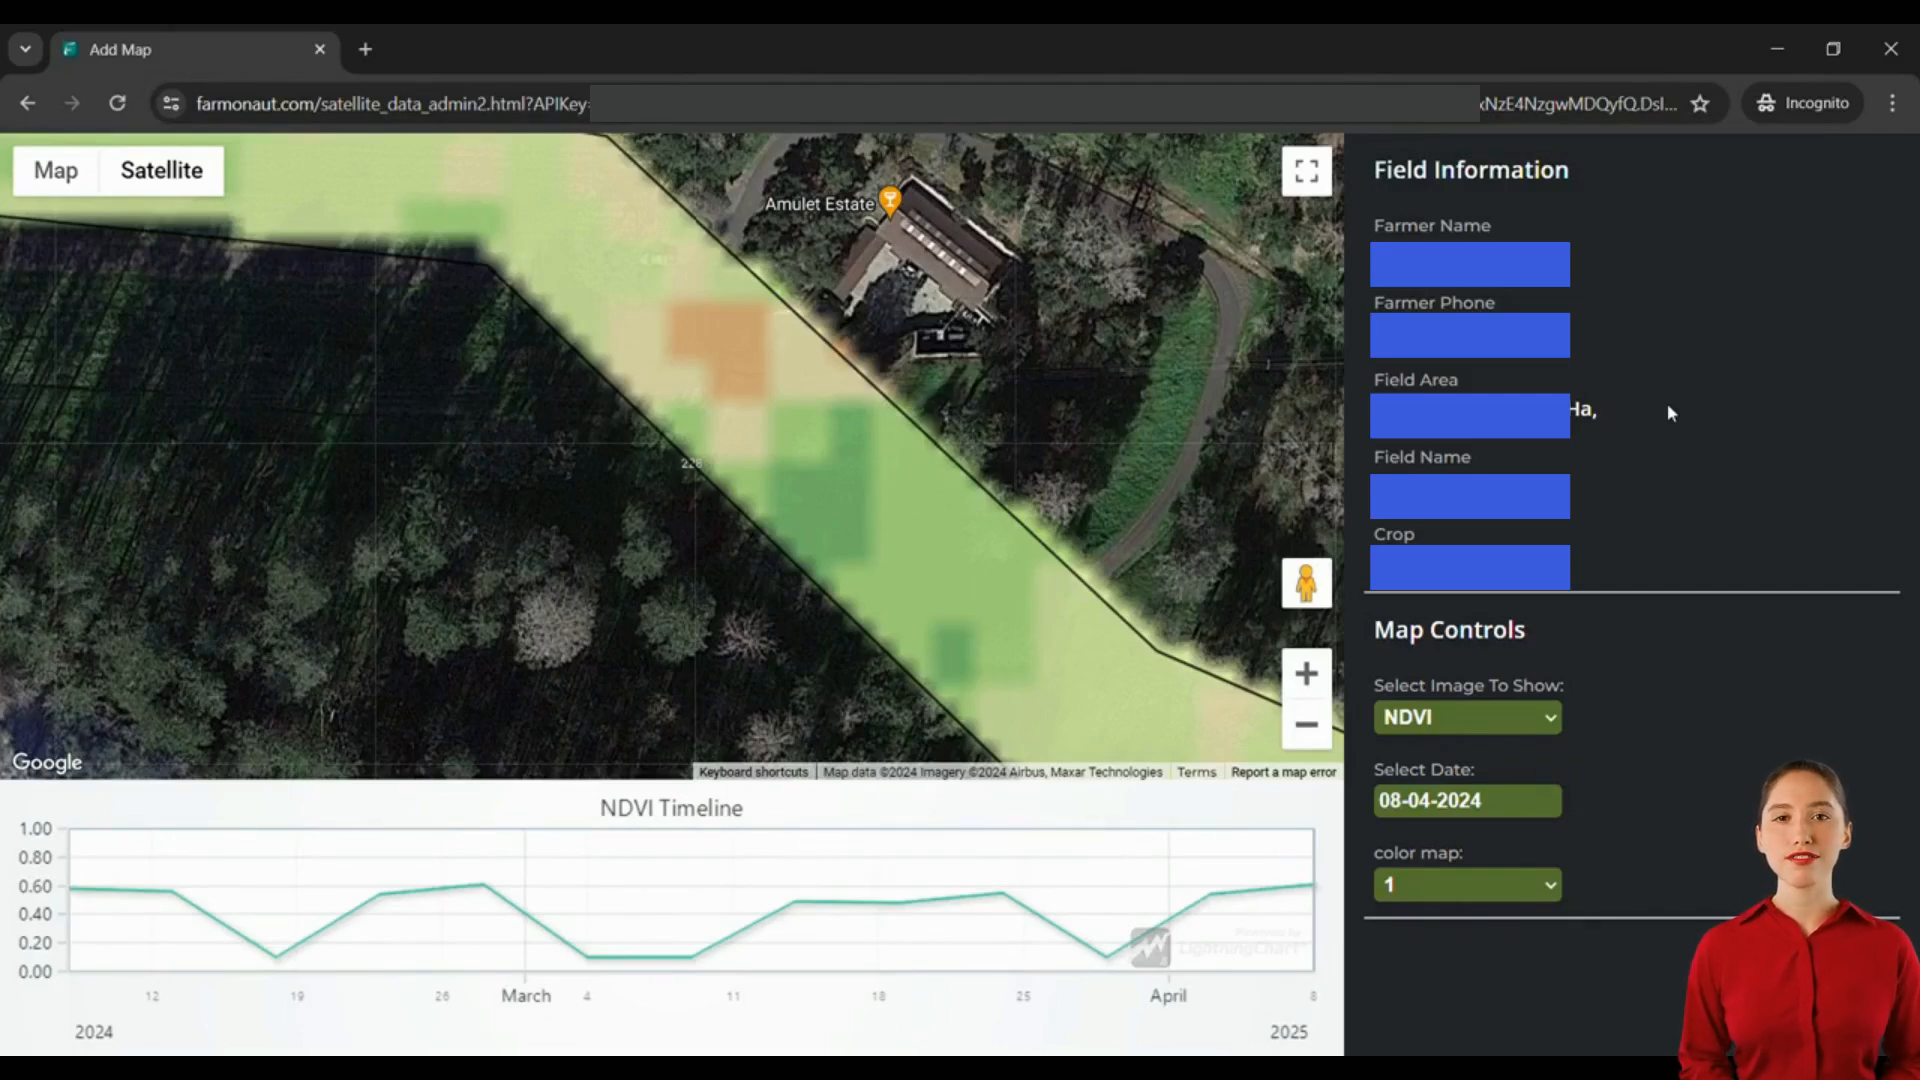
📊 Understanding Image Types and Color Maps
The iFrame feature supports various image types, each providing unique insights into farm conditions. The most common types include:
- NDVI (Normalized Difference Vegetation Index)
- NDWI (Normalized Difference Water Index)
- EVI (Enhanced Vegetation Index)
Each image type uses a specific color map to represent different aspects of crop health and field conditions. Developers can allow users to switch between these image types and adjust color maps for more detailed analysis.
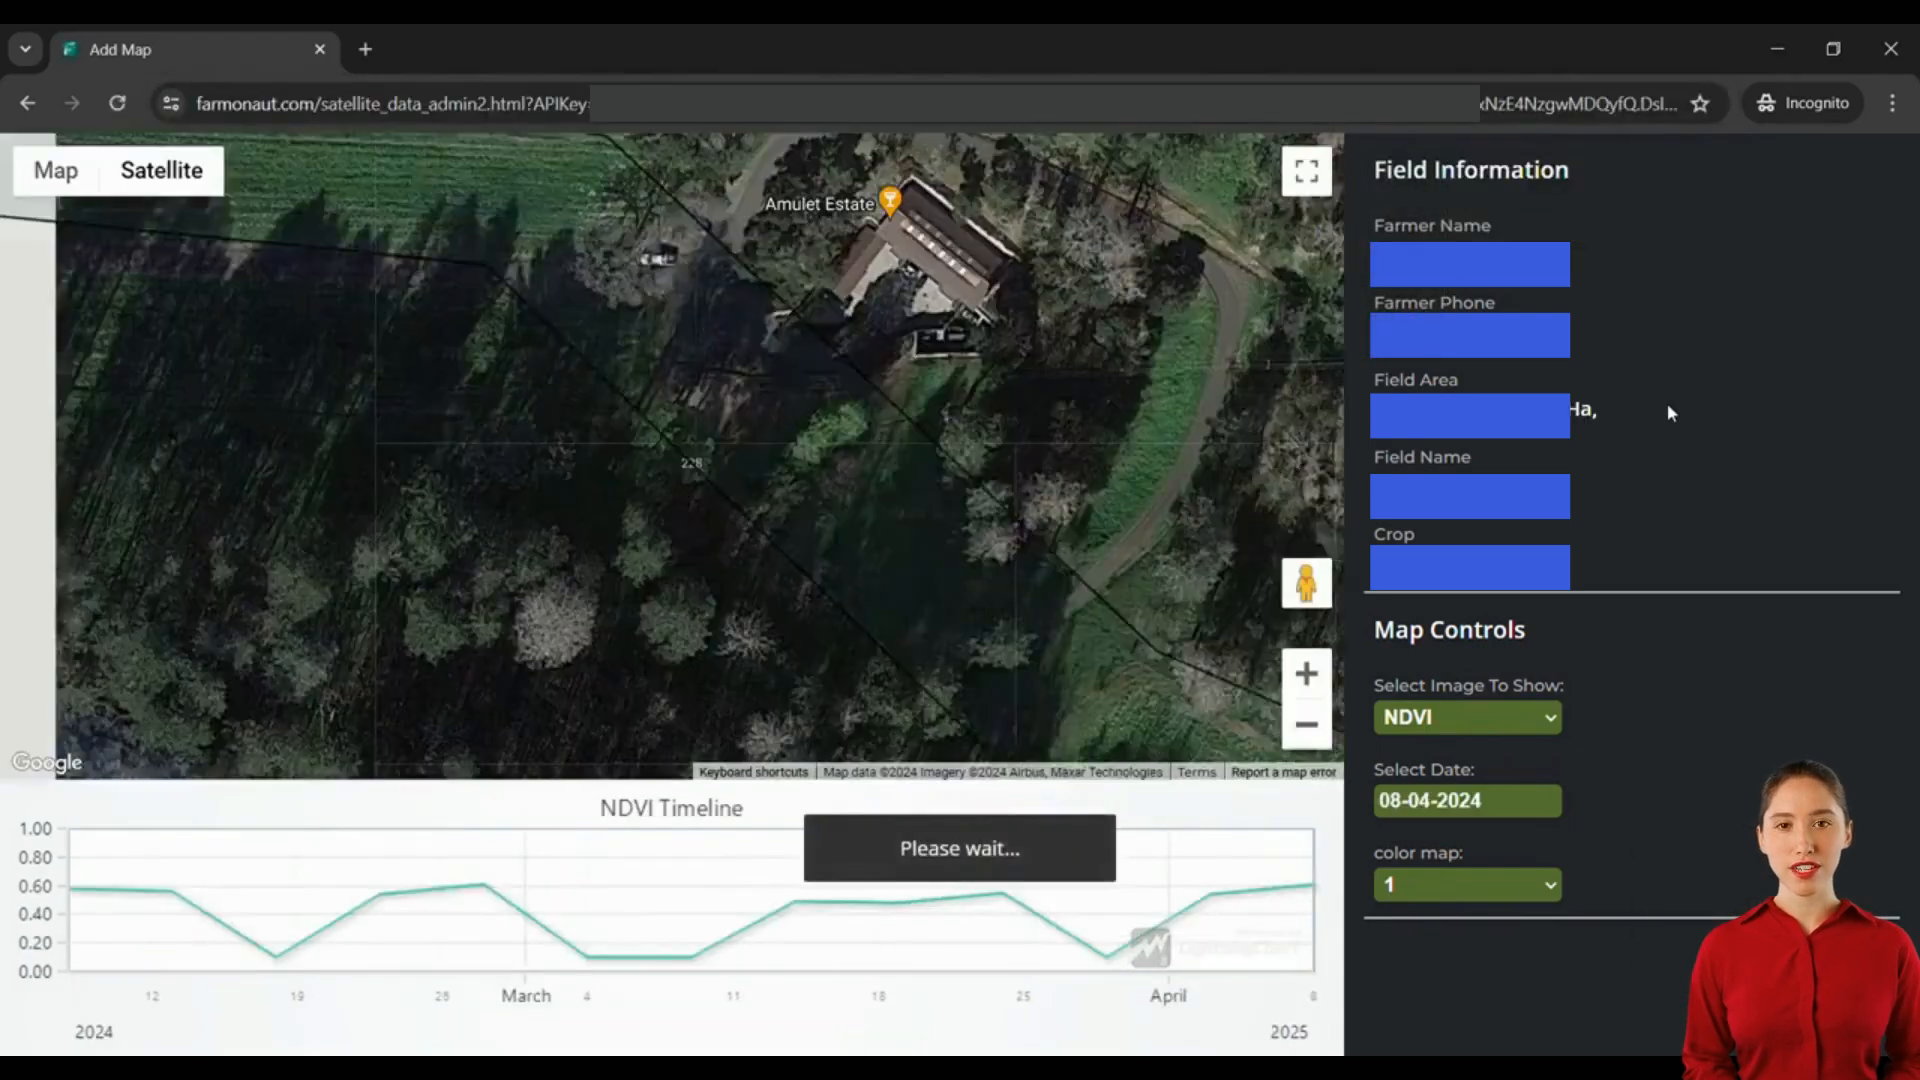
📈 Leveraging Timeline Charts for Historical Analysis
One of the most powerful features of the iFrame integration is the timeline chart. This tool plots index values of selected image types across different satellite visits, enabling users to track changes over time and identify trends in crop health and field conditions.
Timeline charts can help farmers:
- Detect early signs of crop stress
- Evaluate the effectiveness of interventions
- Plan future crop rotations
- Optimize resource allocation

🌐 Integrating Field Information
The iFrame also provides access to crucial field-related information, including:
- Farmer name and contact details
- Field area and name
- Current crop type
This information can be seamlessly integrated into your iOS or web application, providing users with a comprehensive overview of their agricultural operations at a glance.
🚀 The Future of AgTech: Sustainable Agriculture through API Integration
As we look to the future, APIs are paving the way for sustainable agriculture practices. By providing developers with easy access to satellite data and advanced analytics, these APIs are enabling the creation of powerful tools that can help farmers reduce waste, optimize resource use, and increase yields.
Some local success stories of API integration in AgTech include:
- A California vineyard reducing water usage by 20%
- An Iowa corn farm increasing yield by 15% through precision fertilization
- A Texas cattle ranch optimizing grazing patterns and improving soil health
📊 AgTech Industry Statistics
To understand the impact and potential of iOS apps and web applications in the AgTech industry, let’s look at some key statistics:
| Metric | Value | Year |
|---|---|---|
| Global AgTech market size | $17.4 billion | 2021 |
| Projected CAGR | 12.1% | 2022-2030 |
| Farms using precision agriculture | 25% | 2020 |
| Increase in crop yield with precision ag | Up to 30% | 2021 |
These statistics highlight the growing importance of technology in agriculture and the potential for iOS and web applications to make a significant impact in the industry.
❓ Frequently Asked Questions
What is an iOS app for the AgTech industry?
An iOS app for the AgTech industry is a mobile application designed specifically for use on Apple devices to help farmers, agronomists, and agribusinesses manage their operations more efficiently through features like satellite imagery analysis, crop monitoring, and resource optimization.
How does satellite analysis benefit farmers?
Satellite analysis provides farmers with valuable insights into crop health, soil conditions, and water management without the need for on-site inspections. This technology enables more precise decision-making, leading to improved yields and resource efficiency.
What is the importance of API documentation in AgTech development?
API documentation is crucial for developers creating AgTech applications as it provides the necessary information to integrate satellite data and analysis tools into their apps. Well-documented APIs can significantly speed up development and ensure proper implementation of features.
How can web app development complement iOS apps in agriculture technology?
Web app development can complement iOS apps by providing cross-platform accessibility, allowing users to access data and tools from any device with an internet connection. This flexibility is particularly useful for collaborative farm management and data analysis.
What are some key features of the iFrame integration for farm visualization?
Key features of the iFrame integration include interactive satellite imagery, various image types (e.g., NDVI, NDWI), customizable color maps, timeline charts for historical analysis, and display of field-related information such as farmer details and crop types.
🎯 Conclusion: Empowering Agriculture Through Technology
The integration of satellite data visualization tools into iOS apps and web applications is revolutionizing the AgTech industry. By leveraging these powerful technologies, developers can create solutions that empower farmers to make data-driven decisions, optimize their operations, and contribute to more sustainable agricultural practices.
As we continue to innovate in this space, the collaboration between iOS development firms, web app design agencies, and agriculture technology experts will be crucial in driving the industry forward. The future of farming is digital, and it’s up to us to ensure that the tools we create are accessible, powerful, and tailored to the unique needs of the agricultural community.
If you’re ready to take your AgTech solution to the next level, consider integrating satellite data visualization into your iOS app or web application. The potential for increased efficiency, sustainability, and profitability is immense. Start exploring the possibilities today and be part of the agricultural revolution!