Farmonaut | Avoid Waterlogging and Irrigation Issues Using DEM
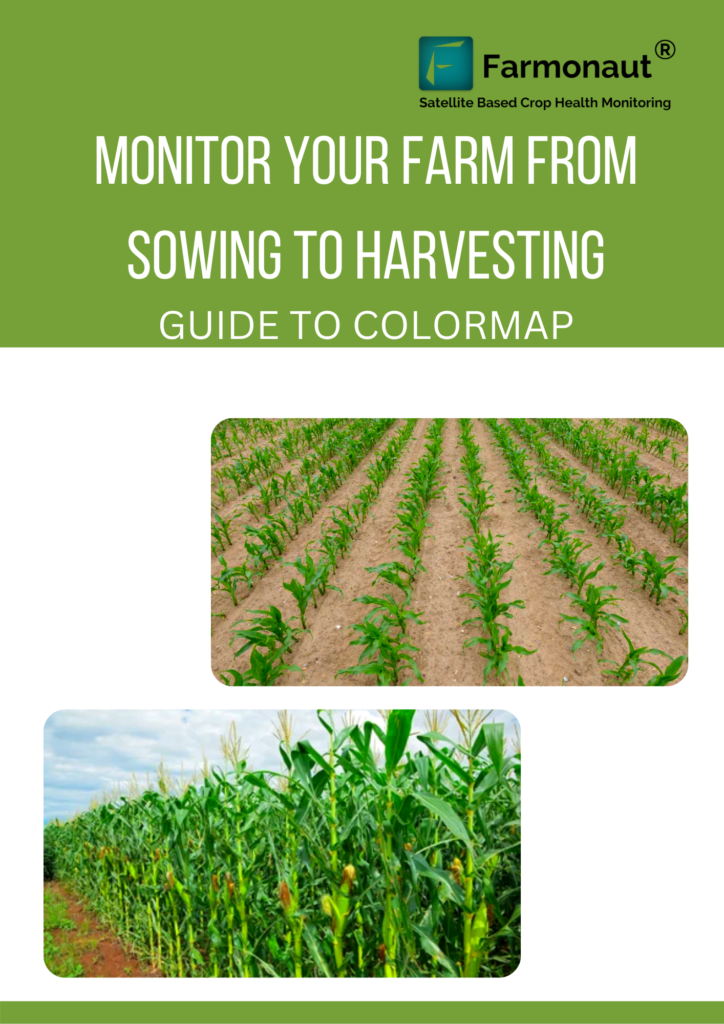
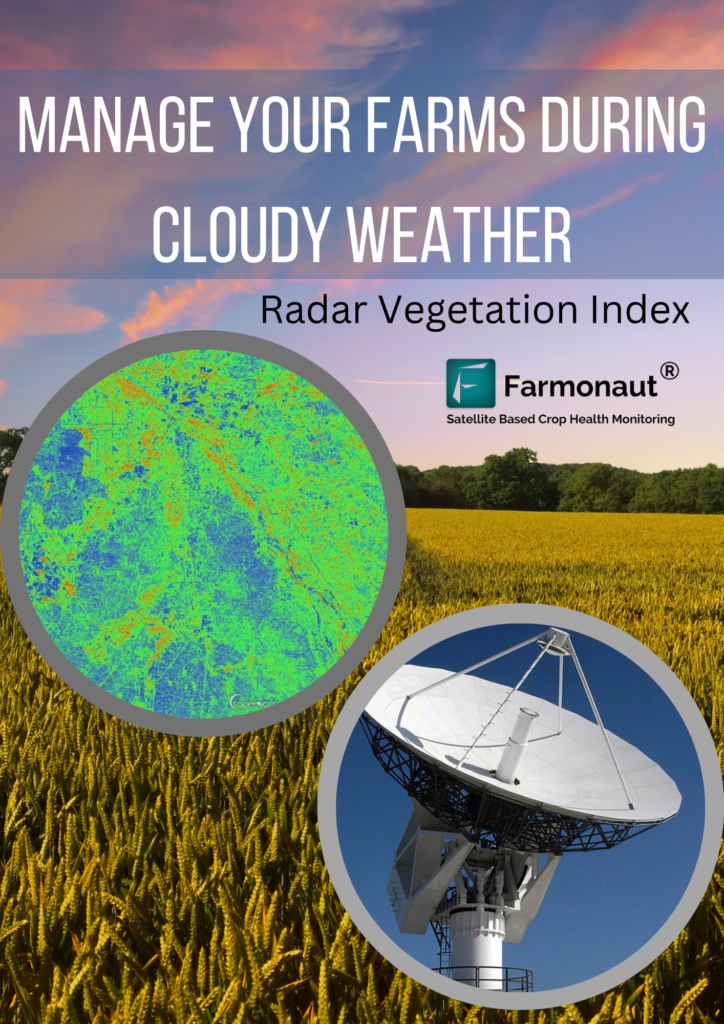
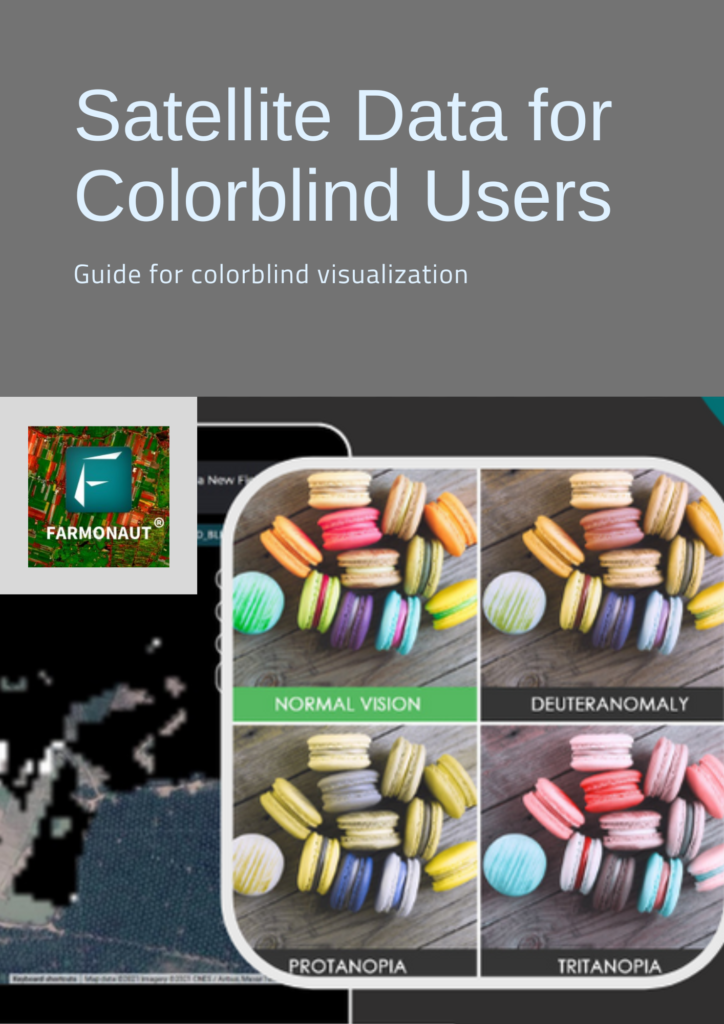
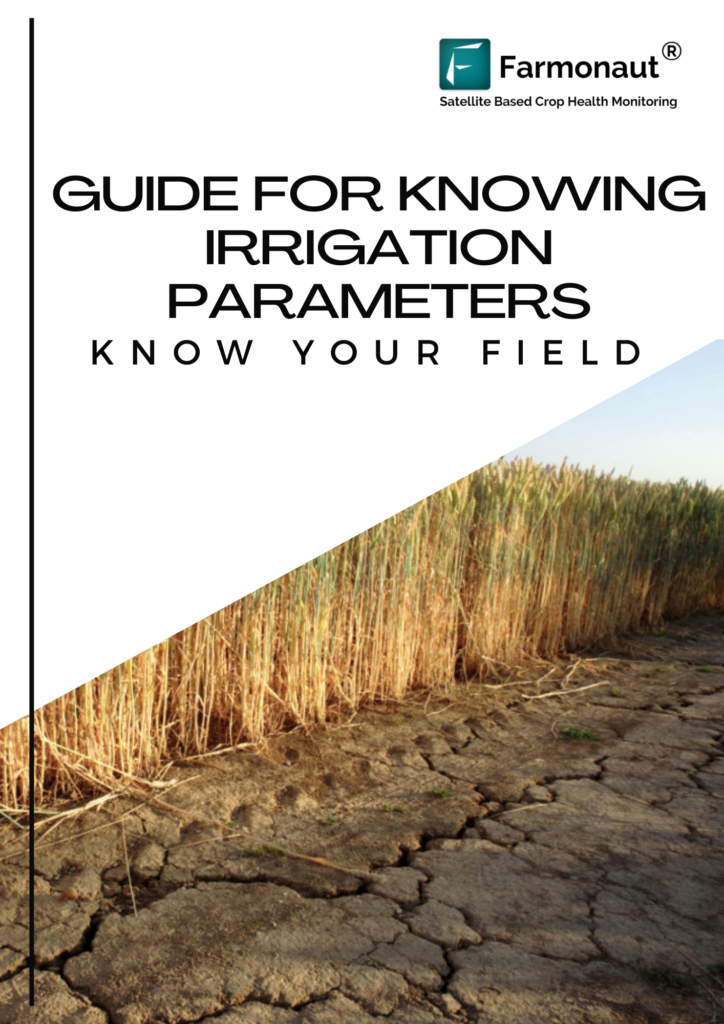
INTRODUCTION Zr3i is a digital agricultural platform that provides data to the small farmers, agriculture businesses and all workers in the agriculture sector. Zr3i has developed a website and an android application for Egypt and the Arab World that are available in Arabic language for better understanding for local farmers. “Zr3i’s main objective is to provide detailed information/reports to farmers regarding soil data, vegetation cover indicators which are necessary for increasing productivity.” The platform works on API between the Zr3i and Farmonaut (as a service provider). Hence, the developed platform majorly depends on Farmonaut Technologies. PROBLEMS FACED IN AGRICULTURE SECTOR Farmers face many problems during each stage of farming, from cultivation to harvesting. Being unaware of various weather parameters and soil parameters that affect the quality and quantity of production and decreases profit. Due to the use of traditional methods problems mainly faced are: Water Stress, Carbon level and usage of chemicals. HOW DOES ZR3I WORKS? Zr3i helps the user in providing relevant important services which would be helpful to get rid of all the problems faced during farming operations. It provides crop health analytics, weather data analytics and reports in more than 50+ languages including Arabic. Detailed Reports includes The Farmonaut helps the user of Zr3i to have detailed reports of the farm that are created by their system directly. Everytime a user visits, the system creates a detailed report which helps the farm owner to monitor all activities going on in his/her farm. The reports are generated with the help of satellite images which helps to determine the crop health and weather conditions of the farm. The crop health can easily be estimated through image colors: Light/dark Green: healthy crops. Yellow: crops that need attention. Red: Barren land. Through this color, farmers can easily open GPS and track their field using the images. The images can also be provided in the two color coding based on the height of the vegetation: Colormap 1: It is used for vegetation attending normal height. Colormap 2: It is used for vegetation having 2-3 inches height. Zr3i also provides the NDVI images, EVI images, SAVI images and AVI images that helps in the early growth stages of crops. Whereas, NDRE images are useful in the later stage of crop growth. The images helps as per following: NDVI (Normalised difference vegetative index): NDVI images help to differentiate the bare soil from forests or grassland, detect plants under stress and know the different crops and crop stages. AVI (Advanced Vegetation Index): AVI is used to study the changes in the crops and forests over time. It helps farmers through the satellite images about the various vegetation indicators. EVI (Enhanced Vegetation Index): EVI index uses additional wavelengths of light to correct NDVI errors. However, the NDVI results are very accurate in estimating crop health; there are few errors at atmospheric or ground level that affect the field results.Hence, the errors at atmospheric and ground level are corrected through EVI images. SAVI (Soil Adjusted Vegetation Index): SAVI is used to correct the NDVI index for the soil brightness in areas where vegetative cover is low. Hence, with the help of SAVI to know the soil health, schedule crop irrigation, monitor evaporation, drought and transpiration of the crops. NDRE (Normalized difference red edge) images: NDRE indexes are mainly used at the later growth stages of plants when they are mature and ready to harvest. It helps to know the amount of chlorophyll in the plants. The images such as NDWI (Normalized Difference Water index) are also provided which can be used to monitor changes in the water content and help control irrigation in real time. From the satellite images, the difference between the water level in the current soil and the water level in the actual soil is discovered and the difference between each of them is calculated to address the defect. The report also includes Carbon data also known as soil organic carbon. It helps to know which part of the farm has a low level of carbon so that required treatment can be applied. The report also helps in providing time series data. Time series data gives a sequence of data points collected over an interval of time. For example, if we need the NDWI index for the past 10 days. It can easily be accessed by providing the dates. However, the data will be displayed as values change per time. It also gives precise information if needed. If a farmer having 10,000 m2 land wants to know areas having NDVI 0.6-0.7, it can easily be obtained for increasing productivity. Farmers can also have access to the field images by just knowing the latitudes and longitudes of the farmland. Apart from this the user can also request for the historical data of the area. ACHIEVEMENTS Zr3i was shortlisted in top 10 finalist among 160 Egyptian StartUps for GDEXA | Mentoring and Skilling “Social Up for StartUp”. Zr3i is featured on a regional level across the Arab World. Zr3i is also starting digitization of the agriculture industry in Egypt with the German Government and Ministry of Agriculture. Zr3i has secured a place in the list of 9 most innovative Egyptian based Companies and Startups. Zr3i was announced as the Finalist at Northern African StartUp Awards 2021. https://www.youtube.com/watch?v=UseRL7K7Q3Ehttps://www.youtube.com/watch?v=lJ56zIdt58Yhttps://www.youtube.com/watch?v=TD43Iz68bh0https://www.youtube.com/watch?v=G2iZ-fmFnsk&t=2s