Normalized Difference Water Index - NDWI
Vegetation cover on the earth’s surface undergoes severe stress during a drought. If affected areas are not identified in time, entire crops may be damaged. Hence, the early detection of water stress can prevent many of the negative impacts on crops. NDWI index can help us control irrigation in real time, significantly improving agriculture, especially in areas where meeting the need for water is difficult.
To calculated NDWI index, we need imagery from two different wavelengths, namely Near Infrared and Shortwave Infrared band imagery. And the NDWI ratio is calculated as:
NDWI = (NIR – SWIR)/(NIR + SWIR)
A short wave infrared imagery band is used because the high absorption of light by water occurs at this wavelength. NIR band is used because water does not absorb this part of the electromagnetic spectrum, thus the calculated NDWI index is resistant to atmospheric effects, making it distinguishable from NDVI.
The NDWI index is characterized by a more stable decrease in value upon reaching critical anthropogenic load, which can give an indication of the ecological state of forests.

The value of the NDVI index can range from -1.0 to 1.0.
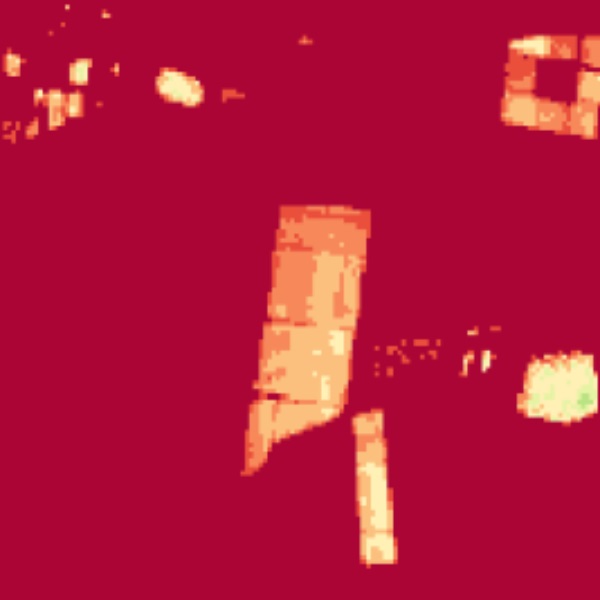
The high NDWI values correspond to high plant water content and coating of high plant fraction, whereas the low NDWI values correspond to low vegetation content and cover with low vegetation. NDWI rate will decrease during periods of water stress.
In the coming days, the Farmonaut’s Satellite Imagery for Farmers application will expand to include more remote sensing features beneficial for farmers. We will keep you posted about any new developments in this regards. Stay tuned!!
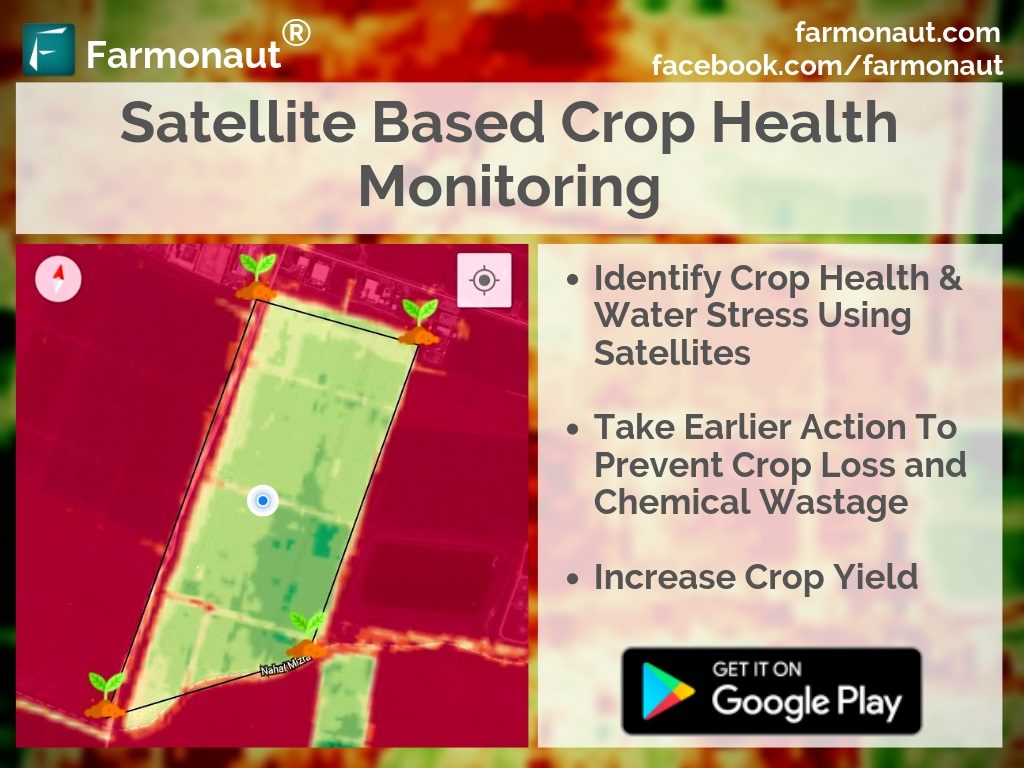
For agricultural purposes, Farmonaut provides satellite based crop health monitoring system on our android app, through which farmers can select their field and identify the regions of the field at which the crop growth is not normal. Upon identifying that region of their fields, they can simply pay a visit to that part of the field and identify if the problem has already started. If it has not, the farmer can take preventive remedies by applying more fertilizers, plant growth regulators etc. If the problem has already started, they can simply explain their problem to Farmonaut’s crop issue identification system and get real-time govt. approved remedies. The satellite imagery is updated every 2-5 days and has a resolution of 10 meters which is 2 times better than google maps in rural India.

The app is available for android on Google PlayStore:
https://play.google.com/store/apps/details?id=com.farmonaut.android
We will keep posting about any such informative information on to our blogs, to help as many people as possible. Farmonaut is built upon a vision to bridge the technological gap between farmers and strives to bring state-of-the-art technologies in the hands of each and every farmer. For any queries/suggestions, please contact us at [email protected].
We have some more interesting articles coming up soon. Stay tuned!
Wait!!
Before that…
Follow us at:
Facebook: https://facebook.com/farmonaut
Instagram: https://instagram.com/farmonaut
Twitter: https://twitter.com/farmonaut
LinkedIn: https://www.linkedin.com/company/farmonaut/
Pinterest: https://in.pinterest.com/farmonaut/
Tumblr: https://farmonaut.tumblr.com/
Youtube: https://www.youtube.com/channel/UCYWOOPPKATLgh4L6YRlYFOQ
AppLink: https://play.google.com/store/apps/details?id=com.farmonaut.android
Website: https://farmonaut.com
Satellite Imagery: https://farmonaut.com/satellite-imagery
Satellite Imagery Samples: https://farmonaut.com/satellite-imagery-samples