Precision agriculture is the use of technology to manage crops more efficiently and sustainably. One of the key tools used in precision agriculture is satellite imagery. Satellite imagery can be used to create maps of crop health and yield potential, which can help farmers make better decisions about how to manage their crops.
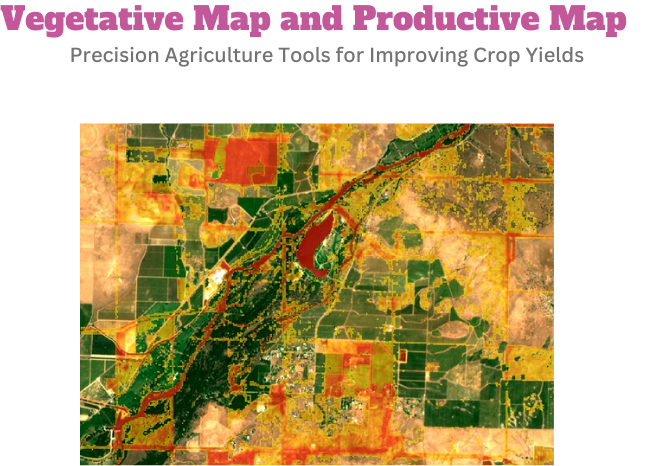
Farmonaut with the aim of promoting precision agriculture uses satellite imagery to create two types of maps the Vegetative Map and the Productive Map.
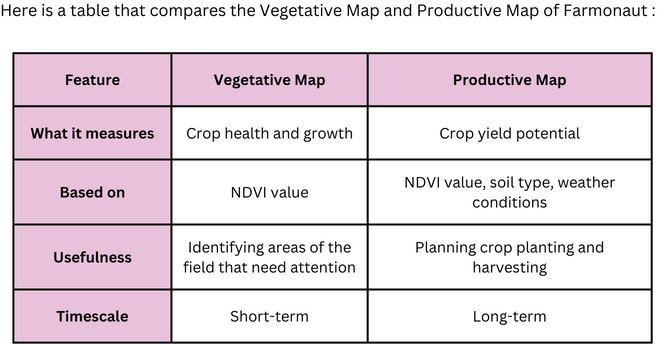
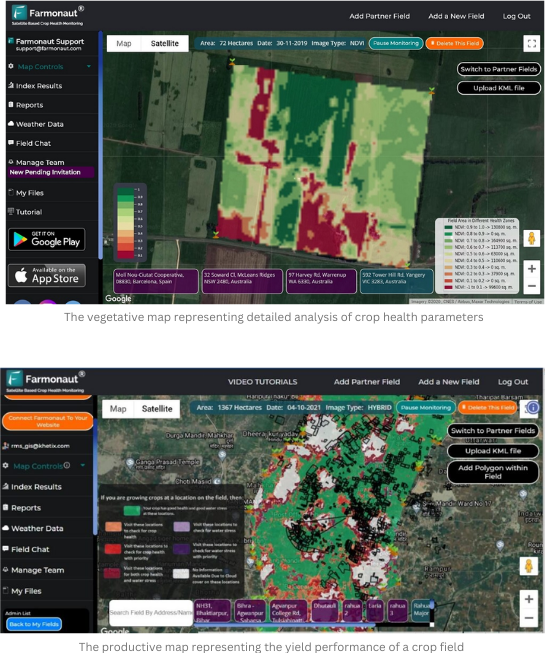
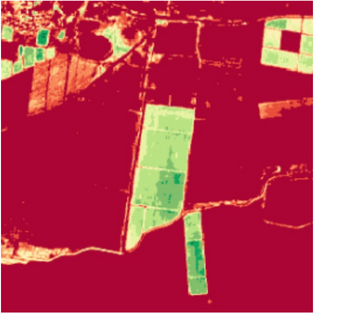
The Vegetative Map shows the health and growth of the crop, based on the NDVI (Normalized Difference Vegetation Index) value of each pixel in the image. The NDVI value is a measure of how much green vegetation is present in a pixel. A higher NDVI value indicates healthier and more vigorous vegetation.
The Productive Map shows the potential yield of the crop, based on the NDVI value, the soil type, and the weather conditions. The Productive Map can be used to identify areas of the field that are underperforming, so that farmers can take corrective action.
Normalized Difference Vegetation Index - NDVI
NDVI assesses the condition of plant health by analyzing how plants reflect light at specific wavelengths. While these light wavelengths are not directly visible to us, everything in our environment, including plants, reflects light across both visible and non-visible spectrums. By quantifying the extent to which particular wavelengths are reflected, we gain insights into the present state of the plants. This technique allows us to indirectly gauge the health of plants based on their light reflection patterns.
The NDVI image differs in the Productive and Vegetative Map of Farmonaut in the following ways:
The Productive Map uses the NDVI value, the soil type, and the weather conditions to estimate the yield potential of the crop.
The Vegetative Map only uses the NDVI value to measure the health and growth of the crop.
In general, the Vegetative Map is more useful for short-term decision-making, such as identifying areas of the field that need to be irrigated or fertilized. The Productive Map is more useful for long-term planning, such as planning crop planting and harvesting.
Here are some examples of how the Vegetative Map and Productive Map can be used by farmers:
Identifying areas of stress or poor health. The Vegetative Map can be used to identify areas of the field that are stressed or unhealthy. This information can be used to irrigate or fertilize those areas to improve crop health.
Planning crop planting and harvesting. The Productive Map can be used to plan crop planting and harvesting. For example, if an area of the field has a high NDVI value, it may be a good place to plant a high-yield crop. The farmer can also use the Productive Map to plan the timing of harvesting, so that the crop is harvested at its peak yield.
Monitoring crop progress over time. The Vegetative Map and Productive Map can be used to monitor the progress of a crop over time. This can be helpful for identifying areas of the field that are not performing as expected, so that corrective action can be taken early.
Identifying and addressing problems early on. The Vegetative Map and Productive Map can be used to identify and address problems early on. For example, if a crop is not growing as quickly as expected, the farmer can use the Vegetative Map to see if there is a problem with the soil quality or water availability.
Overall, the Vegetative Map and Productive Map are powerful tools that can help farmers improve crop yields and profitability.