Normalized Difference Vegetation Index – NDVI
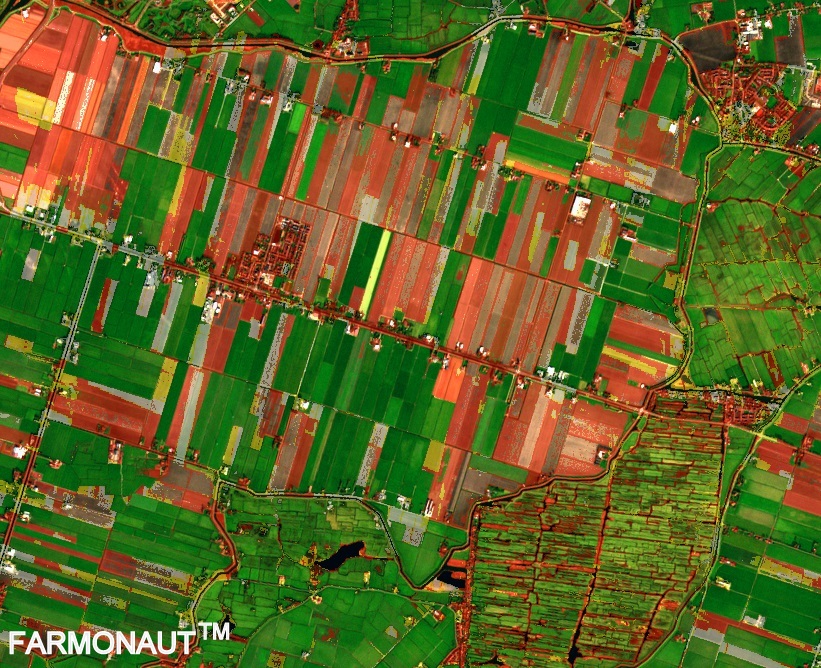
Normalized Difference Vegetation Index – NDVI It has been quite a long time since scientists and agronomists are using Normalized Difference Vegetation Index (NDVI) to monitor and examine health of crops. The extent and benefits of NDVI have increased manifold with so many earth mapping satellites being launched every year to monitor earth’s surface in different wavelengths. To calculated NDVI index, we need imagery from two different wavelengths, namely Near Infrared and Red band imagery. And the NDVI ratio is calculated as: NDVI = (NIR – RED)/(NIR + RED) From this formula, it is apparent that the density of vegetation (NDVI) at a given point in the generated image is equal to the difference in the intensities of reflected light in the red and infrared range divided by the sum of these two intensities. The value of the NDVI index can range from -1.0 to 1.0. The negative NDVI values are mainly due to clouds, snow and water. The values of NDVI close to zero are mainly due to rocks and bare soil. NDVI values ranging from 0 to 0.1 correspond to sand, snow or empty areas of rocks. NDVI values ranging from 0.2 to 0.3 represent shrubs and meadows, and NDVI values ranging from 0.6 to 0.8 indicate tropical and temperate forests. In simple words, NDVI measures status of plant health based on how plants reflect light at certain frequencies. Though we cannot perceive it with our eyes, everything around us (including plants) reflect wavelengths of light in visible and non-visible spectrum. Taking into account how much amount of a certain wavelength is reflected, we can access the current status of plants. We know that plants have chlorophyll which absorb sunlight for photosynthesis .Chlorophyll immensely absorbs visible light (0.4 to 0.7 microns) for photosynthesis, whereas structure of cells of leaves immensely reflect near-infrared light (0.7 to 1.1 microns). If a plant is healthy, it will have large amount of chlorophyll on it’s leaves and will absorb good amount of visible light from 0.4 to 0.7 microns and reflect quite less of it and vice-versa. Farmonaut’s Crop Health Monitoring system is provided to farmers and monitors how much sunlight is reflected by the plants. We take into account this basic principle in identifying crop health status of an agricultural land. For research purposes (non-farming usage), Farmonaut provides access to satellite imagery of any place around the through our android app. For agricultural purposes, Farmonaut provides satellite based crop health monitoring system on our android app, through which farmers can select their field and identify the regions of the field at which the crop growth is not normal. Upon identifying that region of their fields, they can simply pay a visit to that part of the field and identify if the problem has already started. If it has not, the farmer can take preventive remedies by applying more fertilizers, plant growth regulators etc. If the problem has already started, they can simply explain their problem to Farmonaut’s crop issue identification system and get real-time govt. approved remedies. The satellite imagery is updated every 2-5 days and has a resolution of 10 meters which is 2 times better than google maps in rural India. The app is available at: https://farmonaut.com/app_redirect We will keep posting about any such informative information on to our blogs, to help as many people as possible. Farmonaut is built upon a vision to bridge the technological gap between farmers and strives to bring state-of-the-art technologies in the hands of each and every farmer. For any queries/suggestions, please contact us at [email protected]. We have some more interesting articles coming up soon. Stay tuned! Wait!!