With iOS app, we have redesigned the user interface completely. The following document gives a brief overview about various functions available on the app.
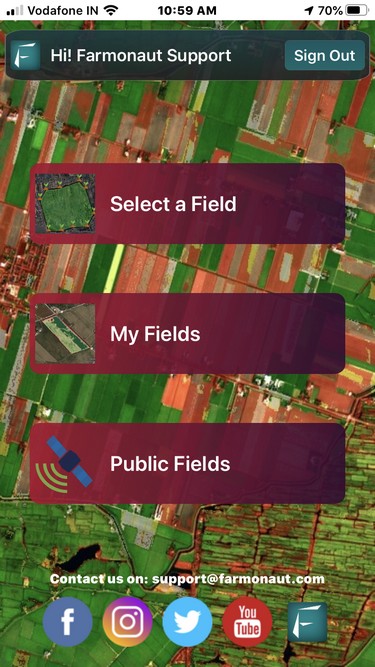
The app has three main buttons on the main Screen.
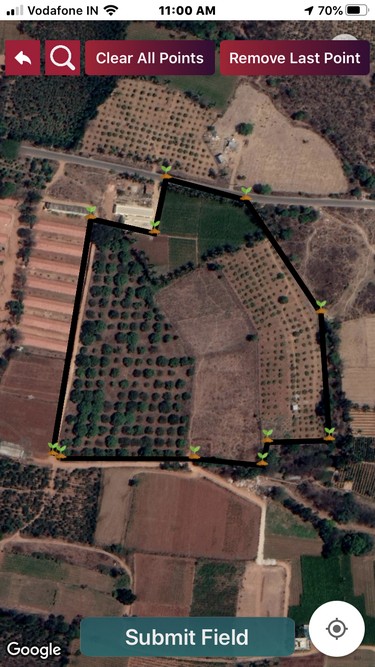
Button 1:Select a field: By clicking on this button, the user will be taken to another screen on which they can select the boundary points of a region they want to be monitored through satellites. A point can be selected on the map by long pressing on the screen for about 1 second. At least three points must be selected. Once the points are selected, the user will click on the submit button. At this point, our server will generate metadata of the selected field including the approximate field area of the bounded region. According to the field area, the payment screen will appear through which user will have to select one of the four options (1 month, 3 months, 6 months, 12 months) depending upon the cultivation cycle of the user.
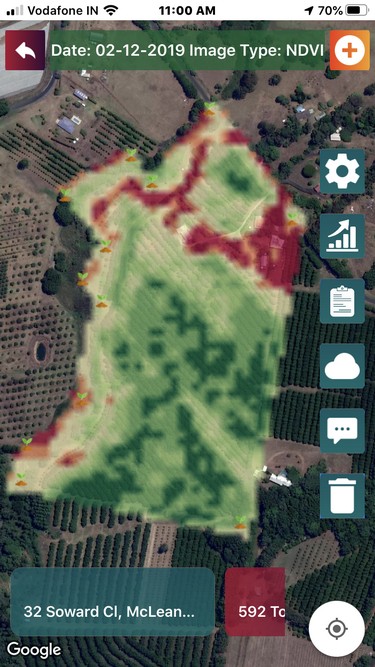
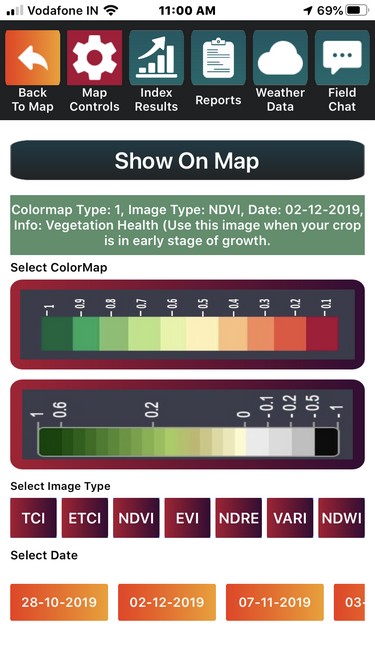
Button 2:My Fields: The button opens another screen on which the field results are visualized on the map. If the user has multiple fields, they can toggle between results of multiple fields from the field addresses given at the bottom of the screen. On the right side, there are buttons of : Map Controls, Index Results, Reports, Weather Data and Field Chat.
Map Controls: From map controls, users can choose a. which index result to display on the map, b. the date of the satellite visit of the results, c. the colormap of the displayed result. By clicking the “show on map” button, the results of the selected option will be displayed on the map.
Index Results: On this screen, a line graph is displayed of several indices, providing a time series analysis of the field.
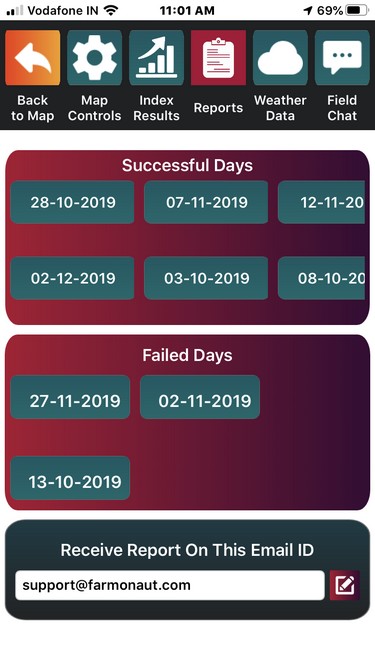
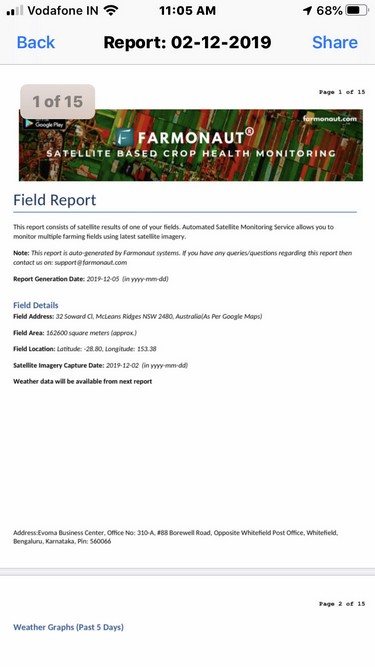
Reports: On this screen, the dates for which the reports are available is displayed. These dates are listed in two different categories: successful days and failed days. Successful days are the days on which the satellite was able to capture results of the field successfully. Failed days are the days on which the satellite was not able to capture results of the field due to cloud cover. By clicking on any on the dates, the report will be displayed on the app.
Weather Data: This screen provides the current weather data as well as weather forecast of the field (7 days forecast).
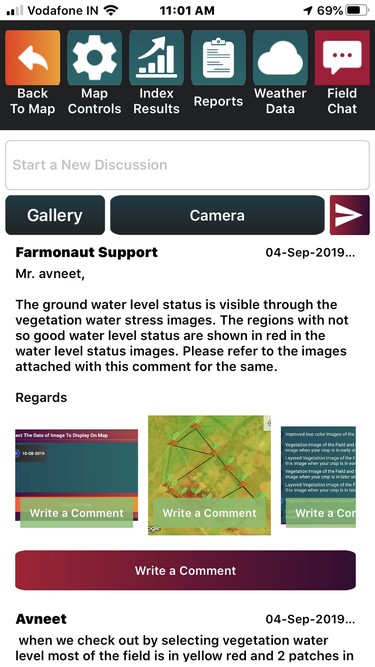
Field Chat: On this screen, users can start discussion about their fields (problems, solutions etc) with other community members. Users can upload field images too with the post and comment on the posts as well as the individual images.
Button 3: Public Fields: This screen consists of a list of our farmers who have voluntarily made their field data public so that the other farmers can see the progress of these farmers through time. By clicking on the address of the public field, user will be directed to the map on which the field results will be displayed.
The app is available on the Apple App Store.
We will keep posting about any such informative information on to our blogs, to help as many people as possible. Farmonaut is built upon a vision to bridge the technological gap between farmers and strives to bring state-of-the-art technologies in the hands of each and every farmer. For any queries/suggestions, please contact us at [email protected].
We have some more interesting articles coming up soon. Stay tuned!