

Midwest Soybean Growth Stages: A Precision Farmer’s Guide
Reviewed August 2026 against USDA NASS, USDA ERS, and USDA AMS.
Try it: Run your own numbers →
The soybean crop’s yield is decided at two narrow windows: flowering (R1-R2) and seed fill (R5-R6). Defoliation at R2 costs about 6% of yield per 50% leaf loss, but the same 50% defoliation at R5 costs far more — Bayer Crop Science’s yield-component research puts full (100%) defoliation at R5 at a 75% yield loss.1 That thirteen-fold difference between stages is the single fact that should drive every scouting and irrigation decision a Midwest soybean grower makes between planting and harvest.
This guide walks through the growth-stage calendar, what USDA NASS actually recorded for the 2025 crop, what a bushel is fetching at Illinois elevators right now, and where satellite monitoring and other precision-ag tools change the economics of watching a field. It also covers soybean maturity group selection for the Upper Midwest, since “midwest soybean varieties” and “precision soybean” are really the same question asked two different ways: which variety, planted when, managed how.
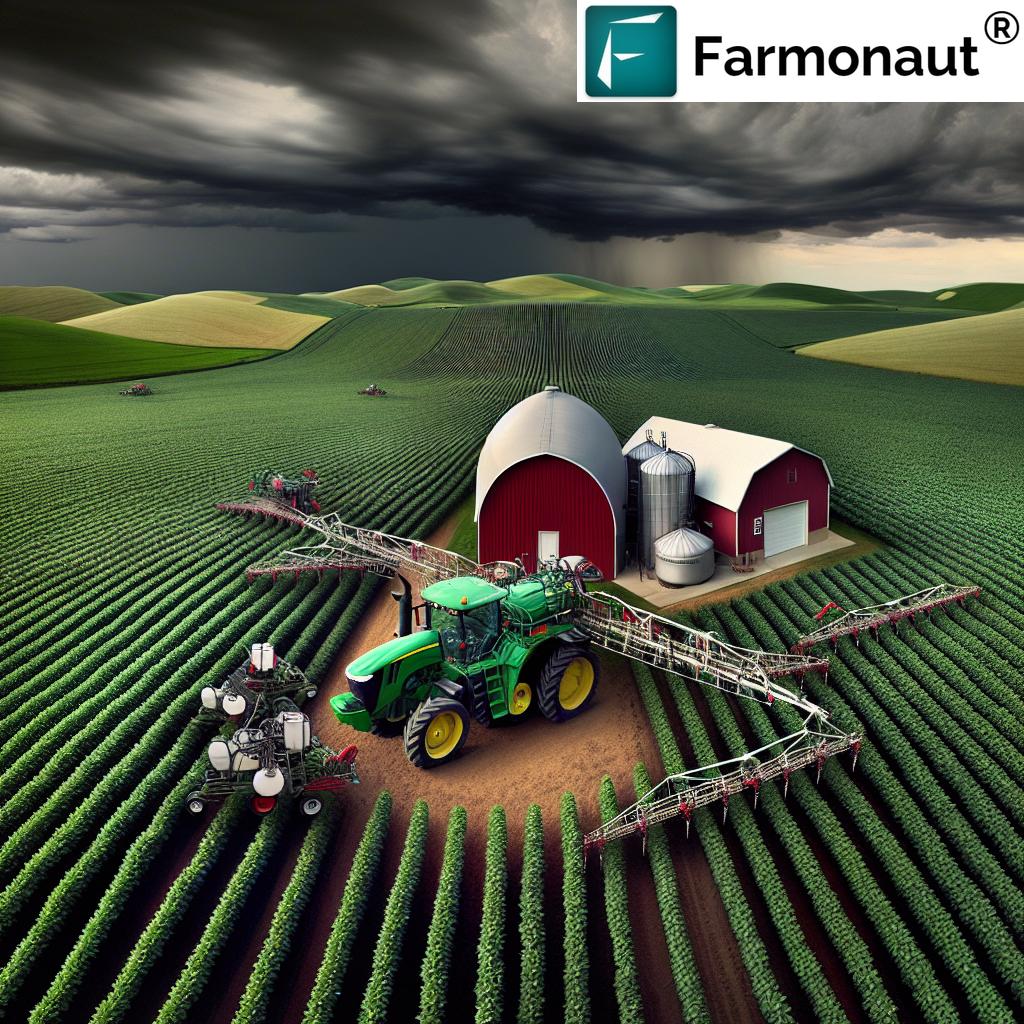
Where the 2025 Crop Landed, and What It Means for This Season
USDA NASS recorded a national average soybean yield of 53 bushels per acre for the 2025 crop year — a record high, according to farmdoc daily’s analysis of the county-level NASS release.2 That single number is worth sitting with: it means the varieties, planting windows, and in-season management choices Midwest growers made in 2025 worked, on average, better than any year on record. It is also a moving target — NASS re-surveys every year, so the figure to check for the current crop is the county-level report at the link below, not last year’s headline.
Cash price tells the other half of the story. On August 10, 2026, Illinois country elevators were bidding $11.67 per bushel for soybeans, per USDA AMS’s daily state grain bids.3 USDA AMS republishes this figure daily; if you’re penciling out a marketing decision, pull the current day’s bid rather than reusing this one — a few weeks of basis movement can shift it materially.
Midwest Soybean Varieties and Maturity Groups
Soybean varieties across the U.S. are classified into maturity groups numbered 000 through 10, spanning the shortest-season lines grown in Canada down to the longest-season lines grown near the Gulf Coast. For the Upper Midwest, Pioneer’s agronomy guidance recommends Maturity Group 2 (MG2) varieties as the default fit for the region’s frost-limited growing season.4 Moving even one maturity group later than your local recommendation risks the crop still filling seed when the first frost hits; moving a group earlier gives up yield potential the longer season would have supported.
USDA has bred slow-wilting, drought-tolerant germplasm lines — PI 567690 and PI 597731 — that have been transferred to private seed companies for commercial breeding programs. What isn’t publicly published is which commercial varieties descend from those lines, or what acreage share they hold in Iowa, Minnesota, or Illinois today. If drought tolerance is a purchasing criterion, ask your seed dealer directly which hybrids in their current lineup carry slow-wilting parentage, since USDA does not maintain a public variety-by-variety adoption table.

Critical Growth Stages of Soybeans: A Reference Table
Soybean development runs on two numbering systems: vegetative (V) stages counted by leaf nodes, and reproductive (R) stages counted from first flower to full maturity. The table below is the working reference — the days-after-planting column is an estimate that shifts with soil temperature and variety maturity group, so treat it as a planning window, not a calendar date.
| Growth Stage | Estimated Days After Planting | Critical Factors | Management Recommendations |
|---|---|---|---|
| Emergence (VE) | 5-10 days | Soil temperature, moisture | Monitor for seedling diseases, adjust planting depth |
| Vegetative (V1-V5) | 15-30 days | Nutrient uptake, weed competition | Implement early-season weed control, monitor for pests |
| Flowering (R1-R2) | 45-60 days | Drought sensitivity, pollination; 6% yield loss per 50% defoliation1 | Ensure adequate irrigation, consider foliar fertilizers |
| Pod Development (R3-R4) | 65-80 days | Pod set, stress vulnerability | Monitor for pod-feeding insects, maintain soil moisture |
| Seed Fill (R5-R6) | 80-110 days | Nutrient demand, disease risk; 75% yield loss at 100% defoliation1 | Apply fungicides if needed, maintain optimal soil moisture |
| Maturity (R7-R8) | 110-120 days | Drying conditions, harvest timing | Plan for timely harvest, monitor moisture levels |
The stage-to-stage jump in stakes is the part a generic growth-stage chart won’t tell you: identical leaf damage costs roughly twelve to thirteen times more yield at R5 than at R2, per Bayer’s yield-component data.1 That’s the whole argument for scouting harder, not less, as the season goes on — most operations do the opposite, tapering field visits once the crop “looks made.”
Drought Risk Through the Reproductive Window
Drought stress doesn’t hit a soybean crop evenly across the season — it concentrates its damage at R1-R2 and R5-R6, the two windows in the table above where the plant is setting pods or filling seed and has the least buffer against water shortfall. Published USDA figures on the exact water requirement in millimeters per week during R5-R6 are not available for this article; the operational workaround is to track soil moisture directly rather than estimate from rainfall totals, since a satellite or in-field soil-moisture reading tells you what the crop actually experienced, not what a rain gauge three miles away recorded.
What Drives the Damage
- Stunted plant growth and reduced pod development during R1-R4
- Decreased seed size and quality when stress hits during R5-R6
- Premature plant death in severe, prolonged cases
Because the R5-R6 defoliation-loss figure (75%) is so much steeper than the R1-R2 figure (6%), a Midwest grower deciding where to prioritize a limited irrigation pass, a scouting trip, or a fungicide application should default to protecting the seed-fill window first when the two compete for time or water.
Soil Health and the Conservation Response
Repeated drought years compound soil erosion and reduce microbial activity, which in turn narrows the soil’s own water-holding capacity the next time moisture is short. Midwest growers responding to this have leaned on conservation tillage practices specifically to rebuild the soil structure that holds water between rain events.
The Economic Side of Drought
Drought’s cost shows up in three places at once: added irrigation expense, tighter crop-insurance triggers, and price volatility as national supply estimates shift. None of those show up on a single line item, which is exactly why the yield-loss-by-stage figures above matter more than a generic “drought hurts yields” statement — they tell you where a dollar of mitigation buys the most protected bushels.

Precision Soybean Management: What the Adoption Numbers Show
“Precision soybean” production isn’t a future concept in the Midwest — it’s the majority practice. USDA’s Economic Research Service reports that automated guidance systems (GPS-steered equipment) are used on more than 50% of U.S. soybean acreage.5 That adoption threshold is the baseline a grower should measure their own operation against: if guidance, variable-rate application, and field-level monitoring aren’t part of the current program, the operation is trailing more than half its peer acreage nationally, not leading it.
The economic case behind that adoption curve is documented by the Association of Equipment Manufacturers (AEM), whose whitepaper on precision-ag benefits estimates $118,000 in annual economic value generated per 1,000 acres of row-crop land under precision agriculture practices.6 That figure blends input savings, yield gains, and labor efficiency across the technologies below — it is not one single tool’s contribution, so treat it as the ceiling case for a fully-implemented program, not the expected return from any single purchase.
Satellite-Based Crop Monitoring
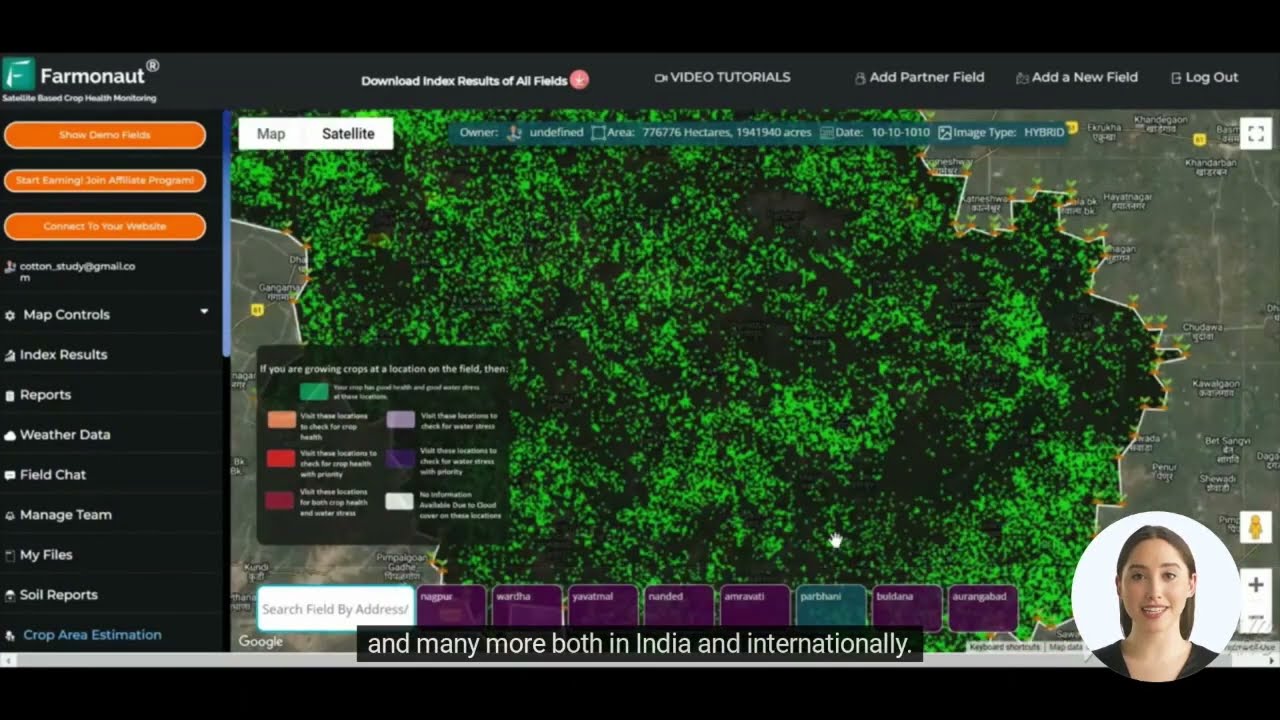
Satellite imagery and remote sensing give a field-by-field view between scouting trips. Platforms like Farmonaut provide NDVI-based crop health mapping, soil moisture monitoring, and early pest and disease flagging — closing the gap between the 6%-loss stage and the 75%-loss stage described above, since the value of catching a problem is highest exactly when the crop is least forgiving.
- NDVI (Normalized Difference Vegetation Index) mapping for assessing crop health
- Soil moisture monitoring to guide irrigation decisions
- Early detection of pest infestations and disease outbreaks
Explore Farmonaut’s API for advanced satellite data integration

Variable Rate Technology (VRT)
VRT lets a grower apply fertilizer, seed, and pesticide at rates that change across a field rather than a single blanket rate, working from the same soil and yield maps that inform the guidance adoption figures above.
- Precision fertilizer application based on soil nutrient maps
- Variable rate seeding to optimize plant populations
- Targeted pesticide application reducing overall chemical use
AI-Powered Decision Support
Farmonaut’s Jeevn AI advisory system layers predictive analytics on top of the satellite feed, translating an NDVI drop or a soil-moisture reading into a specific crop management action rather than leaving the grower to interpret a raw map.
- Predictive analytics for yield forecasting
- AI-driven pest and disease identification
- Optimal planting and harvesting date recommendations
Access Farmonaut’s API Developer Docs for custom integrations
Stage-Loss Calculator: What a Defoliation Event Costs You, By Stage
The 6%-versus-75% gap between R2 and R5 defoliation loss is easy to state and hard to feel until it’s your acreage and your bushel price. Enter your field size, expected yield, current bid, and an estimated defoliation percentage below to see the dollar difference between a stress event at flowering and the same event at seed fill.
Run your own numbers
Assumptions: loss percentages are linearly scaled from Bayer Crop Science's two published reference points (6% loss at 50% defoliation at R1-R2; 75% loss at 100% defoliation at R5-R6) and are an approximation, not a field-tested regression. The calculator does not account for compounding stresses like concurrent drought, disease, or replanting costs, and does not adjust for maturity group or local agronomic conditions.
Sustainable Farming Practices Feeding Into the Precision Program
Precision technology and soil conservation aren't competing priorities on a Midwest operation — variable-rate maps and satellite monitoring are what make conservation practices measurable rather than anecdotal. Farmers pursuing broader sustainability goals are combining the two.
Conservation Tillage
- Reduces soil erosion and improves water retention
- Increases organic matter in soil over time
- Lowers fuel consumption and labor costs
Cover Cropping
- Improves soil health and biodiversity
- Reduces nutrient runoff and erosion
- Provides natural weed suppression between soybean rotations
Integrated Pest Management (IPM)
- Reduces reliance on chemical pesticides
- Promotes beneficial insect populations
- Lowers environmental impact and production costs

Technology Stack: Weather, Drones, and IoT Alongside Satellite Data
Real-Time Weather Monitoring
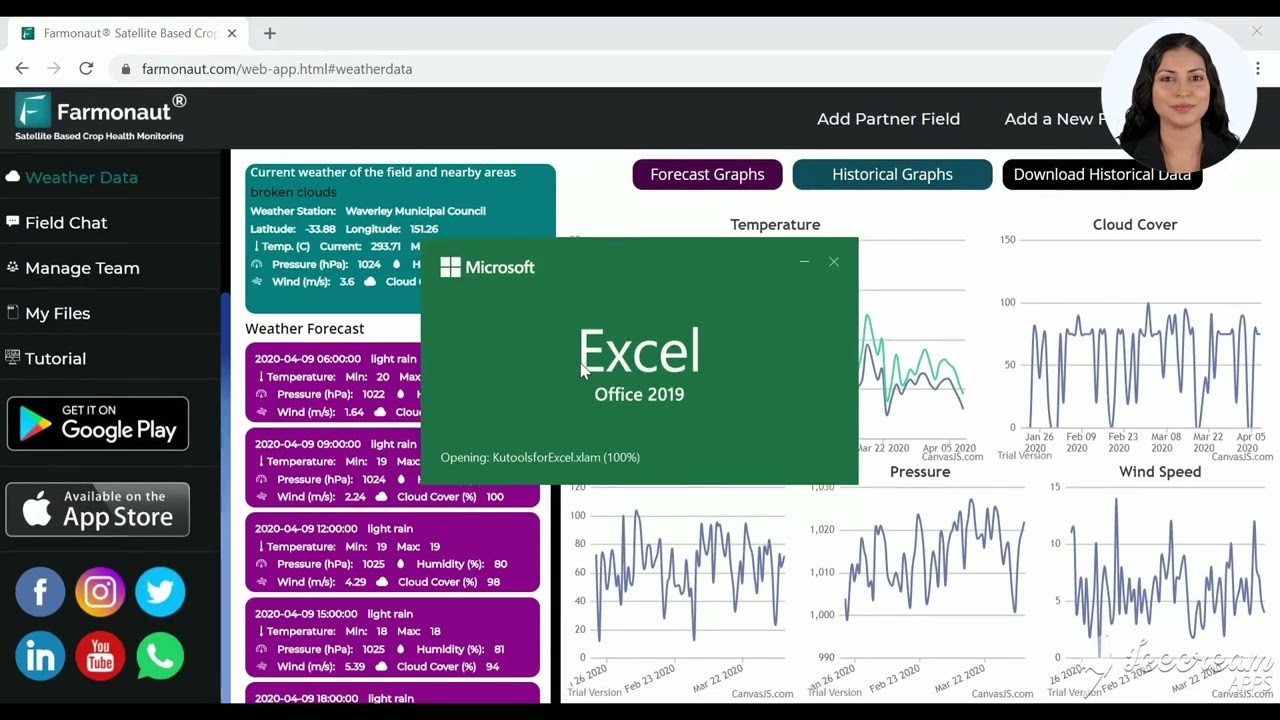
Hyper-local weather forecasts and historical weather archives let a grower cross-reference an NDVI dip against actual rainfall and temperature at that field, rather than the nearest airport station.
- Customized weather alerts for critical events
- Integration of weather data with crop models for yield predictions
- Historical weather analysis for long-term planning
Drone Technology
Where satellite imagery gives broad, repeat coverage, drones fill in with high-resolution, on-demand detail for the specific spot a satellite pass flagged as worth a closer look.
- Precise crop scouting and damage assessment
- Generation of 3D field maps for drainage planning
- Targeted application of inputs in hard-to-reach areas
IoT Sensors and Smart Equipment
Smart farming equipment and in-field IoT sensors close the loop between a satellite-flagged zone and the machine that treats it.
- Soil moisture sensors for optimized irrigation
- Smart sprayers for precise pesticide application
- Automated tractors and harvesters for increased efficiency

Where Midwest Appraisals Fit — And Where They Don't
Farmland appraisals intersect with soybean production data at exactly one point: county-level and state-level yield figures, like the 53 bu/acre 2025 NASS average cited above, feed into the income-capitalization approach some appraisers use to value cropland. Beyond that, farmland appraisal is a distinct discipline — comparable sales, soil productivity ratings, and local market conditions drive most valuations, and none of the research gathered for this article covers appraisal methodology, per-acre land values, or appraiser licensing. A grower or landowner needing an actual appraisal should engage a certified agricultural appraiser or their county assessor's office rather than relying on yield data alone; this article's scope is production agronomy, not real estate valuation.
Market Trends and Export Opportunities
Global demand for soybeans continues to be shaped by feed and food use in Asia, biofuel-feedstock demand, and plant-based protein growth. Iowa and Illinois producers, with established export infrastructure and consistently strong yields, are positioned to supply that demand — though specific export-volume or destination-share figures for the current marketing year weren't part of the research gathered here; USDA's Foreign Agricultural Service publishes updated export sales data on a weekly basis for growers tracking that specific number.
Value-Added Products
- Growing market for specialty soybean varieties
- Opportunities in soybean oil and meal production
- Emerging markets for soy-based industrial products

What's Next: Breeding, Traceability, and Carbon Programs
USDA's slow-wilting germplasm lines (PI 567690, PI 597731) represent the breeding pipeline's current drought-tolerance frontier, now in private companies' hands for commercial variety development — watch your seed dealer's variety sheet for parentage disclosures rather than a USDA acreage report, since none is published at variety level.
Traceability is moving in parallel: blockchain-based systems are extending traceability in agriculture from farm to end buyer, adding transparency that export buyers increasingly ask for. And carbon markets are giving Midwest growers a new revenue line for practices already covered above — conservation tillage and cover cropping chief among them — as part of a broader shift toward regenerative agriculture practices.
Conclusion: The Durable Checklist
Numbers will move every season — next year's NASS yield average, the elevator bid on the day you read this, the exact adoption percentage for guidance systems. What doesn't move is the underlying method:
- Know your stage. Use the V/R stage table to identify whether the crop is in a low-stakes window (early vegetative) or a high-stakes one (R1-R2, R5-R6).
- Weight your response by stage. The same stress event costs roughly twelve to thirteen times more yield at R5 than at R2 — protect seed fill first when resources are limited.1
- Verify with data, not memory. Pull the current NASS county yield report and the day's elevator bid rather than reusing last season's numbers.
- Match technology to adoption reality. Guidance systems are past 50% adoption on soybean acreage nationally — treat that as the floor, not the ceiling, for your own program.5
- Confirm variety fit before you confirm drought tolerance. Maturity group (MG2 for the Upper Midwest) is a published, verifiable recommendation; specific drought-tolerant variety adoption is not yet publicly tracked by acreage.
By combining precision agriculture solutions like satellite monitoring with this stage-by-stage discipline, Midwest soybean operations can direct scouting time, irrigation, and fungicide budget at the windows where they actually move the yield number — rather than spreading effort evenly across a season that isn't evenly weighted.
Further reading:
FAQ Section
- What are the most critical growth stages for soybeans?
Flowering (R1-R2) and seed fill (R5-R6) carry the highest stakes. Bayer Crop Science data shows 50% defoliation at R2 costs about 6% yield, while 100% defoliation at R5 costs about 75% — a roughly twelve-to-thirteen-fold difference in stakes between the two stages. - What soybean maturity group should Midwest farmers plant?
USDA/Pioneer agronomy guidance recommends Maturity Group 2 (MG2) for the Upper Midwest, within the broader 000-10 national maturity group range. Check with your local extension office or seed dealer for county-specific fit, since frost-date risk varies within the region. - How can precision agriculture help manage drought risk?
Satellite-based NDVI and soil-moisture monitoring flag stress before it's visible on the ground, and USDA ERS data shows automated guidance systems are already used on over 50% of U.S. soybean acreage — precision tools are the norm, not the exception, for growers managing this risk. - What is the current U.S. soybean yield and price?
USDA NASS recorded a record national average of 53 bu/acre for the 2025 crop. Illinois country elevators bid $11.67/bu on August 10, 2026, per USDA AMS. Both figures update on a regular cycle — check the linked NASS and AMS sources for the current numbers. - Do farmland appraisals belong in a soybean growth-stage discussion?
Only at the margin: county yield averages feed into some income-based appraisal approaches, but appraisal methodology itself (comparable sales, soil ratings, licensing) is a separate discipline from production agronomy and isn't covered by the research behind this guide.
1. Bayer Crop Science: Yield Components of Soybean R1 to R2 Growth Stages
2. University of Illinois farmdoc daily: 2025 NASS County Corn, Soybean, and Winter Wheat Yields
3. USDA AMS via IndexBox: Daily State Grain Bids Report
4. USDA/Pioneer Seeds agronomy guidance on soybean maturity groups
5. USDA Economic Research Service: Precision Agriculture Adoption Chart
6. Association of Equipment Manufacturers (AEM): The Benefits of Precision Ag in the U.S.
Discussion
Questions, corrections or field experience? Share them below. First-time comments are reviewed before they appear, and your email is never published.
No comments yet. Be the first to add a question or your experience.

 Dreamz Tech
 Wild Oak Farm
 SFX
SFX BACF Africa
 Doodlakine
 Exurbia Geospatial
 FieldZero
 Indico Company
 Kubota
 FFBS
FFBS Jontra
 Tucor
Tucor
