Mastering NDVI: A Comprehensive Guide to Boost Crop Health and Yield with Precision Agriculture Technology
“NDVI can detect crop health variations as small as 1-2% in vegetation density across fields.”
Welcome to our comprehensive guide on mastering the Normalized Difference Vegetation Index (NDVI) in precision agriculture. As we delve into this powerful tool for crop health analysis and yield optimization, we’ll explore how NDVI revolutionizes farming practices and empowers growers to make data-driven decisions. Whether you’re a farmer, consultant, or part of a cooperative, this guide will help you unlock the potential of NDVI for sustainable and efficient agricultural management.
Understanding NDVI: The Foundation of Vegetation Index Monitoring
NDVI is a crucial component of precision agriculture technology, providing valuable insights into crop health and vegetation density. Let’s break down what NDVI means and how it works:
- Normalized: The index is scaled to a standard range, typically -1 to 1, allowing for consistent comparisons across different areas and time periods.
- Difference: It measures the difference between near-infrared (NIR) and red light reflectance from plants.
- Vegetation: NDVI primarily focuses on assessing plant health and density.
- Index: It’s a numerical indicator that provides a quick snapshot of vegetation conditions.
NDVI works on the principle that healthy vegetation absorbs most visible light for photosynthesis while reflecting a large portion of near-infrared light. By measuring these differences in reflectance, we can gauge plant health and biomass.
The Science Behind NDVI Calculation
The NDVI calculation is relatively simple but incredibly powerful. The formula is:
NDVI = (NIR – Red) / (NIR + Red)
Where:
- NIR = reflectance in the near-infrared spectrum
- Red = reflectance in the red visible spectrum
This calculation results in values ranging from -1 to 1, where higher positive values indicate healthier, denser vegetation.

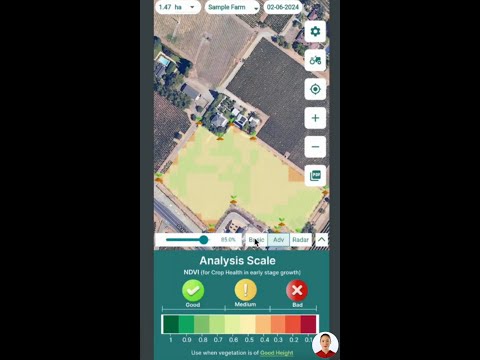
Interpreting NDVI Values: A Practical Guide for Farmers
Understanding NDVI values is crucial for effective crop health analysis. Here’s a comprehensive table to help you interpret NDVI readings:
| NDVI Range | Vegetation Health Status | Crop Condition | Management Recommendations |
|---|---|---|---|
| 0 – 0.1 | Very Poor | Bare soil, rocks, dead plants | Soil analysis, consider replanting or soil amendment |
| 0.1 – 0.3 | Poor | Sparse vegetation, stressed crops | Investigate for pests, diseases, or nutrient deficiencies |
| 0.3 – 0.5 | Moderate | Average plant health, moderate density | Monitor closely, consider targeted fertilization |
| 0.5 – 0.7 | Good | Healthy vegetation, dense crop cover | Maintain current practices, optimize irrigation |
| 0.7 – 1.0 | Excellent | Very healthy, dense vegetation | Continue optimal management, prepare for high yield |
This table serves as a valuable reference for interpreting NDVI data and making informed decisions about crop management throughout the growing season.
NDVI in Agriculture: Revolutionizing Crop Health Analysis
NDVI has become an indispensable tool in modern agriculture, offering numerous benefits for crop health analysis and management:
- Early Detection of Stress: NDVI can identify areas of crop stress before they’re visible to the naked eye, allowing for prompt intervention.
- Yield Prediction: By analyzing NDVI trends over time, farmers can estimate potential yields and plan accordingly.
- Resource Optimization: NDVI maps help in creating precise application zones for water, fertilizers, and pesticides, reducing waste and environmental impact.
- Crop Monitoring: Regular NDVI measurements provide insights into crop development stages and overall field performance.
“Satellite-based NDVI analysis can cover up to 10,000 acres of farmland in a single image capture.”
Leveraging Satellite Imagery for Farming: The Power of Remote Sensing
Satellite imagery has revolutionized the way we approach NDVI analysis in agriculture. Here’s how remote sensing technology is transforming farming practices:
- Wide Coverage: Satellites can capture NDVI data for vast areas, making it ideal for large-scale agricultural operations.
- Frequent Updates: Regular satellite passes provide timely information on crop health, allowing for dynamic management decisions.
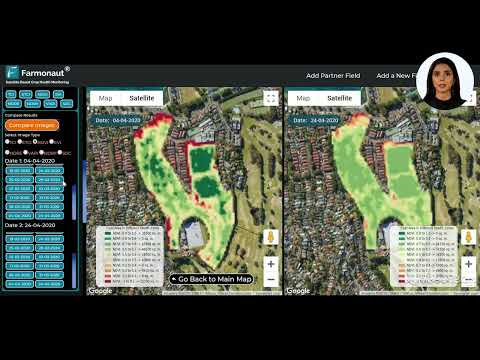
- Historical Data: Satellite imagery archives enable comparison of current crop conditions with previous seasons, aiding in long-term planning.
- Cost-Effective: Compared to traditional ground-based methods, satellite-derived NDVI is more economical for large areas.
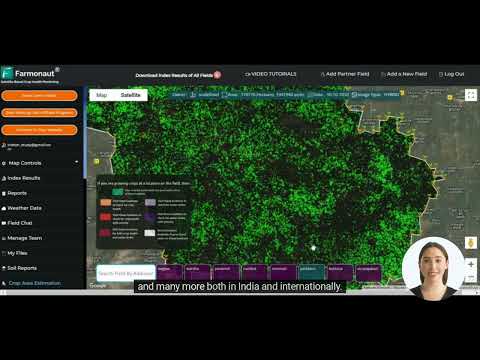
At Farmonaut, we harness the power of satellite imagery to provide farmers with up-to-date NDVI maps and analytics. Our platform integrates this technology to offer actionable insights for precision agriculture.

Implementing NDVI in Precision Agriculture: A Step-by-Step Approach
To effectively use NDVI in your farming operations, follow these steps:
- Acquire NDVI Data: Utilize satellite imagery or drone-based sensors to collect NDVI data for your fields.
- Generate NDVI Maps: Use specialized software or platforms like Farmonaut to create color-coded NDVI maps of your farmland.
- Analyze Patterns: Identify areas of high and low NDVI values, which indicate varying levels of crop health and density.
- Create Management Zones: Based on NDVI patterns, divide your field into zones for targeted management.
- Develop Action Plans: For each zone, create specific strategies for irrigation, fertilization, and pest control.
- Implement Variable Rate Applications: Use precision agriculture equipment to apply inputs at variable rates based on NDVI zones.
- Monitor and Adjust: Continuously track NDVI changes and adjust your management practices accordingly.
NDVI Throughout the Growing Season: From Planting to Harvest
NDVI is a versatile tool that provides valuable insights at every stage of crop development:
- Pre-Planting: Assess soil conditions and residual vegetation to plan field preparations.
- Early Growth: Monitor seedling emergence and identify areas that may need replanting.
- Vegetative Stage: Evaluate crop establishment and initiate targeted interventions for underperforming areas.
- Flowering and Fruiting: Assess plant vigor during critical reproductive stages to optimize yield potential.
- Pre-Harvest: Determine crop maturity and plan harvesting operations based on NDVI-indicated ripeness patterns.
- Post-Harvest: Analyze residual vegetation and plan for the next growing season.

Integrating NDVI with Other Precision Agriculture Technologies
To maximize the benefits of NDVI, it’s essential to integrate it with other precision agriculture technologies:
- GPS and GIS: Combine NDVI data with precise location information for accurate mapping and targeted interventions.
- Soil Sensors: Correlate NDVI values with soil moisture and nutrient levels for comprehensive field analysis.
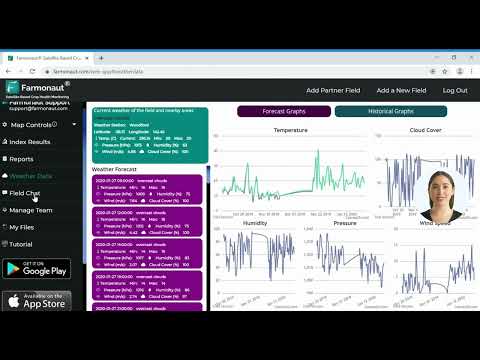
- Weather Stations: Incorporate local climate data to understand how weather patterns affect NDVI readings.
- Yield Monitors: Compare end-of-season yield data with NDVI maps to refine future management strategies.
- Variable Rate Technology (VRT): Use NDVI maps to guide VRT equipment for precise input application.
Farmonaut’s platform seamlessly integrates these technologies, providing a comprehensive solution for precision agriculture.
Sustainable Farming Practices Enhanced by NDVI
NDVI plays a crucial role in promoting sustainable agriculture by:
- Reducing Input Waste: Targeted application of water, fertilizers, and pesticides based on NDVI zones minimizes environmental impact.
- Conserving Water: NDVI-guided irrigation helps optimize water use, especially in water-stressed regions.
- Improving Soil Health: By preventing over-application of inputs, NDVI-based management helps maintain soil quality.
- Enhancing Biodiversity: Precise pest management guided by NDVI reduces the need for broad-spectrum pesticides, protecting beneficial organisms.
- Reducing Carbon Footprint: Efficient resource use and improved yields contribute to lower greenhouse gas emissions per unit of production.

Overcoming Challenges in NDVI Implementation
While NDVI is a powerful tool, there are some challenges to consider:
- Data Interpretation: Understanding NDVI maps requires training and experience. Farmonaut provides user-friendly interfaces and support to help farmers interpret data effectively.
- Cloud Cover: Satellite imagery can be affected by cloud cover. Our platform uses advanced algorithms to compensate for this and provide consistent data.
- Resolution Limitations: Some satellite imagery may have lower resolution. Farmonaut offers high-resolution options for detailed analysis.
- Temporal Frequency: The timing of satellite passes may not always align with critical crop stages. We address this by offering frequent updates and complementary data sources.
The Future of NDVI in Agriculture
As technology continues to advance, we anticipate exciting developments in NDVI applications:
- AI-Enhanced Analysis: Machine learning algorithms will improve NDVI interpretation, providing even more accurate insights.
- Integration with IoT: NDVI data will be seamlessly integrated with Internet of Things (IoT) devices for real-time decision-making.
- Hyperspectral Imaging: Advanced sensors will provide more detailed spectral information, enhancing NDVI accuracy.
- Automated Management Systems: NDVI data will directly inform automated irrigation and fertilization systems for hands-off precision agriculture.
Farmonaut’s NDVI Solutions: Empowering Farmers with Cutting-Edge Technology
At Farmonaut, we’re committed to making NDVI technology accessible and actionable for farmers of all scales. Our platform offers:
- User-Friendly Interface: Easy-to-navigate NDVI maps and analytics tailored for agricultural use.
- Real-Time Updates: Regular satellite imagery updates to keep you informed about your crops’ health.
- Customizable Alerts: Set thresholds for NDVI values and receive notifications when attention is needed.
- Integration Capabilities: Seamlessly incorporate NDVI data with other farm management tools and software.
- Expert Support: Our team of agronomists and tech experts is always ready to help you make the most of NDVI technology.

Case Studies: NDVI Success Stories in Agriculture
While we can’t share specific case studies, here are some general examples of how NDVI has benefited farmers:
- Water Conservation: A corn farmer in the Midwest used NDVI to optimize irrigation, reducing water usage by 20% while maintaining yield.
- Targeted Fertilization: A wheat grower in Europe used NDVI zones to apply variable-rate fertilizer, increasing yield by 15% and reducing input costs.
- Early Pest Detection: A cotton farmer in India detected a pest infestation early using NDVI, preventing crop loss and minimizing pesticide use.
- Yield Prediction: A large-scale soybean operation used NDVI trends to accurately forecast yields, improving supply chain management.
Implementing NDVI in Your Farming Operation: A Step-by-Step Guide
- Assess Your Needs: Determine the specific challenges you want to address with NDVI technology.
- Choose a Platform: Select a reliable NDVI service provider like Farmonaut that offers comprehensive solutions.
- Set Up Your Account: Register your fields and customize settings to match your crop types and management goals.
- Familiarize Yourself with the Tools: Take advantage of tutorials and support to understand how to interpret NDVI maps and data.
- Start Small: Begin by implementing NDVI-based decisions on a portion of your farm to gain confidence and experience.
- Monitor and Adjust: Regularly review NDVI data and adjust your management practices accordingly.
- Scale Up: As you become more comfortable with the technology, expand its use across your entire operation.
- Continuous Learning: Stay updated on the latest NDVI applications and precision agriculture techniques to maximize benefits.
FAQs About NDVI in Agriculture
Q: How often should I check NDVI maps for my crops?
A: We recommend checking NDVI maps at least weekly during the growing season, with more frequent checks during critical growth stages or when addressing specific issues.
Q: Can NDVI detect specific crop diseases?
A: While NDVI can’t identify specific diseases, it can highlight areas of plant stress that may indicate disease presence, prompting further investigation.
Q: Is NDVI equally effective for all crop types?
A: NDVI is useful for most crops, but its effectiveness can vary. Some crops may benefit from additional vegetation indices for more comprehensive analysis.
Q: How does cloud cover affect NDVI readings?
A: Cloud cover can interfere with satellite-based NDVI measurements. At Farmonaut, we use advanced algorithms and multiple data sources to minimize this impact.
Q: Can NDVI help with crop insurance claims?
A: Yes, NDVI data can provide objective evidence of crop health and yield potential, which can be valuable in supporting insurance claims.
Conclusion: Embracing NDVI for a Sustainable Agricultural Future
As we’ve explored throughout this guide, NDVI is a powerful tool that’s transforming modern agriculture. By leveraging this technology, farmers can make more informed decisions, optimize resource use, and ultimately increase yields while promoting sustainability. Whether you’re managing a small family farm or overseeing large-scale agricultural operations, integrating NDVI into your practices can lead to significant improvements in crop health and productivity.
At Farmonaut, we’re dedicated to making this technology accessible and actionable for farmers worldwide. Our platform combines cutting-edge satellite imagery, advanced analytics, and user-friendly interfaces to provide you with the insights you need to succeed in today’s competitive agricultural landscape.
We invite you to explore how Farmonaut’s NDVI solutions can benefit your farming operation. Whether you’re looking to optimize irrigation, fine-tune fertilizer applications, or simply gain a better understanding of your crop’s health, we’re here to support you every step of the way.
Ready to take your farming to the next level with NDVI technology? Visit our website or download our mobile app to get started today. Together, we can cultivate a more efficient, productive, and sustainable future for agriculture.
Explore Farmonaut’s API | API Developer Docs