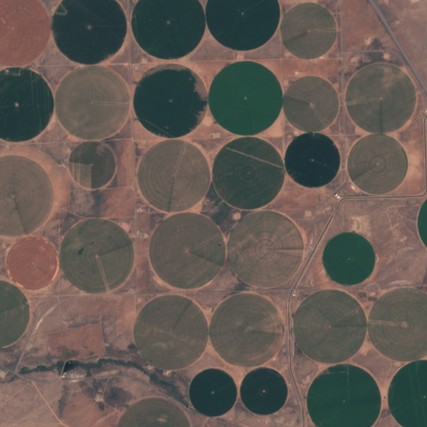
Applications of Satellite Imagery Bands - Part 2: Vegetation Red Edge (B5, B6, B7, B8A)
With these series of articles, we wish to provide a comprehensive analysis of what, where and how the satellite imagery accessed through our system can be used. This is the second article of this series. You can read the first article on this link: https://medium.com/@farmonaut/applications-of-satellite-imagery-bands-part-1-coastal-aerosol-b1-blue-b2-green-b3-and-3ba4ccd0867b
Introduction
The Red Edge band is located between the Red band (B4) and the NIR band (B8), without overlap. In a typical spectral response of green vegetation, the Red Edge band covers the portion of the spectrum where reflectance drastically increases from the red towards the NIR regions. Several studies have proven that the transition between the red absorption and the Near-Infrared (NIR) reflection in plants can provide valuable information about vegetation and its characteristics.
Differences in reflectance at the Red Edge wavelengths between three plant spectra with varying levels of vitality (Image Courtesy: Rapid Eye Whitepaper)
The red portion of the electromagnetic spectrum is one of the areas where chlorophyll strongly absorbs light and the NIR is where the leaf cell structure reflects strongly. To illustrate this, the three segments in the above figure show the reflectance values as recorded by the satellite’s Red Edge band for each of the three plant spectra shown. These spectra come from plants with varying levels of vitality, which is reflected by the values at the Red Edge band, together with the other two bands. The different reflectance values show how the Red Edge band provides additional information to characterize plant spectra at different vitality levels. Red Edge band sensitivity to differences in leaf structure and Chlorophyll content can have useful applications on precision agriculture and resource monitoring and management.
Agriculture
Crop yield strongly depends on an adequate supply of nitrogen (N). Therefore, knowledge about N-status represents an important factor for agricultural management. Additionally, N-fertilizer is one of the largest input cost factors of many crops such as corn, wheat and rice, which makes the assessment of the N-status of a crop critical for optimal fertilizer management. N-status cannot be directly measured through the imagery, but it can be estimated through indirect indicators. The N-status of crops can be assessed through Chlorophyll measurements.
The use of spectral measurements and spectral indicators for the determination of Chlorophyll content is based on the fact that Chlorophyll, as well as a number of other pigments, are strong absorbers of light in certain well-defined wavelengths, specifically in the blue and the red spectral region. It is possible to produce a Relative Chlorophyll Map, as an indicator of the nutritional status of the crop, using the Red Edge band to show the spatial variation of the relative Chlorophyll content within a field.
Classification of Vegetation
Land cover classification is a fundamental tool for monitoring environmental quality and land productivity. Reliable information on the extent and distribution of the main landscape plant types constitutes the basis for assessing crop productivity, environmental degradation, and the effects of land management practices.
Schuster et al. (2012) tested the Red Edge band in a land use classification project. They found that with the Red Edge band, the overall classification accuracy was consistently higher than without it. In terms of individual classes, the most significant improvements were obtained with classes comprised of open landscape vegetation.
Forestry
Forest and plantations are subject to a wide range of pests and diseases. Monitoring and early detection of infestations such as bark beetles are important for the protection of the forest. Traditional ground-based monitoring techniques or airborne surveys are costly, and the results are often subjective. In addition, early indications of disease or infestation are usually not visible on the ground.
In a study by Eitel et al. (2011), coniferous trees were girdled to produce stress symptoms and three different vegetation indices calculated and assessed. Results showed that the Normalized Difference Red Edge Index (NDRE) was able to detect stress symptoms earlier than the other vegetation indices. Given the sensitivity of the NDRE, this index can be used for a variety of forest health applications such as drought stress, bark beetle damage, fire damage, and disease mapping. A comprehensive study of NDRE index will be done in the subsequent articles in this series.
Monitoring Water
The amount of Chlorophyll-a in water and water turbidity are two of the main parameters used to assess lake water quality. Chlorophylls-a content is a measurement of the abundance of photosynthetically active organisms in lakes. Water turbidity is assessed by measuring Secchi depth, which is related to visibility in water under specific conditions. The Secchi depth is reached when the reflectance equals the intensity of light backscattered from the water. Since light at a wavelength between 690 and 730 nm is more attenuated by water than, for example, blue light, the Red Edge band can be used for the estimation of Secchi depth. The Red Edge band can be utilized to assess these two water quality parameters in productive inland water bodies with relatively high phytoplankton content.
Using the prediction capabilities of the Red edge band, it is possible to generate maps that indicate the spatial distribution of Chlorophyll content and turbidity in water. These maps constitute a valuable tool for water monitoring.
Do you have an awesome idea for a landscape you think is worth exploring? Or are you looking for better resolution images for your work at affordable prices? Simply click on the link below : https://farmonaut.com/satellite-imagery
Famonaut aims to provide the best service and satisfy your needs. Not sure what to do? Contact us at [email protected].
We have some more interesting articles coming up soon. Stay tuned!
Wait!!
Before that…
Follow us at:
Facebook: https://facebook.com/farmonaut
Instagram: https://instagram.com/farmonaut
Twitter: https://twitter.com/farmonaut
LinkedIn: https://www.linkedin.com/company/farmonaut/
Pinterest: https://in.pinterest.com/farmonaut/
Tumblr: https://farmonaut.tumblr.com/
Youtube: https://www.youtube.com/channel/UCYWOOPPKATLgh4L6YRlYFOQ
AppLink: https://play.google.com/store/apps/details?id=com.farmonaut.android
Website: https://farmonaut.com
Satellite Imagery: https://farmonaut.com/satellite-imagery
Satellite Imagery Samples: https://farmonaut.com/satellite-imagery-samples

