Mastering NDVI: The Ultimate Guide to Normalized Difference Vegetation Index in Agriculture and Remote Sensing
In the ever-evolving world of precision agriculture and remote sensing, one tool stands out for its remarkable ability to assess vegetation health and density: the Normalized Difference Vegetation Index (NDVI). At Farmonaut, we’ve harnessed the power of NDVI to revolutionize farm management and crop monitoring. In this comprehensive guide, we’ll delve deep into the world of NDVI, exploring its applications, benefits, and how it’s changing the face of modern agriculture.
What is Normalized Difference Vegetation Index (NDVI)?
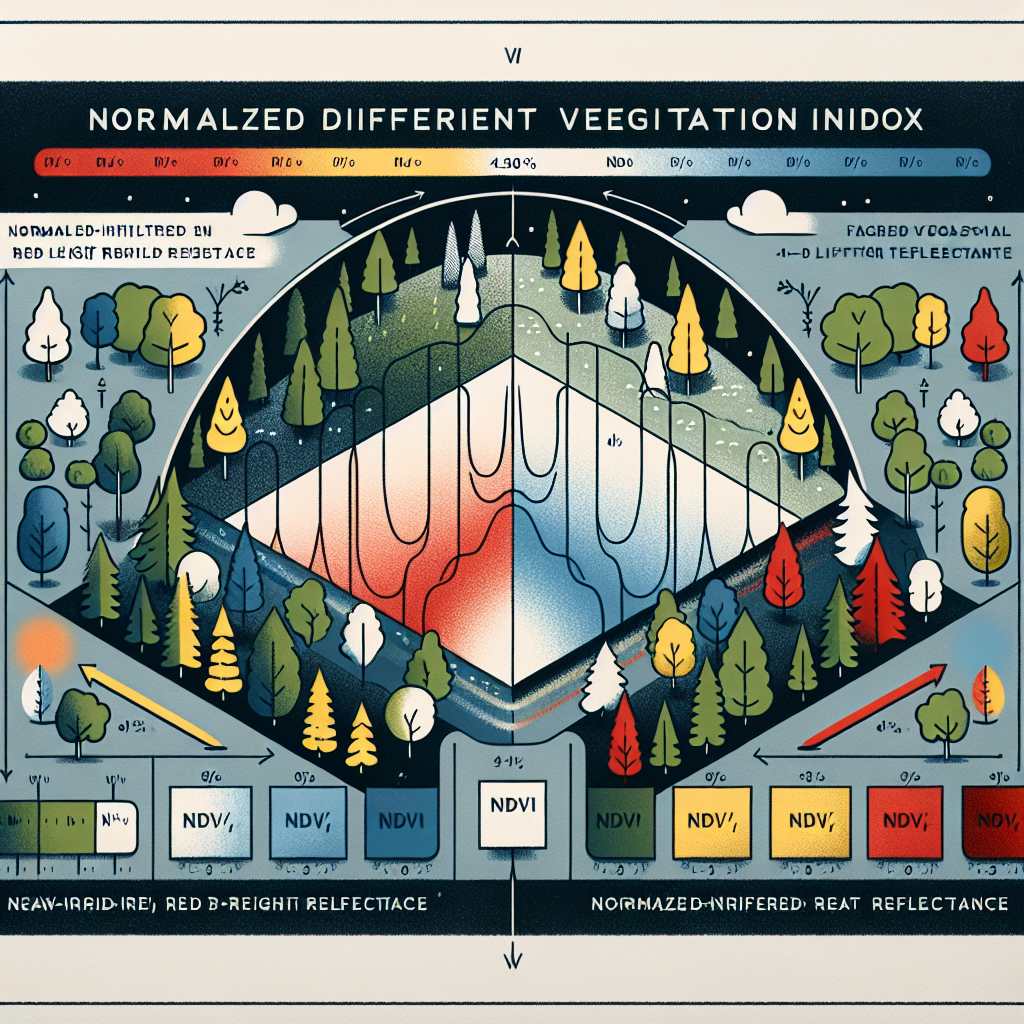
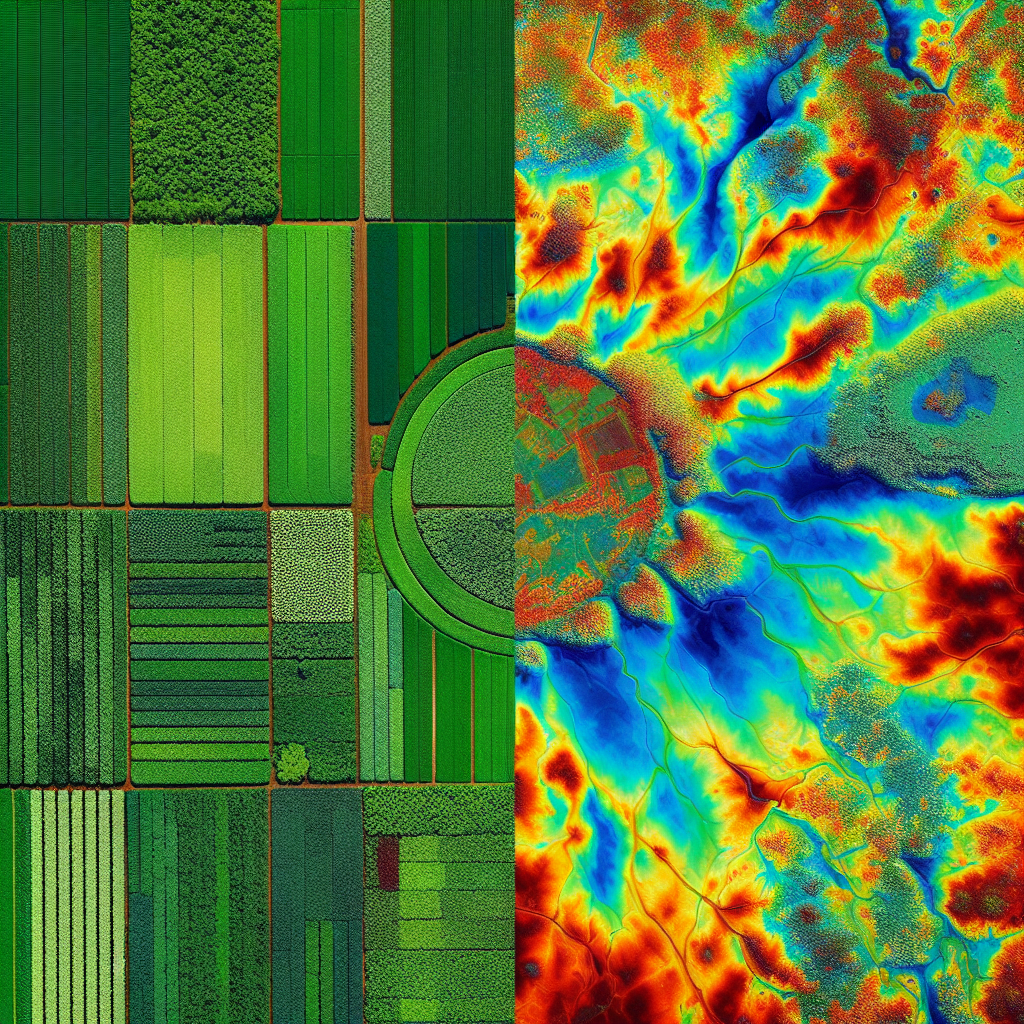
The Normalized Difference Vegetation Index (NDVI) is a simple yet powerful numerical indicator used to analyze remote sensing measurements, typically from satellite imagery, to assess whether the observed target contains live green vegetation. NDVI has become an essential tool in various fields, including agriculture, forestry, and environmental monitoring.
NDVI is based on the principle that healthy vegetation absorbs most of the visible light that hits it and reflects a large portion of near-infrared light. In contrast, unhealthy or sparse vegetation reflects more visible light and less near-infrared light.
The Normalized Difference Vegetation Index Formula
The normalized difference vegetation index formula is straightforward:
NDVI = (NIR – RED) / (NIR + RED)
Where:
- NIR = Near-infrared reflectance
- RED = Red light reflectance
This formula yields a value between -1 and +1, where higher values indicate healthier and denser vegetation.
What Can the NDVI (Normalized Difference Vegetation Index) Tell You About Vegetation?
NDVI provides valuable insights into vegetation health and density. Here’s what NDVI can reveal:
- Vegetation Health: Higher NDVI values indicate healthier vegetation.
- Biomass: NDVI correlates with the amount of plant biomass in an area.
- Crop Stress: Decreasing NDVI values can signal crop stress due to drought, pests, or diseases.
- Growth Stages: NDVI can help track crop growth stages throughout the season.
- Yield Prediction: NDVI data can be used to estimate potential crop yields.

NDVI Applications in Agriculture
At Farmonaut, we’ve integrated NDVI into our satellite-based crop health monitoring system, revolutionizing how farmers manage their fields. Here are some key applications of NDVI in agriculture:
- Crop Health Monitoring: Regular NDVI measurements allow farmers to track crop health throughout the growing season.
- Variable Rate Application: NDVI maps can guide precision application of fertilizers and pesticides.
- Irrigation Management: NDVI data helps identify areas that may require more or less irrigation.
- Yield Forecasting: Historical NDVI data combined with current measurements can help predict crop yields.
- Pest and Disease Detection: Sudden changes in NDVI can indicate pest infestations or disease outbreaks.
How Farmonaut Leverages NDVI
At Farmonaut, we’ve harnessed the power of NDVI to provide farmers with unparalleled insights into their crops. Our satellite-based system offers several advantages over traditional monitoring methods:
| Feature | Farmonaut Satellite System | Drone-based Monitoring | IoT-based Monitoring |
|---|---|---|---|
| Coverage Area | Large (Entire farms) | Medium | Limited (Point-based) |
| Frequency of Data | High (Every 3-5 days) | Variable (Depends on flights) | Continuous |
| Cost-Effectiveness | High | Medium | Low (High initial investment) |
| Ease of Use | Very High (No on-field equipment) | Medium (Requires piloting skills) | Medium (Requires maintenance) |
| Data Processing | Automated | Semi-automated | Automated |
Our Farmonaut app provides easy access to NDVI maps and insights, allowing farmers to make data-driven decisions from anywhere. For developers and businesses looking to integrate our NDVI data into their systems, we offer a robust API with comprehensive documentation.
Beyond NDVI: Advanced Vegetation Indices
While NDVI is powerful, we at Farmonaut are always pushing the boundaries of remote sensing technology. We’ve incorporated several advanced vegetation indices into our system to provide even more detailed insights:
- Enhanced Vegetation Index (EVI): Improves sensitivity in high biomass regions and reduces atmospheric influences.
- Soil Adjusted Vegetation Index (SAVI): Minimizes soil brightness influences in areas with sparse vegetation.
- Normalized Difference Water Index (NDWI): Assesses vegetation water content and water stress.
The Future of NDVI and Precision Agriculture
As technology advances, we at Farmonaut are excited about the future of NDVI and precision agriculture. Some trends we’re watching include:
- AI-Enhanced NDVI Analysis: Machine learning algorithms are improving the interpretation of NDVI data, providing more accurate insights.
- Integration with IoT: Combining satellite-based NDVI with ground-based sensors for more comprehensive farm monitoring.
- Hyperspectral Imaging: Moving beyond traditional NDVI to capture more detailed spectral information about crops.
- Real-time NDVI: Advances in satellite technology may soon allow for near-real-time NDVI monitoring.
Implementing NDVI in Your Farm Management Strategy
Ready to harness the power of NDVI for your farm? Here’s how to get started with Farmonaut:
- Download the Farmonaut app:
Android |
iOS - Create an account and define your field boundaries.
- Start receiving regular NDVI updates and insights.
- Use the data to inform your farming decisions, from irrigation to fertilization.
- Track your progress over time and refine your strategies based on historical data.
FAQ: Normalized Difference Vegetation Index (NDVI)
Q: What is the range of NDVI values?
A: NDVI values typically range from -1 to +1. Values close to +1 indicate dense, healthy vegetation, while values near 0 suggest no vegetation, and negative values often represent water or bare soil.
Q: How often should I monitor NDVI?
A: With Farmonaut’s satellite system, we recommend monitoring NDVI every 3-5 days during the growing season for optimal insights.
Q: Can NDVI detect specific crop diseases?
A: While NDVI can’t identify specific diseases, it can detect changes in plant health that may indicate disease presence. Further investigation is usually needed to determine the exact cause of NDVI changes.
Q: Is NDVI affected by cloud cover?
A: Yes, cloud cover can interfere with satellite-based NDVI measurements. However, our system at Farmonaut uses advanced algorithms to minimize cloud interference and provide consistent data.
Q: How does NDVI compare to visual inspection of crops?
A: NDVI can detect stress in plants before it’s visible to the naked eye, making it a powerful tool for early intervention. However, it should be used in conjunction with visual inspections for best results.
Conclusion: Embracing NDVI for Smarter Farming
The Normalized Difference Vegetation Index (NDVI) has revolutionized how we monitor and manage crops. At Farmonaut, we’re proud to be at the forefront of this technology, providing farmers with the tools they need to make data-driven decisions and optimize their operations.
By embracing NDVI and other advanced remote sensing technologies, farmers can increase yields, reduce resource usage, and contribute to more sustainable agricultural practices. As we continue to innovate and refine our services, we’re excited to see how NDVI will shape the future of farming.
Ready to take your farming to the next level with NDVI? Subscribe to Farmonaut today and start harnessing the power of satellite-based crop monitoring:
Join the precision agriculture revolution with Farmonaut and unlock the full potential of your fields!