NDWI Index: Revolutionizing Water Management with the Normalized Difference Water Index (NDWI)

In the ever-evolving landscape of agricultural technology, we at Farmonaut are constantly exploring innovative ways to enhance farm management and resource utilization. One of the most crucial aspects of modern agriculture is efficient water management, and this is where the NDWI index comes into play. In this comprehensive guide, we’ll delve deep into the world of the Normalized Difference Water Index (NDWI), exploring its significance, applications, and how it’s revolutionizing water management in agriculture and beyond.
Table of Contents
- Understanding the NDWI Index
- The Science Behind NDWI
- Applications of NDWI in Agriculture
- NDWI vs. Other Water Indices
- Implementing NDWI in Precision Agriculture
- Farmonaut’s Approach to NDWI
- Case Studies and Success Stories
- Future of Water Management with NDWI
- FAQs
1. Understanding the NDWI Index
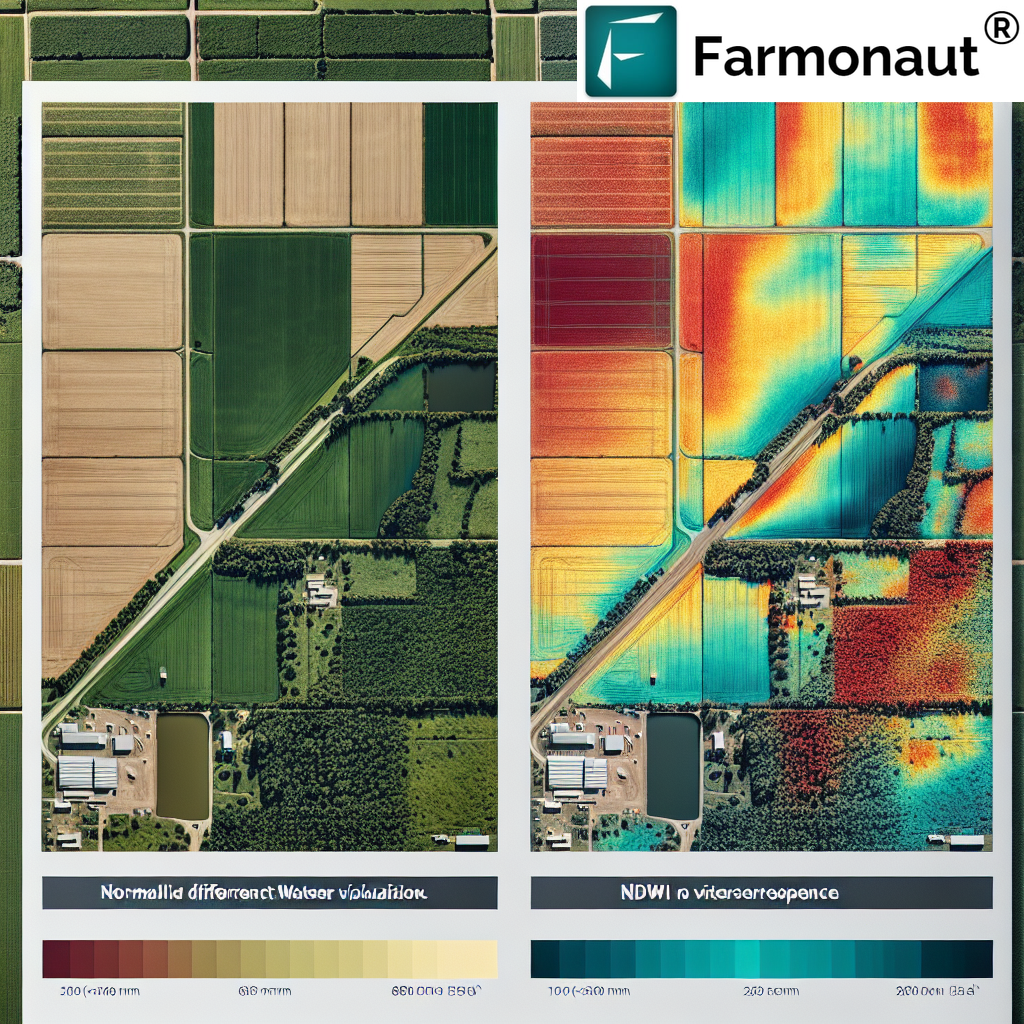
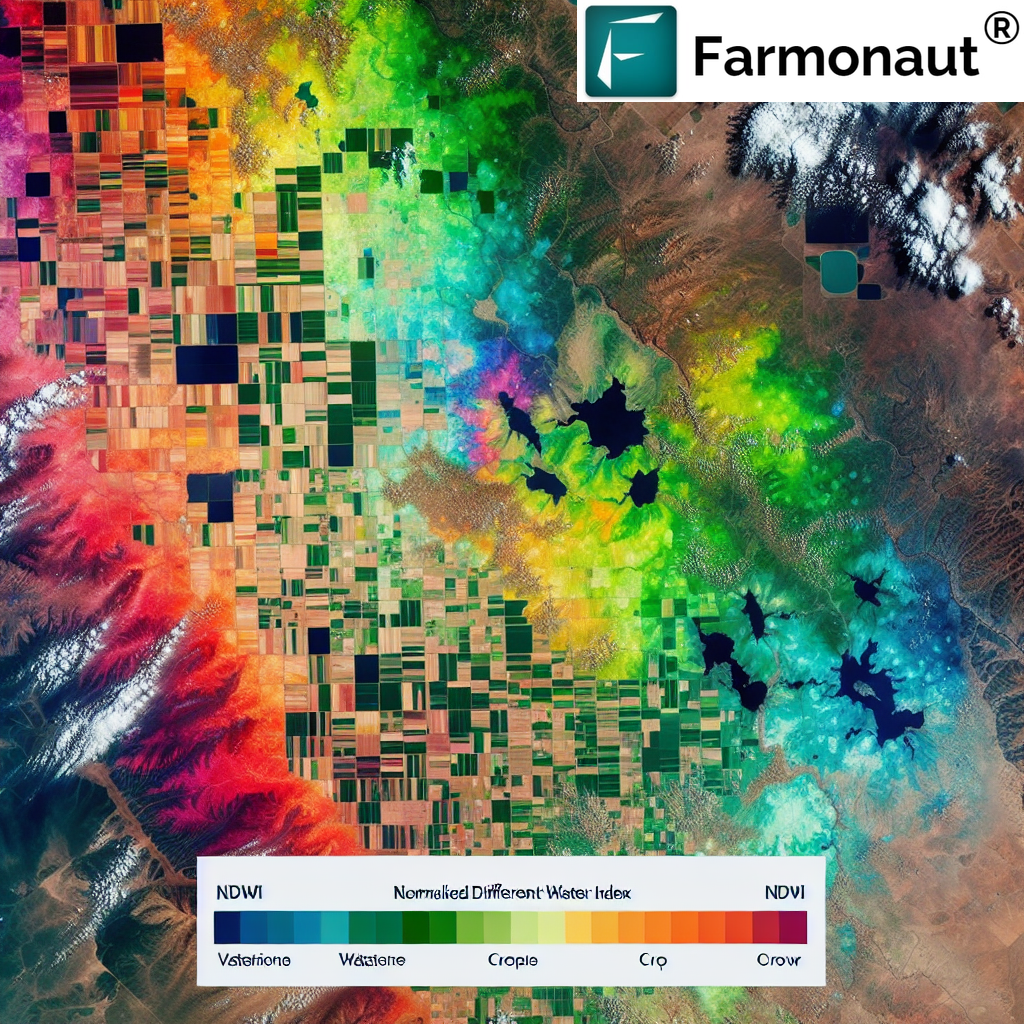
The NDWI water index, or Normalized Difference Water Index, is a remote sensing-derived index that helps in detecting and measuring the liquid water content in vegetation and soil. Developed in the 1990s, NDWI has become an indispensable tool in various fields, particularly in agriculture, environmental monitoring, and water resource management.
At its core, NDWI leverages the differential reflection of water in different spectral bands, typically using near-infrared (NIR) and short-wave infrared (SWIR) wavelengths. This unique spectral signature allows us to quantify water content in plants and soil with remarkable accuracy.
Key Features of NDWI:
- Non-invasive measurement of water content
- Applicable to large areas through satellite imagery
- Useful for both vegetation and open water body analysis
- Helps in drought monitoring and flood mapping
- Enhances precision agriculture practices
2. The Science Behind NDWI
To truly appreciate the power of the NDWI index, it’s essential to understand the science that underpins it. The NDWI is calculated using the following formula:
NDWI = (NIR – SWIR) / (NIR + SWIR)
Where:
- NIR = Near-Infrared reflectance
- SWIR = Short-Wave Infrared reflectance
This formula capitalizes on the fact that water absorbs light strongly in the SWIR band while reflecting it in the NIR band. The resulting index values range from -1 to 1, with higher values indicating higher water content.
Spectral Bands Used in NDWI:
- Near-Infrared (NIR): Typically 0.76 to 0.9 μm
- Short-Wave Infrared (SWIR): Usually 1.55 to 1.75 μm
The use of these specific bands allows NDWI to be sensitive to changes in water content while being relatively insensitive to atmospheric effects, making it a robust tool for various applications.
3. Applications of NDWI in Agriculture
In the agricultural sector, the NDWI index has proven to be a game-changer. Its ability to detect water stress in crops before visible signs appear has made it an invaluable tool for farmers and agronomists. Here are some key applications:
3.1 Irrigation Management
By monitoring NDWI values, farmers can optimize their irrigation schedules, ensuring that crops receive water only when needed. This not only conserves water but also prevents issues related to over-irrigation, such as root rot and nutrient leaching.
3.2 Drought Monitoring
NDWI is highly effective in detecting the onset of drought conditions. Early detection allows farmers to implement mitigation strategies, potentially saving crops and reducing yield losses.
3.3 Crop Health Assessment
Water stress is often an early indicator of various plant health issues. Regular NDWI monitoring can help in identifying potential problems before they become severe, allowing for timely interventions.
3.4 Yield Prediction
By correlating NDWI values with historical yield data, it’s possible to develop models for yield prediction. This information is crucial for farm planning and market strategies.
3.5 Wetland Mapping
In agricultural landscapes with wetlands, NDWI helps in accurately mapping these areas, which is essential for conservation efforts and compliance with environmental regulations.
4. NDWI vs. Other Water Indices
While NDWI is powerful, it’s not the only water index available. Understanding how it compares to other indices can help in choosing the right tool for specific applications.
4.1 NDWI vs. NDVI (Normalized Difference Vegetation Index)
NDVI is more sensitive to chlorophyll content and overall vegetation health, while NDWI focuses specifically on water content. In many cases, using both indices provides a more comprehensive view of crop health.
4.2 NDWI vs. MNDWI (Modified NDWI)
MNDWI uses green and SWIR bands instead of NIR and SWIR. It’s often more effective in distinguishing water bodies from land, especially in urban areas.
4.3 NDWI vs. WRI (Water Ratio Index)
WRI uses a ratio of blue and NIR bands. It’s particularly useful for mapping open water bodies but less effective for vegetation water content analysis compared to NDWI.
| Index | Primary Use | Bands Used | Strength |
|---|---|---|---|
| NDWI | Vegetation water content, Open water | NIR, SWIR | Versatile, good for vegetation and water |
| NDVI | Vegetation health | Red, NIR | Excellent for overall plant health |
| MNDWI | Open water mapping | Green, SWIR | Better at distinguishing water in urban areas |
| WRI | Open water mapping | Blue, NIR | Good for clear water bodies |
5. Implementing NDWI in Precision Agriculture
At Farmonaut, we’ve seen firsthand how implementing NDWI can transform precision agriculture practices. Here’s how farmers and agronomists can effectively use NDWI:
5.1 Satellite-Based Monitoring
Regular satellite imagery provides consistent NDWI data over large areas. We use advanced satellites to capture high-resolution images, allowing for detailed NDWI analysis at the field level.
5.2 Integration with Farm Management Systems
NDWI data can be seamlessly integrated into farm management software, providing actionable insights alongside other crucial farm data.
5.3 AI-Powered Analysis
Our AI algorithms analyze NDWI trends over time, alerting farmers to potential water stress issues before they become visible to the naked eye.
5.4 Mobile Applications
We’ve developed mobile apps that allow farmers to access NDWI maps and data on-the-go, enabling quick decision-making in the field. Check out our app on Google Play or the App Store.
5.5 IoT Integration
By combining NDWI data with ground-based IoT sensors, we create a comprehensive water management system that offers unparalleled accuracy and efficiency.
6. Farmonaut’s Approach to NDWI
At Farmonaut, we’ve developed a unique approach to leveraging NDWI for agricultural benefits:
6.1 High-Frequency Monitoring
Our satellite-based system provides regular NDWI updates, allowing for timely interventions in water management.
6.2 AI-Enhanced Interpretation
We use advanced AI algorithms to interpret NDWI data, providing farmers with actionable insights rather than raw data.
6.3 Integration with Weather Data
By combining NDWI with weather forecasts, we offer predictive water management advice, helping farmers prepare for upcoming dry spells or excessive rainfall.
6.4 Custom Alerts
Farmers can set custom NDWI thresholds, receiving alerts when their fields require attention.
6.5 Historical Analysis
Our platform allows for historical NDWI analysis, enabling farmers to understand long-term water trends in their fields.

7. Case Studies and Success Stories
While we don’t include specific case studies here, it’s worth noting that the implementation of NDWI-based water management has led to significant improvements in water use efficiency and crop yields across various agricultural settings.
8. Future of Water Management with NDWI
The future of water management using NDWI is promising and exciting. Here are some developments we anticipate:
8.1 Hyperspectral Imaging
As hyperspectral sensors become more accessible, we expect to see even more precise NDWI calculations, allowing for detection of subtle changes in plant water content.
8.2 Integration with Autonomous Systems
NDWI data could be used to guide autonomous irrigation systems and even drones for targeted water application.
8.3 Climate Change Adaptation
As water becomes an increasingly precious resource due to climate change, NDWI will play a crucial role in adapting agricultural practices to new environmental realities.
8.4 Ecosystem Management
Beyond agriculture, NDWI will be increasingly used in managing natural ecosystems, helping in conservation efforts and biodiversity protection.
9. FAQs
Q1: How often should NDWI be measured for effective farm management?
A: The frequency of NDWI measurements depends on various factors such as crop type, growth stage, and local climate. Generally, weekly or bi-weekly measurements are sufficient for most crops. However, during critical growth stages or in areas prone to rapid weather changes, more frequent monitoring may be beneficial.
Q2: Can NDWI be used for all types of crops?
A: NDWI is applicable to a wide range of crops, but its effectiveness can vary. It’s particularly useful for crops with broad leaves and those sensitive to water stress. For some crops with unique canopy structures or water retention mechanisms, additional indices or ground-truthing may be necessary for accurate interpretation.
Q3: How does NDWI compare to ground-based soil moisture sensors?
A: While ground-based sensors provide precise, point-specific data, NDWI offers a broader view of water content across an entire field. NDWI is non-invasive and can cover large areas quickly, making it ideal for large-scale monitoring. However, for the most comprehensive water management, a combination of NDWI and ground sensors is often the best approach.
Q4: Can NDWI detect over-irrigation?
A: Yes, NDWI can help detect over-irrigation. Excessively high NDWI values, especially when compared to historical data or known optimal ranges for a specific crop, can indicate over-irrigation. This information is crucial for preventing water waste and potential crop damage from waterlogging.
Q5: How does cloud cover affect NDWI measurements from satellites?
A: Cloud cover can significantly impact satellite-based NDWI measurements as clouds obstruct the view of the Earth’s surface. At Farmonaut, we use advanced cloud-masking techniques and combine data from multiple satellite passes to ensure consistent and reliable NDWI data, even in areas prone to frequent cloud cover.
Q6: Is special equipment needed to implement NDWI-based management on a farm?
A: One of the advantages of NDWI is that it doesn’t require special on-farm equipment. The primary requirement is access to satellite imagery and analysis tools, which Farmonaut provides through our platform and mobile apps. Farmers can access NDWI data and insights using standard smartphones or computers.
Q7: How does NDWI contribute to sustainable farming practices?
A: NDWI plays a significant role in sustainable farming by optimizing water use. By providing accurate information on crop water needs, it helps reduce water waste, minimize runoff, and lower energy costs associated with irrigation. This not only conserves water resources but also contributes to reducing the overall environmental footprint of agricultural operations.
Conclusion
The NDWI index has proven to be a powerful tool in revolutionizing water management, particularly in agriculture. At Farmonaut, we’re committed to harnessing the power of NDWI and other advanced technologies to help farmers optimize their water use, improve crop yields, and contribute to more sustainable agricultural practices.
By combining satellite imagery, AI-powered analysis, and user-friendly interfaces, we’re making precision agriculture accessible to farmers of all scales. Whether you’re managing a small family farm or overseeing large agricultural operations, our NDWI-based solutions can help you make more informed decisions about water management.
We invite you to explore how Farmonaut can transform your approach to water management. Visit our web application or check out our API documentation to learn more about integrating our NDWI solutions into your farming practices.
For developers interested in leveraging our satellite and weather data, we offer comprehensive API access. You can find more information in our API developer documentation.
Join us in embracing the future of agriculture, where data-driven decisions lead to more efficient, productive, and sustainable farming practices. Together, we can make a significant impact on global water conservation while ensuring food security for generations to come.
Subscribe to Farmonaut