NDWI Index: Understanding and Applying the Normalized Difference Water Index in Remote Sensing

In the ever-evolving field of remote sensing and precision agriculture, the Normalized Difference Water Index (NDWI) has emerged as a crucial tool for monitoring water resources and assessing vegetation health. At Farmonaut, we recognize the importance of this indice and have integrated it into our advanced satellite-based farm management solutions. In this comprehensive guide, we’ll delve deep into the NDWI indice, exploring its applications, calculations, and significance in modern agriculture and environmental monitoring.
1. Introduction to NDWI
The Normalized Difference Water Index (NDWI) is a remote sensing-derived index that has gained significant attention in recent years. As a powerful tool for assessing water content in vegetation and delineating open water bodies, NDWI has become an integral part of many satellite-based monitoring systems, including our own at Farmonaut.
NDWI was first introduced by Gao in 1996 as a method to detect surface water in wetland environments and measure water content within vegetation. Since then, it has been widely adopted and modified for various applications in hydrology, agriculture, and environmental monitoring.
2. Understanding the NDWI Indice
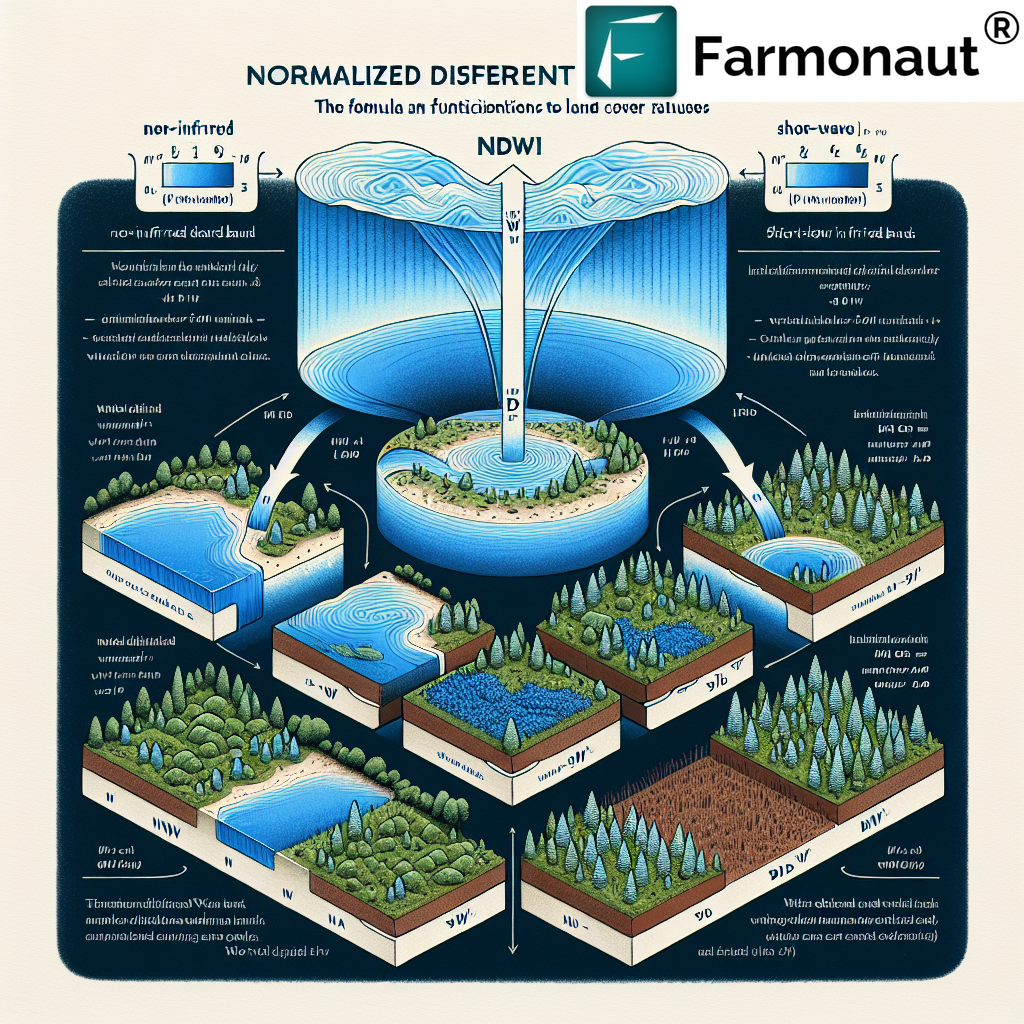
The NDWI indice is based on the principle that water absorbs energy at near-infrared (NIR) wavelengths while reflecting strongly in the green visible spectrum. By exploiting this spectral difference, NDWI can effectively distinguish water features and assess vegetation water content.
Key characteristics of the NDWI indice include:
- Sensitivity to changes in water content of leaves
- Ability to penetrate canopy shadows
- Less sensitive to atmospheric effects compared to some other indices
- Useful for monitoring drought conditions and irrigation needs
3. Calculating NDWI
The NDWI indice is calculated using the following formula:
NDWI = (Green – NIR) / (Green + NIR)
Where:
- Green: Reflectance in the green band
- NIR: Reflectance in the near-infrared band
The resulting NDWI values typically range from -1 to 1, with positive values indicating open water surfaces and higher water content in vegetation, while negative values suggest dry soil and vegetation with low water content.

4. Applications of NDWI in Agriculture
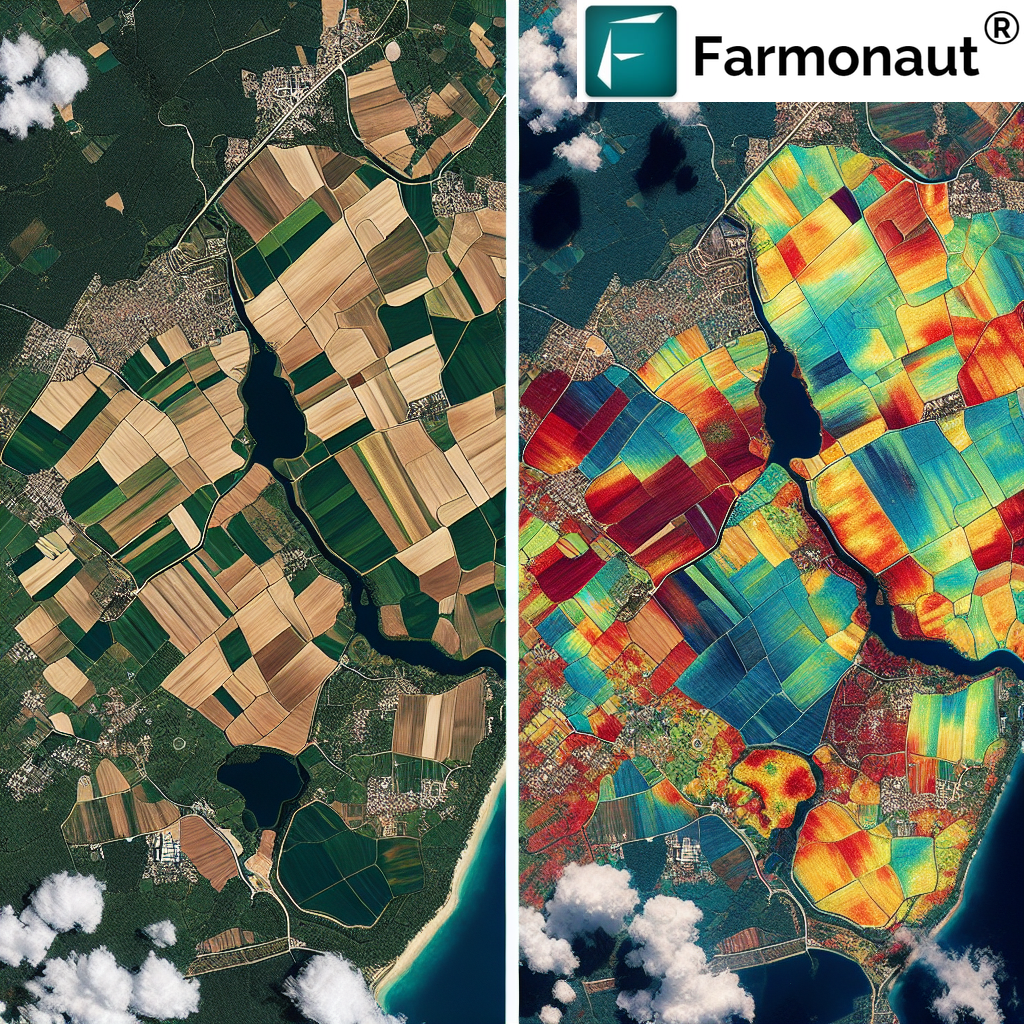
At Farmonaut, we’ve integrated NDWI into our satellite-based crop health monitoring system, enabling farmers and agronomists to leverage this powerful indice for various applications:
- Irrigation Management: NDWI helps identify areas of water stress in crops, allowing for targeted and efficient irrigation practices.
- Drought Monitoring: By tracking changes in NDWI over time, farmers can detect early signs of drought and take preventive measures.
- Crop Health Assessment: NDWI provides insights into vegetation water content, which is closely related to overall crop health and vigor.
- Wetland Mapping: For farms with wetland areas, NDWI assists in delineating and monitoring these sensitive ecosystems.
- Flood Detection: Rapid changes in NDWI can indicate flooding events, helping farmers respond quickly to protect their crops.
To access these features and more, visit our Farmonaut app or explore our API services for integration into your existing systems.
5. NDWI vs. Other Water Indices
While NDWI is a powerful tool, it’s essential to understand how it compares to other water indices:
- NDWI vs. NDVI (Normalized Difference Vegetation Index): NDWI is more sensitive to water content, while NDVI focuses on overall vegetation health and chlorophyll content.
- NDWI vs. MNDWI (Modified NDWI): MNDWI uses the shortwave infrared band instead of NIR, making it more effective for distinguishing water from built-up areas.
- NDWI vs. NDMI (Normalized Difference Moisture Index): NDMI is more sensitive to canopy water content but may be less effective in areas with sparse vegetation.
At Farmonaut, we use a combination of these indices to provide comprehensive insights into crop health and water management.
6. Farmonaut’s Integration of NDWI
Our satellite-based farm management solutions at Farmonaut leverage NDWI along with other advanced indices to provide farmers with actionable insights. Here’s how we integrate NDWI into our platform:
- Real-time Monitoring: We process satellite imagery to calculate NDWI values across your fields, providing up-to-date information on water content and stress.
- Historical Analysis: By comparing current NDWI values with historical data, we help you identify trends and anomalies in water content over time.
- AI-powered Recommendations: Our Jeevn AI advisory system incorporates NDWI data to generate personalized irrigation and crop management recommendations.
- Mobile Accessibility: Access NDWI maps and insights on-the-go through our mobile apps available for Android and iOS.
7. Benefits of Using NDWI in Precision Agriculture
Incorporating NDWI into precision agriculture practices offers numerous benefits:
- Improved Water Management: By accurately assessing crop water content, farmers can optimize irrigation schedules and reduce water waste.
- Early Stress Detection: NDWI can reveal water stress in crops before visible symptoms appear, allowing for proactive management.
- Enhanced Yield Prediction: Water content is closely linked to crop yield, making NDWI a valuable tool for yield forecasting.
- Environmental Conservation: Efficient water use based on NDWI data contributes to sustainable farming practices and conservation efforts.
- Cost Savings: By optimizing irrigation and reducing crop losses due to water stress, farmers can significantly lower operational costs.
8. Challenges and Limitations of NDWI
While NDWI is a powerful tool, it’s important to be aware of its limitations:
- Atmospheric Interference: Although less sensitive than some indices, NDWI can still be affected by atmospheric conditions.
- Mixed Pixels: In areas with diverse land cover, NDWI values may be influenced by mixed pixel effects.
- Temporal Resolution: The frequency of satellite passes limits the temporal resolution of NDWI data.
- Vegetation Density: NDWI may be less effective in very dense or very sparse vegetation cover.
At Farmonaut, we address these challenges through advanced data processing techniques and by combining NDWI with other complementary indices.
9. Future Trends in Water Indices
As technology advances, we anticipate several exciting developments in the field of water indices:
- Integration with IoT Sensors: Combining satellite-derived NDWI with ground-based sensors for more accurate and real-time water monitoring.
- Machine Learning Enhancements: Advanced algorithms to improve NDWI accuracy and interpretation across diverse landscapes.
- Hyperspectral Indices: Development of new water indices using data from hyperspectral sensors for more detailed water content analysis.
- Fusion with Other Data Sources: Integrating NDWI with weather forecasts, soil moisture data, and crop models for more comprehensive insights.
At Farmonaut, we’re committed to staying at the forefront of these developments, continuously enhancing our platform to provide the most advanced and reliable farm management solutions.
Farmonaut Satellite System vs. Drone and IoT-based Farm Monitoring
| Feature | Farmonaut Satellite System | Drone-based Monitoring | IoT-based Monitoring |
|---|---|---|---|
| Coverage Area | Large scale (regional to global) | Limited (local) | Point-based (local) |
| Frequency of Data Collection | Regular (based on satellite revisit time) | On-demand (requires manual flights) | Continuous |
| Initial Setup Cost | Low | High (drone purchase, training) | Medium to High (sensor network setup) |
| Operational Complexity | Low (automated data processing) | High (skilled operator required) | Medium (maintenance of sensor network) |
| Data Processing | Automated (AI-powered analysis) | Semi-automated (requires post-processing) | Automated (real-time data streams) |
| Scalability | Highly scalable | Limited scalability | Moderately scalable |
| Weather Dependency | Moderate (cloud cover can affect imagery) | High (affected by wind, rain) | Low (continuous operation) |
| Multi-spectral Analysis | Yes (multiple bands available) | Yes (with specialized cameras) | Limited (depends on sensor types) |
10. FAQ Section
Q1: What is the NDWI indice used for in agriculture?
A1: The NDWI indice is primarily used in agriculture for monitoring crop water content, assessing irrigation needs, detecting drought conditions, and evaluating overall plant health. It helps farmers make informed decisions about water management and crop care.
Q2: How often is NDWI data updated in Farmonaut’s system?
A2: The frequency of NDWI updates depends on the satellite revisit time and cloud cover conditions. Typically, we provide updates every 3-5 days, but this can vary based on your specific location and subscription plan.
Q3: Can NDWI be used for all crop types?
A3: While NDWI is broadly applicable to many crop types, its effectiveness can vary depending on crop structure and canopy density. It works particularly well for broadleaf crops but may require calibration for some specialized crops.
Q4: How does Farmonaut ensure the accuracy of NDWI calculations?
A4: We employ advanced atmospheric correction techniques, use high-resolution satellite imagery, and validate our results against ground truth data. Our AI algorithms also continuously improve the accuracy of NDWI interpretations based on historical data and farmer feedback.
Q5: Is NDWI data available through Farmonaut’s API?
A5: Yes, NDWI data is available through our API services. For more information on integrating NDWI and other indices into your systems, please refer to our API documentation.
Conclusion
The NDWI indice has revolutionized the way we monitor water resources and manage agricultural practices. At Farmonaut, we’re proud to incorporate this powerful tool into our suite of precision agriculture solutions, helping farmers around the world optimize their water usage, improve crop health, and increase yields sustainably.
By leveraging satellite technology, AI, and advanced indices like NDWI, we’re making precision agriculture more accessible and affordable than ever before. Whether you’re a small-scale farmer or managing large agricultural operations, our platform provides the insights you need to make data-driven decisions and thrive in an increasingly complex agricultural landscape.
Ready to experience the power of NDWI and other advanced agricultural technologies? Subscribe to Farmonaut today and take your farming to the next level:
Join us in revolutionizing agriculture through technology and data-driven insights. Together, we can build a more sustainable and productive future for farming worldwide.