Mastering Drought Mitigation: How Farmonaut’s U.S. Drought Monitor Tool Empowers Agricultural Decision-Making
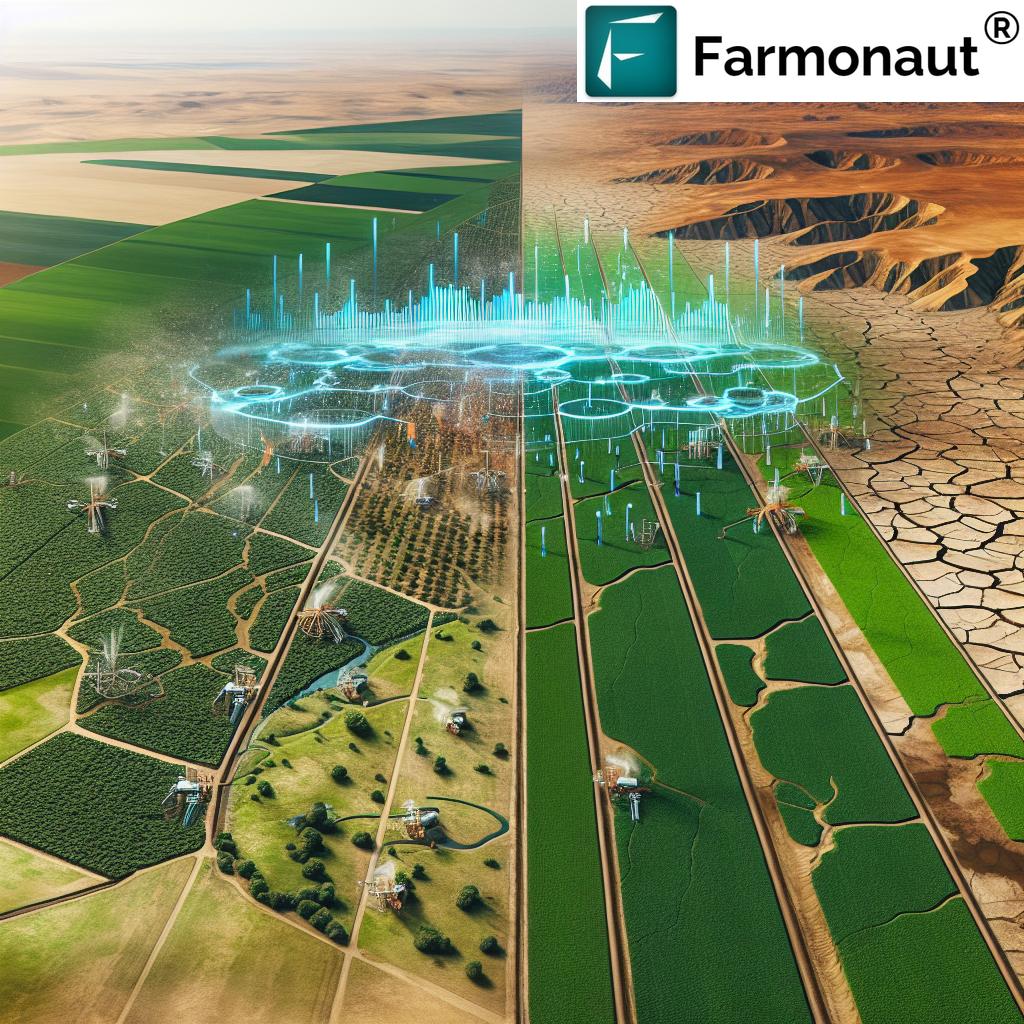
“The U.S. Drought Monitor classifies drought severity into 5 levels, from D0 to D4, providing crucial data for agricultural decision-making.”
In the ever-evolving landscape of agriculture, drought remains one of the most formidable challenges faced by farmers, policymakers, and researchers alike. As we navigate the complexities of climate change and its impact on food security, the need for robust drought mitigation strategies has never been more critical. At Farmonaut, we recognize the importance of empowering agricultural decision-making with cutting-edge technology and data-driven insights. That’s why we’re excited to introduce you to the revolutionary U.S. Drought Monitor tool, a game-changer in the realm of drought impact assessment and mitigation.
In this comprehensive guide, we’ll explore how the U.S. Drought Monitor’s “Weeks in Drought” feature is transforming the way we approach agricultural drought management. From understanding drought severity levels to leveraging precision agriculture techniques, we’ll delve into the multifaceted world of climate resilience in agriculture. Join us as we uncover the power of data visualization, time series analysis, and how these tools are shaping the future of sustainable farming across the United States.
Understanding the U.S. Drought Monitor
The U.S. Drought Monitor (USDM) is a collaborative effort between the National Drought Mitigation Center at the University of Nebraska-Lincoln, the United States Department of Agriculture, and the National Oceanic and Atmospheric Administration. This powerful tool provides a weekly map of drought conditions across the contiguous United States, Alaska, Hawaii, and U.S. territories.
One of the most valuable features of the USDM is its ability to classify drought severity into five distinct levels:
- D0 (Abnormally Dry): Areas experiencing short-term dryness but not yet in drought.
- D1 (Moderate Drought): Some damage to crops and pastures; streams, reservoirs, or wells low.
- D2 (Severe Drought): Likely crop or pasture losses; water shortages common; water restrictions imposed.
- D3 (Extreme Drought): Major crop/pasture losses; widespread water shortages or restrictions.
- D4 (Exceptional Drought): Exceptional and widespread crop/pasture losses; shortages of water in reservoirs, streams, and wells creating water emergencies.
This classification system allows for a nuanced understanding of drought conditions, enabling stakeholders to make informed decisions based on the severity and extent of drought in their specific region.
The Power of the “Weeks in Drought” Feature
“The “Weeks in Drought” feature offers time series analysis, helping farmers and policymakers assess long-term drought impacts across states and counties.”
One of the most innovative aspects of the U.S. Drought Monitor tool is its “Weeks in Drought” feature. This powerful functionality provides a time series analysis of drought conditions, allowing users to track the duration and intensity of drought events across different states and counties. By visualizing how long an area has been experiencing drought conditions, stakeholders can gain valuable insights into the long-term impacts of water scarcity on agriculture and the environment.
The “Weeks in Drought” feature offers several key benefits:
- Historical Context: By examining the number of consecutive weeks an area has been in drought, users can better understand the historical patterns and trends of water scarcity in their region.
- Impact Assessment: Long-term drought exposure can have cumulative effects on soil moisture, crop yields, and ecosystem health. This feature helps quantify those impacts over time.
- Mitigation Planning: Armed with data on drought duration, farmers and policymakers can develop more effective drought mitigation strategies tailored to their specific geographic and temporal context.
- Resource Allocation: Government agencies and NGOs can use this information to prioritize aid and resources to areas experiencing prolonged drought conditions.
At Farmonaut, we’re committed to making this valuable data accessible and actionable for our users. Our platform integrates seamlessly with the U.S. Drought Monitor, providing farmers with real-time insights into drought conditions that can inform critical decisions about water management, crop selection, and resource allocation.
Drought Severity Across the United States: A Comparative Analysis
To better understand how drought conditions vary across the country, let’s examine a comparative analysis of drought severity in different states:
| State Name | Current Drought Level (D0-D4) | Weeks in Drought | Affected Agricultural Area (%) |
|---|---|---|---|
| California | D2 (Severe Drought) | 156 | 68% |
| Texas | D1 (Moderate Drought) | 87 | 42% |
| Iowa | D0 (Abnormally Dry) | 32 | 15% |
| Arizona | D3 (Extreme Drought) | 203 | 89% |
| Florida | No Drought | 0 | 0% |
This table illustrates the diverse drought conditions across the United States, highlighting the importance of localized data in agricultural decision-making. States like California and Arizona, known for their arid climates, show longer periods of drought and higher percentages of affected agricultural areas. In contrast, states like Florida currently experience no drought conditions, emphasizing the regional variability of water scarcity challenges.
Leveraging Data Visualization for Drought Impact Assessment
One of the key strengths of the U.S. Drought Monitor tool is its powerful data visualization capabilities. By translating complex drought data into easily interpretable maps and charts, the USDM enables stakeholders to quickly grasp the severity and extent of drought conditions across different regions.
Some of the most valuable data visualization features include:
- Color-coded Maps: The USDM uses a color gradient to represent different drought severity levels, allowing for instant visual comprehension of drought patterns across the country.
- Time-lapse Animations: Users can view animations showing how drought conditions have evolved over weeks, months, or even years, providing a dynamic perspective on long-term trends.
- Comparative Charts: The tool offers side-by-side comparisons of drought conditions in different states or counties, facilitating regional analysis and benchmarking.
- Statistical Overlays: Users can overlay additional data layers, such as crop production areas or population density, to gain deeper insights into the potential impacts of drought on specific sectors or communities.
At Farmonaut, we understand the power of data visualization in agricultural decision-making. That’s why our platform integrates these USDM visualizations seamlessly, allowing farmers to access this critical information alongside our satellite-based crop health monitoring and AI-driven advisory services.
Climate Resilience in Agriculture: Strategies for Drought Mitigation
As drought conditions become increasingly prevalent due to climate change, building resilience in agricultural systems is paramount. By leveraging the insights provided by the U.S. Drought Monitor and other advanced tools, farmers and policymakers can implement a range of strategies to mitigate the impacts of drought:
- Precision Agriculture for Water Management: Utilizing advanced technologies like soil moisture sensors, weather stations, and satellite imagery to optimize irrigation practices and reduce water waste.
- Drought-Resistant Crop Planning: Selecting crop varieties that are better adapted to water-scarce conditions, or implementing crop rotation strategies that maximize water use efficiency.
- Conservation Tillage: Adopting tillage practices that minimize soil disturbance, helping to retain moisture and reduce evaporation from the soil surface.
- Cover Cropping: Planting cover crops during fallow periods to improve soil health, increase organic matter, and enhance water retention capacity.
- Water Harvesting and Storage: Implementing systems to capture and store rainwater or runoff for use during dry periods.
- Agroforestry: Integrating trees and shrubs into agricultural landscapes to provide shade, reduce evaporation, and improve overall ecosystem resilience.
- Diversification: Expanding crop diversity to spread risk and ensure that some crops are likely to thrive even under drought conditions.
By combining these strategies with real-time drought monitoring data, farmers can create robust drought mitigation plans tailored to their specific local conditions and needs.
The Role of Agricultural Decision Support Systems in Drought Management
Agricultural Decision Support Systems (ADSS) play a crucial role in translating drought data into actionable insights for farmers and policymakers. These systems integrate multiple data sources, including the U.S. Drought Monitor, weather forecasts, soil moisture data, and crop growth models, to provide comprehensive recommendations for agricultural management under varying drought conditions.
Key features of effective ADSS for drought management include:
- Real-time Data Integration: Continuously updating with the latest drought information and weather forecasts.
- Predictive Modeling: Using historical data and current conditions to forecast potential drought impacts on crop yields.
- Scenario Analysis: Allowing users to explore different management strategies and their potential outcomes under various drought scenarios.
- Customized Recommendations: Providing tailored advice based on specific crop types, soil conditions, and local climate patterns.
- Mobile Accessibility: Offering smartphone apps or mobile-responsive websites for easy access to information in the field.
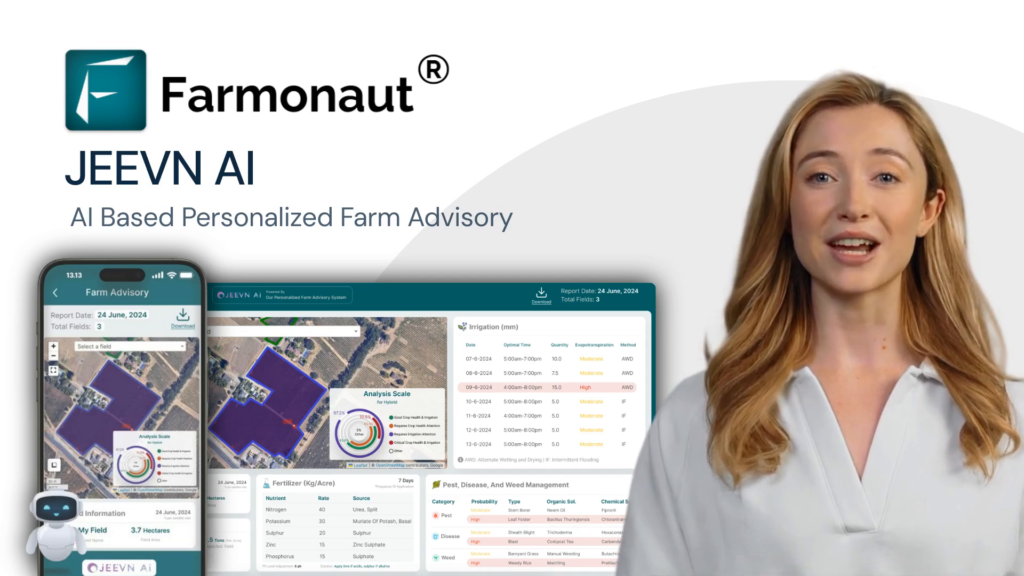
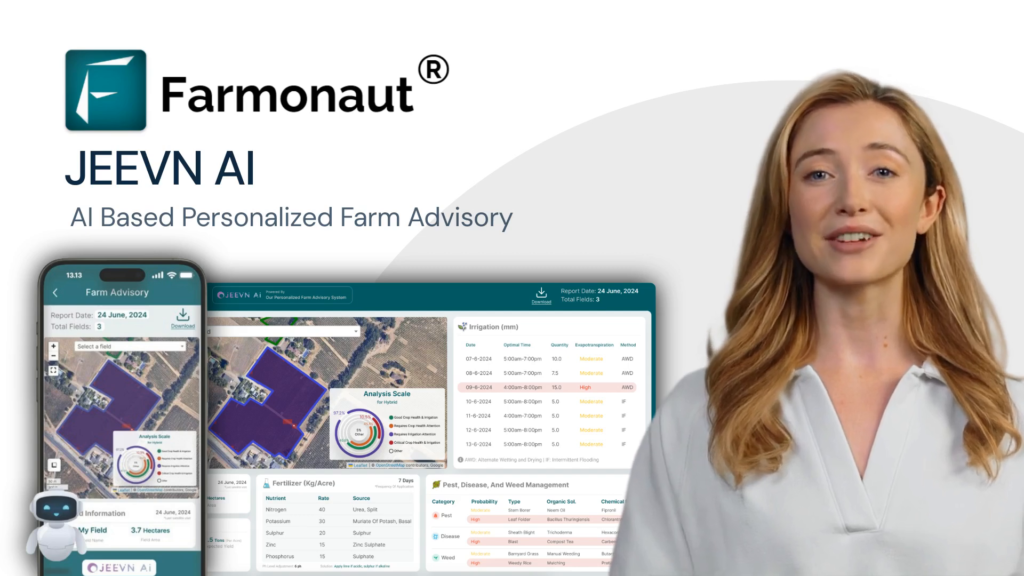
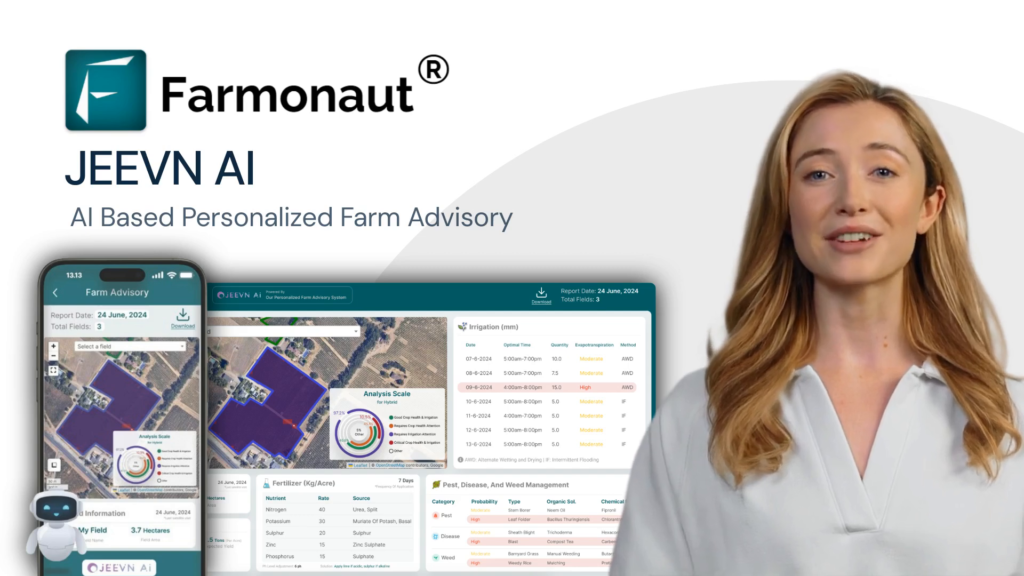
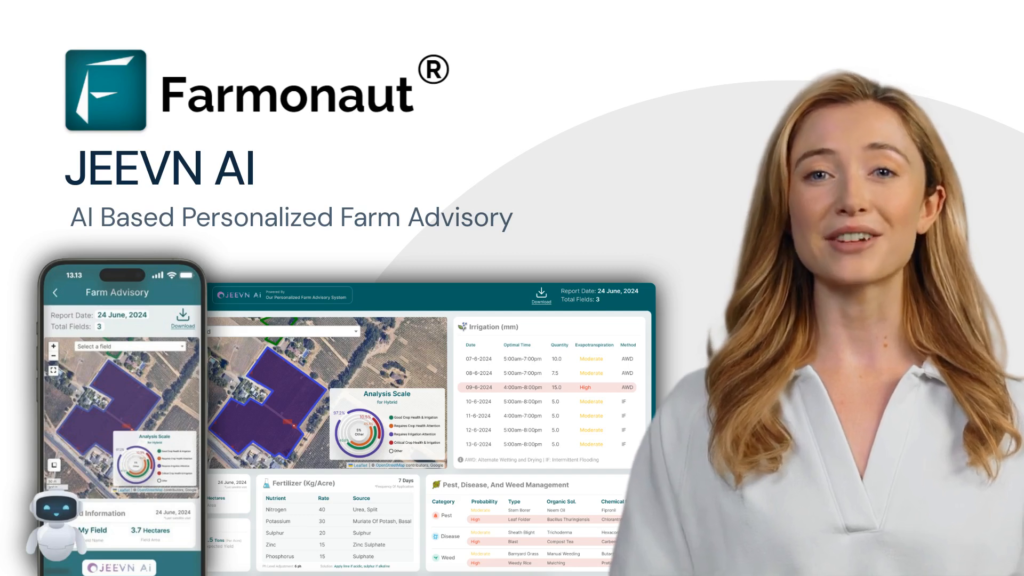
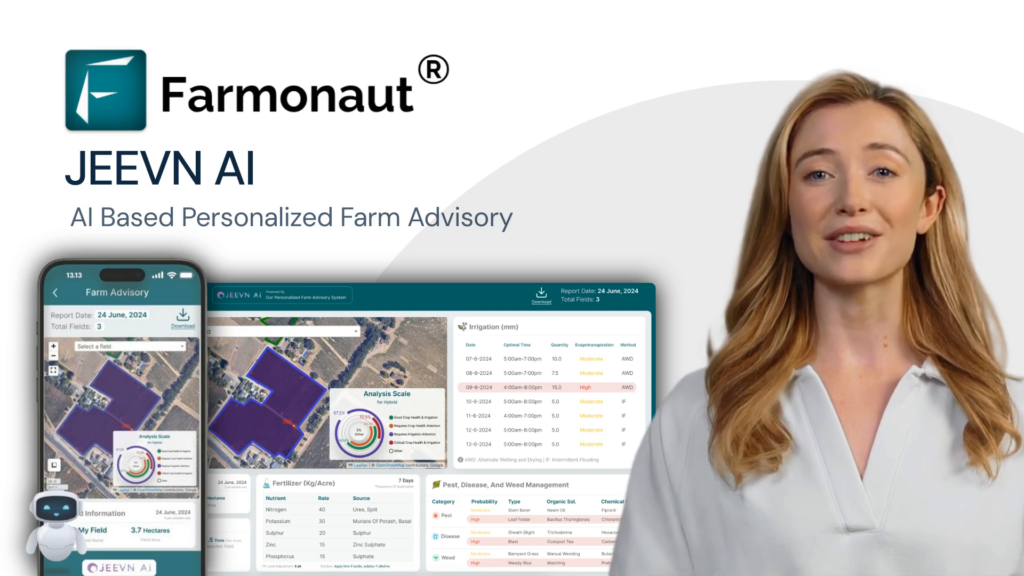
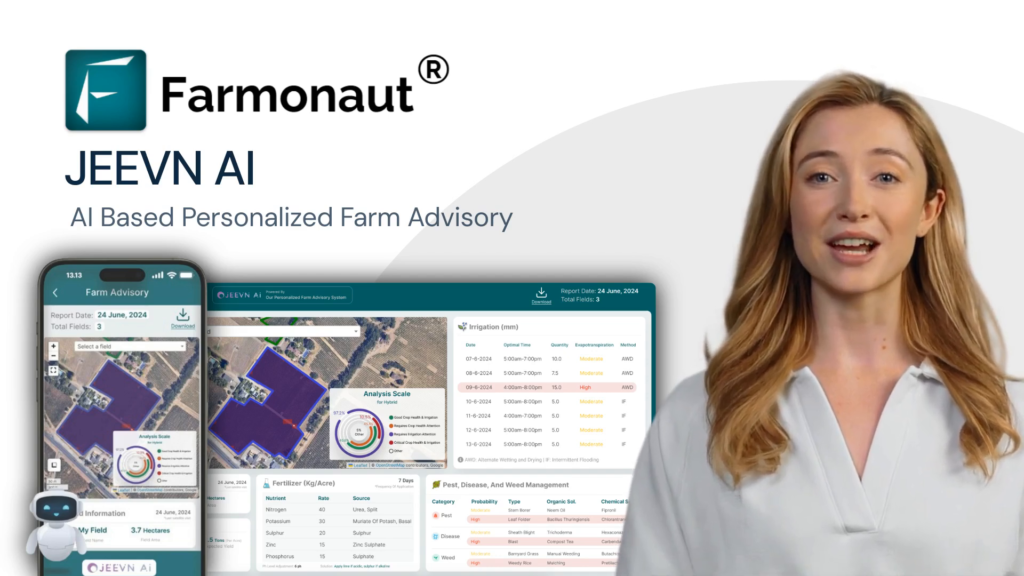
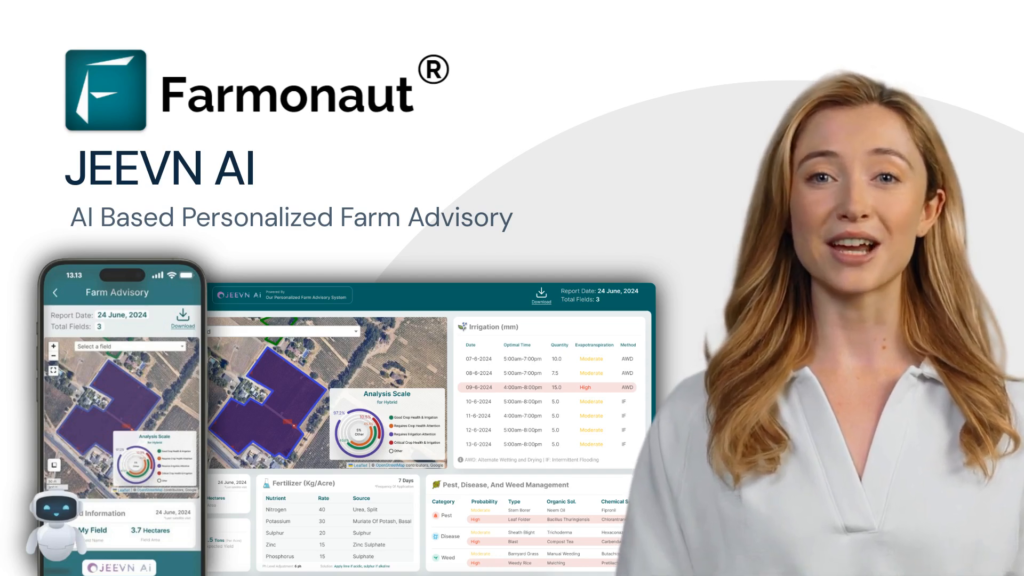
At Farmonaut, our Jeevn AI Advisory System exemplifies the power of ADSS in drought management. By combining U.S. Drought Monitor data with our proprietary satellite imagery analysis and machine learning algorithms, we provide farmers with personalized recommendations for optimal resource management under drought conditions.
Exploring Drought Impacts Across U.S. States
The U.S. Drought Monitor tool allows for in-depth analysis of drought conditions across all 50 states, as well as territories like Puerto Rico. Let’s take a closer look at how drought affects different regions of the country:
Western States
States like California, Arizona, Nevada, and Utah often face the most severe and prolonged drought conditions. The arid climate and increasing water demands make these states particularly vulnerable to water scarcity. For example:
- California’s Central Valley, a major agricultural hub, has experienced significant crop losses and groundwater depletion due to recurring droughts.
- Arizona’s Colorado River allocations have been reduced, impacting both agriculture and urban water supplies.
Great Plains
The agricultural heartland of America, including states like Kansas, Nebraska, and the Dakotas, faces unique challenges from drought:
- North Dakota and South Dakota have seen shifts in crop patterns, with farmers adapting to more drought-tolerant varieties.
- Kansas wheat production has been significantly impacted by drought cycles, influencing global grain markets.
Southeast
While generally more water-rich, southeastern states like Georgia, Alabama, and Florida are not immune to drought impacts:
- Georgia’s peach and peanut industries have faced yield reductions during drought years.
- Florida’s citrus groves require careful water management to maintain productivity during dry spells.
Northeast
Even traditionally water-abundant states like New York, Massachusetts, and Maine have experienced drought conditions in recent years:
- Reduced snowpack in New England states has led to concerns about water supplies and winter tourism.
- New York’s Catskills region, a crucial watershed for New York City, has faced increasing drought pressures.
By leveraging the U.S. Drought Monitor’s state-specific data, Farmonaut helps farmers across these diverse regions tailor their drought mitigation strategies to their unique local conditions.
The Future of Drought Planning: Integrating Multiple Data Sources
As we look to the future of drought mitigation and agricultural resilience, the integration of multiple data sources will be key to developing more accurate and actionable drought planning tools. The U.S. Drought Monitor serves as a foundational resource, but when combined with other data streams, it becomes even more powerful.
Some of the complementary data sources that can enhance drought planning include:
- High-resolution Satellite Imagery: Providing detailed information on vegetation health, soil moisture, and land use changes.
- IoT Sensor Networks: Offering real-time, ground-level data on soil moisture, temperature, and other key environmental factors.
- Climate Model Projections: Helping to anticipate future drought trends and prepare for long-term changes in water availability.
- Economic Data: Integrating information on agricultural markets, water pricing, and resource allocation to inform policy decisions.
- Social Media and Crowdsourced Data: Capturing on-the-ground observations and impacts of drought from local communities.
At Farmonaut, we’re at the forefront of this data integration effort. Our platform combines U.S. Drought Monitor data with our proprietary satellite imagery analysis, AI-driven insights, and localized weather forecasts to provide a comprehensive drought management solution for farmers and policymakers alike.
Conclusion: Empowering Agricultural Decision-Making in the Face of Drought
As we’ve explored throughout this article, the U.S. Drought Monitor’s “Weeks in Drought” feature, coupled with its comprehensive drought severity classification system, represents a powerful tool in the fight against agricultural water scarcity. By providing crucial data visualization and time series analysis capabilities, this resource empowers farmers, researchers, and policymakers to make informed decisions that protect crops, conserve water, and enhance food security.
At Farmonaut, we’re committed to leveraging these invaluable insights alongside our cutting-edge agricultural technology solutions. By integrating U.S. Drought Monitor data with our satellite-based crop health monitoring, AI advisory systems, and blockchain-based traceability tools, we’re helping to build a more resilient and sustainable agricultural future.
As climate change continues to alter precipitation patterns and increase the frequency of extreme weather events, the importance of data-driven drought mitigation strategies cannot be overstated. By embracing the power of tools like the U.S. Drought Monitor and platforms like Farmonaut, we can work together to create an agricultural landscape that not only survives in the face of drought but thrives through innovation and adaptive management.
FAQs
- Q: How often is the U.S. Drought Monitor updated?
A: The U.S. Drought Monitor is updated weekly, with new maps released every Thursday showing conditions as of Tuesday morning. - Q: Can individual farmers contribute data to the U.S. Drought Monitor?
A: Yes, the USDM welcomes local expert input through their Drought Impact Reporter tool, allowing farmers and other stakeholders to submit on-the-ground observations. - Q: How does Farmonaut integrate U.S. Drought Monitor data into its platform?
A: Farmonaut incorporates USDM data alongside our satellite imagery analysis and AI algorithms to provide comprehensive drought management recommendations tailored to each farmer’s specific location and crop types. - Q: Are there any limitations to the U.S. Drought Monitor’s classifications?
A: While the USDM is a powerful tool, it’s important to note that local conditions can vary within the broad categories. Farmonaut’s high-resolution satellite data helps provide more localized insights to complement the USDM. - Q: How can policymakers use the “Weeks in Drought” feature for long-term planning?
A: The “Weeks in Drought” data helps policymakers identify areas prone to persistent drought, informing infrastructure investments, water allocation policies, and agricultural support programs.
By leveraging the power of the U.S. Drought Monitor alongside Farmonaut’s advanced agricultural technology solutions, we can work together to build a more resilient and sustainable future for farming. Join us in this mission by exploring our comprehensive suite of tools designed to empower agricultural decision-making in the face of climate challenges.
Ready to revolutionize your approach to drought management? Explore Farmonaut’s cutting-edge solutions today:
For developers interested in integrating our powerful drought management tools into their own applications, check out our API and API Developer Docs.

