Month: March 2023

Lentil: Area and Yield survey in UP and MP

Farmonaut did Lentil satellite survey of Lentil in states of major districts Uttar Pradesh and Madhya Pradesh in the year 2022-23 which showed area of Lentil increased in Uttar Pradesh by 3% over last year in major districts and yield increased 7% over last year, and yield in Madhya Pradesh increased by 4% over last year in major districts.  

In Uttar Pradesh, Jhansi reported highest rise in area in area with rise of 15% over last year at 31.34 thousand hectares followed by Bharaich which rose 6% over last year at 55.67 thousand hectares while Jalaun reported largest fall in acreage by 6% to over last year at 29.45 thousand hectares followed by Mahoba which saw a fall of 2% over last year at 31.33 thousand hectares. Similarly, Bahraich showed highest rise in yield by 10% over last year at 937.97 Kg/Ha followed by Jalaun  showing a rise by 7% over last year at 902.92 Kg/Ha while Lalitpur showed lowest increase by 2% over last year at 859.70 Kg/Ha followed by Shravasti which rose by 4% over last year at 865.53 Kg/Ha. The highest area was reported in Bahraich followed by Banda which showed increase of 1% in area over last year at 36.56 thousand hectares. Moreover, highest yield was reported in Jhansi which rose by 6% over last year at 978.78 Kg/Ha followed by Bahraich. Highest production was reported in Bahraich at 52.22 thousand tons followed by Banda at 32.02 thousand tons while the lowest production was reported in Shravasti at 16.72 thousand tonnes followed by Lalitpur at 18/33 thousand tonnes. The total area in major districts of UP rose by 3% over last year at 279.88 thousand hectares and average yield for the state rose by 7% and is reported at 905.51 Kg/Ha. Overall, the total production for 2022-23 in major districts of Uttar Pradesh was reported at 253.44 thousand tonnes. 

Similarly in Madhya Pradesh highest area was reported Sagar at 95.91 thousand hectares followed by Vidisha 71.32 thousand hectares while the lowest area was in Panna at 19.23 thousand hectares followed by Ashoknagar at 28.67 thousand hectares. In Madhya Pradesh, yield rose the most in Damoh by 11% over last year at 1136.36 Kg/Ha followed by Vidisha which rose by 7% over last year at 973.24 Kg/Ha  while it fell most in Dindori by 5% compared to last year at 896.85 Kg/Ha followed by Narshinghpur which fell by 1% over last year at 900.19 Kg/Ha. Moreover, highest yield was reported in Damoh followed by Vidisha at 973.24 Kg/Ha. Similarly, highest production was reported at Sagar at 87.03 thousand tonnes followed by Vidisha at 69.41 thousand tons. Lowest production was reported in Panna at 17.72 thousand tonnes followed by Narshinhpur at 30.0 thousand tonnes. Average yield of the major districts Madhya Pradesh were reported higher by 4% over last year at 951.36 Kg/Ha. Overall, the total production for 2022-23 in Madhya Pradesh was reported at 396.69 thousand tonnes. Favourable weather in both Uttar Pradesh and Madhya Pradesh led to higher yield in both states.

Farmonaut is revolutionizing agriculture through satellite data with a vision to help farmers and agriculture enthusiast worldwide in cost-effective way. By providing data on Crop Health, water stress, Weather forecasts and many more; the agriculture industry can make informed decisions about crop management. As climate change continues to posses’ risk on Agriculture industry, Farmonaut’s services can play a crucial role in mitigating risks. 

By utilizing Farmonaut’s platform, farmers an access up-to-date information on vegetation water stress, evapotranspiration, soil organic carbon and weather forecasts, allowing them to make data-driven decisions on fertilization, pest management, irrigation needs and advisory. This proactive approach to crop management can potentially help mitigate the effects of climate change, reduce the risk of lower crop yields, and decrease inflationary impacts on food prices.

With over 1 million hectares of farmland monitored, Farmonaut is providing data to farmers and corporates worldwide. Some of our major clients/partners include Godrej Agrovet, ITC Limited, Coromandel International, Troforte Fertilizers, Australia, FFBS Germany and so many more!


Land Use Land Classification

Land classification is basically providing information on the type of activity taking place on the land and categorizing it. The land uses are of different types such as for industrial use, residence use, rural, urban, water reserves, agriculture area, etc. It can be classified and displayed through remote sensing using the satellite. Remote sensing would provide reliable and accurate information on the land use.

Benefits of LULC

Land Use Land Classification helps the private and government institutions in following ways:


  • Initiate in formation of policies and schemes for development.

  • Know the land utilization aspects 

  • Helps in managing, monitoring and planning at district, taluka and village level.

  • Keep an eye on the urban and rural development over years.

  • Study the changes in the environment.

  • Create a sustainable solution for future development.

  • Check the progress in every sector such as agriculture, forest, industrial, etc.

New Addition by FARMONAUT

Farmonaut has recently added a new feature to their application which majority can be useful to the industries and government as a whole. The feature added can be said as Land Classification based on its use. The Land on district level, taluka level or village level can be classified based on the activities being carried out. However there are multiple use cases to such addition being made by Farmonaut. We have been providing services to individual farmers and corporations on a large scale in the field of agriculture. With addition of land classification through satellite monitoring, we tend to help institutions beyond agriculture.


As stated above the benefits of land classification for institutions in a vast range, Farmonaut has received a request from their former client to introduce such features for their own use.

How to use Land Use Land Classification?

Step 1: Login to your account on the Farmonaut application.

Step 2: Select the farm you want the Land classification for.


Step 3: Open the dropdown menu of the Map controls on the left.


Step 4: Click on the “LULC” button under the For Land Use Land Classification.

Step 5: The image will be displayed on the map.


Step 6: Analyze using the color coding provided.

Soil Testing : Introduction

Soil tests are conducted on one or more varieties of soil for knowing the health of soil or to analyze various possible soil parameters. Soil testing is majorly performed in Agriculture and construction industries to possibly know the health and to get better results. However, in India agriculture isn’t much aware about the importance of soil testing for crop health and soil health.

The parameters involved in soil testing are Soil temperature, Soil pH, Nutrients such as N, P, Mg, K, Cl, etc.

Importance of soil testing in agriculture

In agriculture, 60% of crop yield depends on soil fertility which accounts into making sure of the good quality of soil. With better quality results in better yield of crops. Some other importance of soil testing can be as follows:

  • Know the current health of soil and improve it: Testing reports provides various soil parameters which would be helpful to know the condition and add on the required nutrients or maintain the soil moisture as well. Eventually results in better soil fertility and higher yield.

  • Avoid soil erosion, degradation, etc: With each year soil fertility has been decreasing due to erosion which has caused imbalance in soil management. Also, soil degradation affects the livelihood and health of people. However, Soil restoration is a costly and time consuming process hence, soil management is the efficient and effective way of maintaining soil conditions.

  • Minimize the use of fertilizers: Excess use of fertilizers can degrade the soil quality and fertility. With soil reports excess use of fertilizers can be avoided.

  • Decrease the cost: Unawareness of excess fertilizers used in the farms, the cost of fertilizers and labor increases. It can be reduced by knowing the required amount of fertilizers.

  • Maintain uniformity in nutrients across fields: the soil testing provides all the nutrients data as well which gives an idea to the farmers on what nutrients are to be used. Soil samples from different locations on farms would help to maintain uniformity in the soil nutrients along the field.

  • Improve in yield: Knowing all the parameters of soil would result in better soil quality and improve the yield.

SOIL SAMPLING

Soil sampling is done by the farmers by collecting the soil samples from different locations on the farms. It is basically the soil collected from different locations of the farms (based on the area) and sent to the labs for knowing the nutrients and soil health. The soil must be clean from plants and must be taken from a depth of 6-12 inches (varies according to the test).

What FARMONAUT offers?

Farmonaut, along with crop health monitoring, has introduced a feature to reduce the work of farmers and help them in efficient soil testing procedures. Soil reports can be obtained by the Farmonaut platform. The feature is currently available on the web application of Farmonaut, they have been working to provide the same on mobile application as well. The farmers already associated with Farmonaut have been using this feature for soil testing their farms. They have also been providing the services to businesses and individual farmers as well. Troforte Innovations is an example of using this feature for their farmers in collaboration with Farmonaut. 


The soil testing would as follows:

  1. COLLECTION OF SOIL: The farmer must collect the soil from his/her farm from different locations in the bags. The bags provided have barcodes with 8-10 digits on them for digital use.

  2. FORWARD THE SAMPLES: The bags are sent to the soil testing Labs for soil testing.

  3. TESTING THE SOIL: Soil testing Labs performs multiple tests nearly 10-15 tests. The tests help to identify various parameters such as pH, EC (electric conductivity), Carbon content, Saturation percentage and Nutrients like Potassium, Nitrogen, Magnesium, Phosphorus, etc.

  4. UPLOADING THE RESULTS: The result of soil tests were obtained manually by the farmers. Farmonaut has made it easier through technology which provides the data digitally on their devices. The soil testing labs can upload the results of the tests through API endpoint which then will match with the barcode added by the farmers in order to display the results on their device.

  5. EASY ACCESS TO RESULTS: The access to the soil tested data can be gained by scanning the barcodes on the bag. The farmer/user have to add the field and the soil sample information which includes 3 data points as shown in the figure below: 

  • Select the field: The field must be selected from the fields that have already been marked/geotagged by the user.

  • Barcode: The barcode can be scanned or barcode number can be typed by the user.

  • Sample Location: The user has to select the location on the map from where the soil sample was taken.

The platform has an option “REPORTS” which displays the soil results and also helps to add the soil sample data as above. After adding the field if the results of the test are available it shows Purple color otherwise gray if results are not available.

The reports that are obtained from the testing labs included more than 100 parameters. Also, the user can easily search for the parameters they need.

conclusion

Soil fertility has been a major issue over the past years in agriculture production. Soil sampling is done by the farmers from their farms which is then sent to testing labs. The reports generated were manually sent to the farmers which may take more than a day. To overcome this, Farmonaut has come up with a service that provides data with ease to the farmers on their devices just by a few clicks.

Wheat Yield Calculation in Saharsa (Bihar) Based on Remote Sensing

Introduction:

Yield calculation of the crop is very important for assessing the production and it depends on many variables like soil, weather, agricultural practices (date of planting, amount of irrigation and fertilizer use), seeds, pests, weeds, biotic stress plant varieties etc.

Remote sensing provides an effective and efficient way to forecast yield. Remote sensing has been widely used by many institutions across world to calculate area and yield of a crop.

In this paper, we focus on forecasting yield of wheat based on data from Sentinel-2 satellite data. The study area was wheat crop in Saharsa (Bihar). The crop is in advanced stage and has vegetated fully and harvest is expected in next 20-30 days.

Methodology:

Data from Sentinel-2 was used and random fields were selected from the mapped area and yield was calculated using NDVI (Normalized Difference Vegetation Index) and LAI (Leaf Area Index).

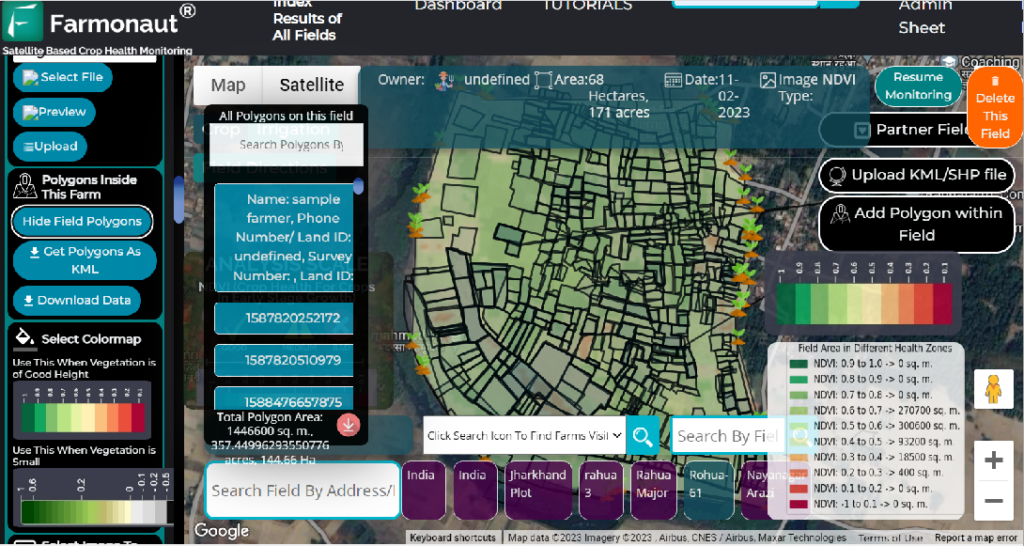
Farmonaut platform was used to map fields to create bounded regions (fields) as shown in Figure-1. On the dates of observations the sample fields were free from clouds and normal data was observed. Crop classification was done manually by ground truthing to ascertain the crop is standing in the field.

Figure-1 Comparison of peak NDVI in 2022 Vs 2022 wheat crop

Figure-2 Comparison of peak NDVI in 2023 Vs 2021 wheat crop

NDVI was used to calculate yields for the given fields which means peak vegetative growth rate. Peak vegetative growth helps to forecast yields more accurately.

Below are the observations of NDVI of the various fields. The maximum NDVI was reached on 11-Feb-2023 compared to 8-March-2022 and 21-Feb-2021. From the NDVI, LAI was calculated which was subsequently used to calculate yield. This approach is being used after going through a lot of available texts and final model was considered.

In this procedure the estimated LAI was used with WTGROWS model for yield mapping. This model suggests direct correlation between grain yields and LAI. This relationship was applied to all the fields to calculate yields.

NDVI started to rise after planting of crop in November continued to rise until 11-Feb-2023 which is 10 days before normal peak NDVI, making the inappropriate for calculating yield. So, the next NDVI read on 16-Feb-2023 was used to calculate yields. The NDVI started falling after 11-Feb-2023 and will fall until harvest. Best results of yield are obtained when the NDVI is maximum. However, if it reaches its peak NDVI before time and falls sharply then max NDVI is not the best barometer and the next 2 NDVI reads are very important.

NDVI and LAI showed the best correlation for the estimated yields. The yields ranged from 3.35-3.64 compared to 2.87 Tons/ha to 2.98 Tons/ha last year (2021-22) and 3.5 Tons/ha to 3.7 Tons/ha in (2020-21).

Figure-3

  Area (sq. m.) 01-Feb-23 11-Feb-23 16-Feb-23 21-Feb-23 Maximum LAI Estimated Yield Kg/ha
Field 1 3600 0.7 0.7 0.6 0.4 1.827376043 2981
Field 2 7700 0.67 0.7 0.6 0.4 1.827376043 2981
Field 3 1500 0.7 0.69 0.6 0.39 1.80621064 2963
Field 4 3100 0.7 0.7 0.6 0.39 1.80621064 2963
Field 5 6600 0.68 0.65 0.59 0.34 1.684268057 2853
Field 6 2700 0.66 0.67 0.6 0.4 1.827376043 2981
Field 7 2000 0.65 0.62 0.6 0.34 1.704004521 2871
Field 8 4300 0.57 0.67 0.6 0.4 1.827376043 2981
Field 9 1700 0.65 0.63 0.68 0.35 1.892372025 3036
Field 10 3700 0.71 0.7 0.6 0.4 1.827376043 2981

Figure-4

  Area (sq. m.) 26-Feb-22 03-Mar-22 08-Mar-22 13-Mar-22 Maximum LAI Estimated Yield Kg/ha
Field 1 3600 0.4 0.5 0.5 0.44 1.827376043 2981
Field 2 7700 0.4 0.5 0.5 0.43 1.827376043 2981
Field 3 1500 0.4 0.48 0.5 0.45 1.827376043 2981
Field 4 3100 0.4 0.49 0.5 0.43 1.827376043 2981
Field 5 6600 0.4 0.44 0.49 0.4 1.785290384 2944
Field 6 2700 0.39 0.43 0.47 0.4 1.704004521 2871
Field 7 2000 0.4 0.48 0.49 0.42 1.785290384 2944
Field 8 4300 0.4 0.44 0.48 0.41 1.744173984 2908
Field 9 1700 0.4 0.46 0.5 0.44 1.827376043 2981
Field 10 3700 0.4 0.49 0.5 0.48 1.827376043 2981


Figure-5

  Area (sq. m.) 01-Feb-23 11-Feb-23 16-Feb-23 21-Feb-23 Maximum LAI Estimated Yield Kg/ha
Field 1 3600 0.6 0.7 0.7 0.7 2.912119253 3713
Field 2 7700 0.6 0.7 0.69 0.67 2.912119253 3713
Field 3 1500 0.59 0.7 0.7 0.69 2.912119253 3713
Field 4 3100 0.6 0.7 0.7 0.69 2.912119253 3713
Field 5 6600 0.59 0.7 0.68 0.67 2.912119253 3713
Field 6 2700 0.57 0.7 0.68 0.67 2.912119253 3713
Field 7 2000 0.52 0.64 0.64 0.64 2.532181241 3493
Field 8 4300 0.59 0.7 0.7 0.7 2.912119253 3713
Field 9 1700 0.52 0.65 0.66 0.64 2.591873781 3530
Field 10 3700 0.6 0.7 0.7 0.69 2.912119253 3713

Figure-6

Observations and calculations:

The early Max NDVI occurred due to warm winter, dry conditions, less clouds and heat tolerant yield variety. The early NDVI reached and forecast of high temperatures will adversely impact yield of the crop. Generally peak NDVI reached by 20-28 Feb but this year it has reached 10 days before and the average temperature is much higher than normal temperature and forecasted temperature is almost 10 Degree Centigrade higher than normal year will adversely affect yield in maturity stage. Higher NDVI reached before due date is abnormal and due to that peak NDVI is not used here but the next reading on 16-Feb-2023 was used to calculate yields. Also, the fall in NDVI is much sharper than 2021-22 and 2020-21 which shows that there will be major fall in yields.

Also, the average max temperature in the crop season was above corresponding period last year and 2020-21 and humidity and cloud cover were significantly lower than 2021-22 leading to more sunlight and higher temperatures on the crop thereby affecting the quality of crop and lower yields. Lower humidity leads more sunlight in winter and if temperatures remain above average than it impacts yields. Also, there is forecast of temperatures reaching 38 Centigrade by March 5 will adversely impact crop when it is in maturity phase.

In the Figure 1, there is comparison of peak NDVI of 2022-23 wheat crop vs 2021-22 while crop showing that last year wheat crop was in worse condition than current year and the average yield was 2.96 Tonnes/Hectare in the above plot while this year the average yield in the above 10 fields are 3.37 Tonnes/Hectare which is approximately 14% above last year and 9% lower than 2020-21. The data was corroborated with discussion with Krishi Vigyan Kendra- Saharsa which said the peak crop yield will fall for late shown non heat resistant varieties and heat resistant varieties have low yields. Advisories have been given to irrigate fields and use micronutrients to mitigate fall in yields. Also, heat resistant varieties have yield in the range of 3.5-4.0 Tonnes/Hectare. Long Period Average yield of rice is 4.3-4.5 Tonnes/Hectare for normal varieties which are sown on time. The yield in 2022-23 is 3.37 Tonnes/Hectare was 2.96 Tonnes/Hectare last year which is approximately 25-30% lower than Long Period Average but 14% higher than last year. The crop will be ready to harvest by End-March-2023 compared to mid-April last year and start of April in 2020-21.

Results:

Data from our observation show that the average yield is 3.37 Tonnes/Hectare compared to 2.96 Tonnes/Hectare in the same fields last year. The yield ranges from 3.31 Tonnes/Hectare to 3.64 Tonnes/Hectare compared to 2.87 Tonnes/Hectare to 2.94 Tonnes/Hectare last year and 3.4 Tonnes/Hectare to 3.71 Tonnes/Hectare in 2020-21.

The above-mentioned forecasted yields can vary depending upon weather and other unavoidable factors before harvest. If normal condition prevail then the above yields can be achieved subject to error of 10%.

The researches done in the area of yield forecasting of field crops by remote sensing has demonstrated good results. With the help of new sensors and indexes, researchers can calculate yields with less errors in future.


Global economic slowdown will reduce exports and slow Indian economy, causing income and inflation issues. This will particularly impact farmers and the poor due to peak food inflation.


Farmonaut is revolutionizing agriculture through satellite data with a vision to help farmers and agriculture enthusiast worldwide in cost-effective way. By providing data on Crop Health, water stress, Weather forecasts and many more; the agriculture industry can make informed decisions about crop management. As climate change continues to posses’ risk on Agriculture industry, Farmonaut’s services can play a crucial role in mitigating risks. 

By utilizing Farmonaut’s platform, farmers an access up-to-date information on vegetation water stress, evapotranspiration, soil organic carbon and weather forecasts, allowing them to make data-driven decisions on fertilization, pest management, irrigation needs and advisory. This proactive approach to crop management can potentially help mitigate the effects of climate change, reduce the risk of lower crop yields, and decrease inflationary impacts on food prices.

With over 1 million hectares of farmland monitored, Farmonaut is providing data to farmers and corporates worldwide. Some of our major clients/partners:


Written By:

Dipanker Gyan


CONTACT US AT: