

Reviewed September 2026 against University of Florida IFAS (Publication FE983), USDA NASS Florida Citrus Forecast, and farmdoc daily (University of Illinois).
Try it: Run your own numbers →
Citrus Greening in Florida: What It Costs & How Growers Fight It
Citrus greening — huanglongbing, or HLB — is a bacterial tree disease spread by the Asian citrus psyllid that now affects roughly 90% of Florida’s citrus acres, according to a University of Florida IFAS grower survey (Publication FE983). Growers surveyed reported an average 41% yield loss from the disease, with Central Florida groves running worse at 45%. There is no cure; the entire Florida citrus industry has spent nearly two decades building a response out of resistant rootstocks, satellite-based grove monitoring, biological psyllid control, and aggressive tree removal — and that response is the subject of this article.



What Is Citrus Greening?
Citrus greening, or huanglongbing (HLB), is caused by the bacterium Candidatus Liberibacter asiaticus, which the Asian citrus psyllid carries from tree to tree as it feeds on new leaf growth. Once a tree is infected there is no cure available to growers — management is entirely about slowing spread and keeping infected trees productive as long as possible. The disease blocks the phloem, the tissue that moves sugars through the tree, which starves the root system and shows up above ground as:
- Blotchy, yellowing leaves — often asymmetric on either side of the leaf’s midrib, the clearest field diagnostic.
- Stunted shoot and root growth, reducing the tree’s capacity to size fruit.
- Bitter, lopsided, green-shouldered fruit that packing houses reject for fresh sale.
- Premature fruit drop, cutting yield well before harvest.
- Progressive dieback and tree death within a few years of infection if left unmanaged.
There is no rescue treatment that clears the bacterium from an infected tree. Every grower response described below is either prevention (keeping healthy trees from being infected), suppression (killing the psyllid vector before it spreads the bacterium further), or replacement (removing infected trees and resetting with new stock before they become an infection source for neighboring rows).
Citrus Greening’s Impact on Florida: The Numbers
The scale of citrus greening’s impact in Florida is best read through University of Florida IFAS’s 2023 grower survey, published as Publication FE983. Surveyed growers reported that greening affects an average of 90% of citrus acreage and 80% of individual trees across the state. The resulting yield loss averaged 41% statewide, but that figure is not uniform — Central Florida growers, which includes Polk County groves, reported a steeper 45% average yield loss, likely reflecting both grove age and psyllid pressure in that region.
The financial toll has a longer paper trail. A University of Florida study tracking the first five seasons of the epidemic — 2006-07 through 2010-11 — put cumulative lost revenue to the state’s citrus industry at $3.63 billion, alongside 6,611 jobs lost as packing houses, harvest crews, and input suppliers scaled down with the shrinking crop (University of Florida News, 2012). That study is now over a decade old and does not capture losses since 2011 — but no comparably comprehensive economic accounting has superseded it, which is itself a sign of how the industry’s scale has contracted since.
Acreage tells the same story from a different angle. USDA NASS’s Citrus Statistics report put Florida’s citrus bearing acreage at 387,100 acres for the 2023-24 season (USDA NASS Citrus Statistics, 2023-24). Two seasons later, the USDA NASS Florida Citrus Forecast for 2025-26 shows orange acreage alone at 143,650 acres, producing a forecast 12.9 million boxes (USDA NASS Florida Citrus Forecast, 2025-26). USDA NASS publishes updated Florida Citrus Forecasts four times a year — January, April, July, and September — so the September 2026-27 release is the next point to check for whether acreage and box counts have stabilized or continued to contract.

The Florida Citrus Industry Today
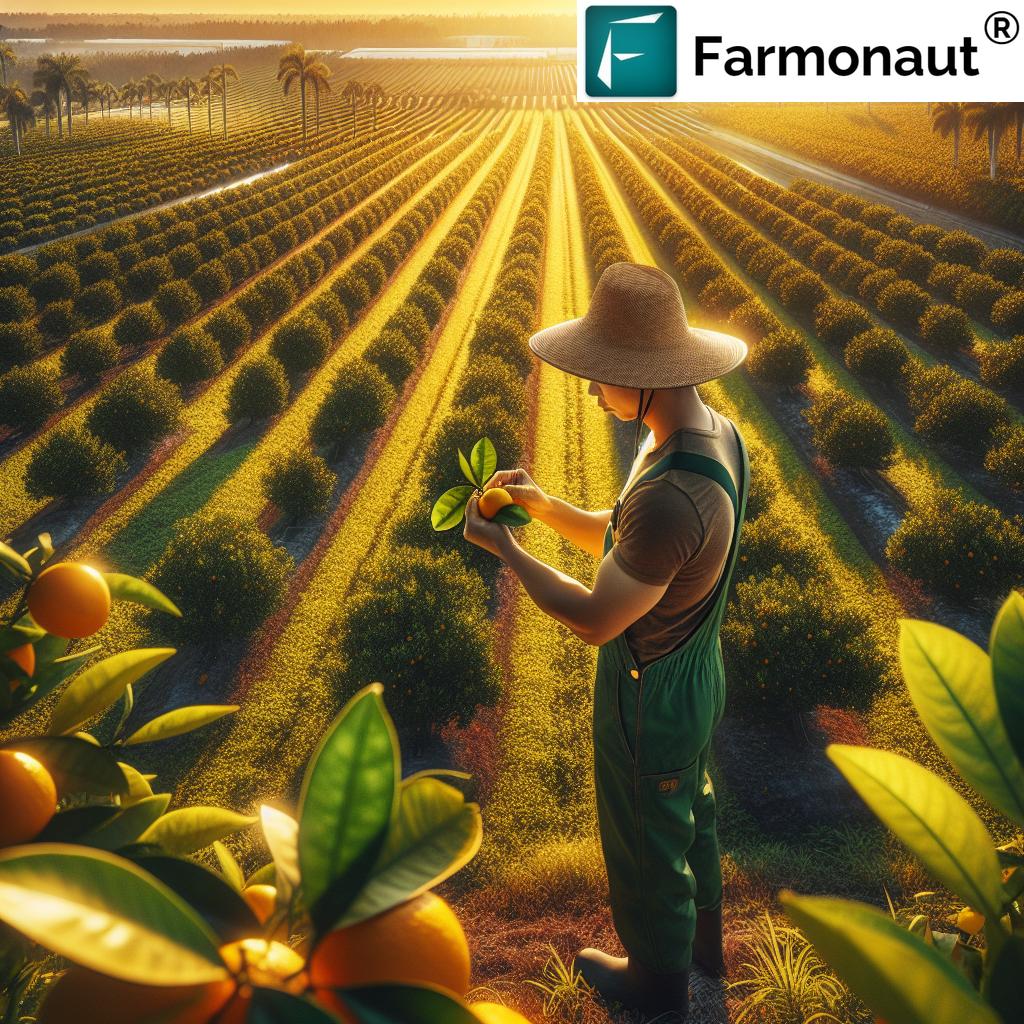
Florida’s citrus industry is concentrated in a band of counties running from Polk south through Highlands and Hardee, historically the heart of the state’s orange production. The USDA NASS acreage and forecast figures above describe an industry that is smaller than it was two decades ago, but still commercially significant — 143,650 bearing acres of oranges alone as of the 2025-26 forecast, spread across family-run groves and larger corporate operations.
Three pressures compound on top of citrus greening for growers deciding whether continued citrus farming in Florida pencils out:
- Freeze risk in central and northern growing areas, which can damage or kill fruit and young wood in a single cold night.
- Hurricane exposure, which knocks fruit to the ground pre-harvest and can uproot or defoliate trees outright.
- Land-conversion pressure, as urban growth around Orlando and Tampa makes selling grove land to developers more attractive than replanting it after a greening-driven yield collapse.
Against that backdrop, the industry’s response to citrus greening has shifted from hoping for a cure to building operating practices — described in the seven-part breakdown below — that keep yield-per-acre economically viable despite an infected tree base.
Fertilizer Costs and Alternatives for Citrus Growers
Greening-stressed trees are more dependent on precise nutrition than healthy ones, because a damaged root and phloem system has less margin for waste — over-application doesn’t reach the tree, and under-application accelerates decline. That makes current fertilizer pricing directly relevant to grove economics, not a side issue.
farmdoc daily at the University of Illinois tracks USDA’s FOB NOLA (New Orleans) barge prices for the major fertilizer commodities, updated quarterly. For Q2 2026, the reported ranges were:
- DAP (phosphate): $590–660 per ton
- Urea (nitrogen): $355–415 per short ton
- MOP (potash): $345–400 per short ton
(farmdoc daily, University of Illinois, August 2026)
These are barge-level commodity prices, not delivered-to-grove retail prices, so a Florida buyer should expect a markup for freight, blending, and dealer margin on top of these figures. Because farmdoc daily republishes this series every quarter, the way to get a current number rather than this snapshot is to search “Fertilizer Prices” directly on farmdocdaily.illinois.edu, where the chart resets each quarter (Q1 through Q4).
On fertilizer alternatives: the research brief behind this article does not contain published cost data for specific alternative-nutrition programs — compost, foliar micronutrient sprays, biological soil amendments, or slow-release coated formulations — so this article will not invent comparative pricing for them. What is documented, and covered in the grove-management section below, is precision variable-rate application guided by soil moisture and satellite vegetation data, which reduces the volume of DAP, urea, and MOP a grove needs to buy at the prices above by targeting inputs only where trees show measurable uptake capacity, rather than applying a flat rate across a block regardless of tree health.
H-2A Labor Solutions for Citrus Grove Management
Citrus harvest in Florida is still largely hand-picked, and the H-2A visa program supplies a substantial share of that seasonal labor across the industry. The Adverse Effect Wage Rate (AEWR) — the minimum hourly wage H-2A employers must pay in Florida — was set at $16.23 per hour for 2025, per the U.S. Department of Labor’s published rate as reported by Citrus Industry Magazine (Citrus Industry Magazine, December 2024). The AEWR is republished roughly twice yearly under federal rule, typically with updates in January and July, so growers budgeting a harvest crew should check Citrus Industry Magazine or the Department of Labor’s own H-2A wage pages directly for the rate in effect at the time of hire rather than relying on a prior year’s figure.
For grove management specifically, “H-2A solutions” in practice means pairing a certified labor contractor or H-2A program with tools that make each worker-hour more productive on a smaller, greening-stressed canopy — targeted harvest routing to blocks with the highest fruit-per-tree counts, and mapped removal/reset schedules (covered in the section below) so crews aren’t searching a grove for dead trees block by block. The research brief for this article does not include a published figure for what share of Florida’s citrus acreage is harvested by H-2A labor versus domestic crews; that breakdown is not publicly tracked at the state level in the sources reviewed here.
Seven Ways Florida Growers Are Fighting Greening
None of these tactics cures HLB on its own. Growers who are holding yield losses closer to the 41% statewide average than the 45% Central Florida average tend to be running several of these in combination, not relying on one.
-
Planting Disease-Tolerant Rootstocks and Varieties
Breeding programs have released rootstocks with measurably better tolerance to HLB infection pressure — not immunity, but slower decline and better fruit retention once infected. Resets on these rootstocks are now standard practice across affected counties, aimed at keeping future citrus greening losses below the 41-45% range documented in the IFAS survey.
-
Precision Grove Monitoring via Satellite
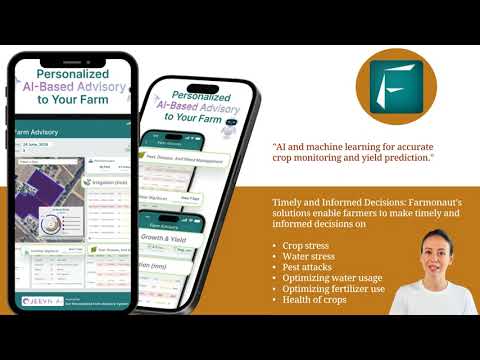
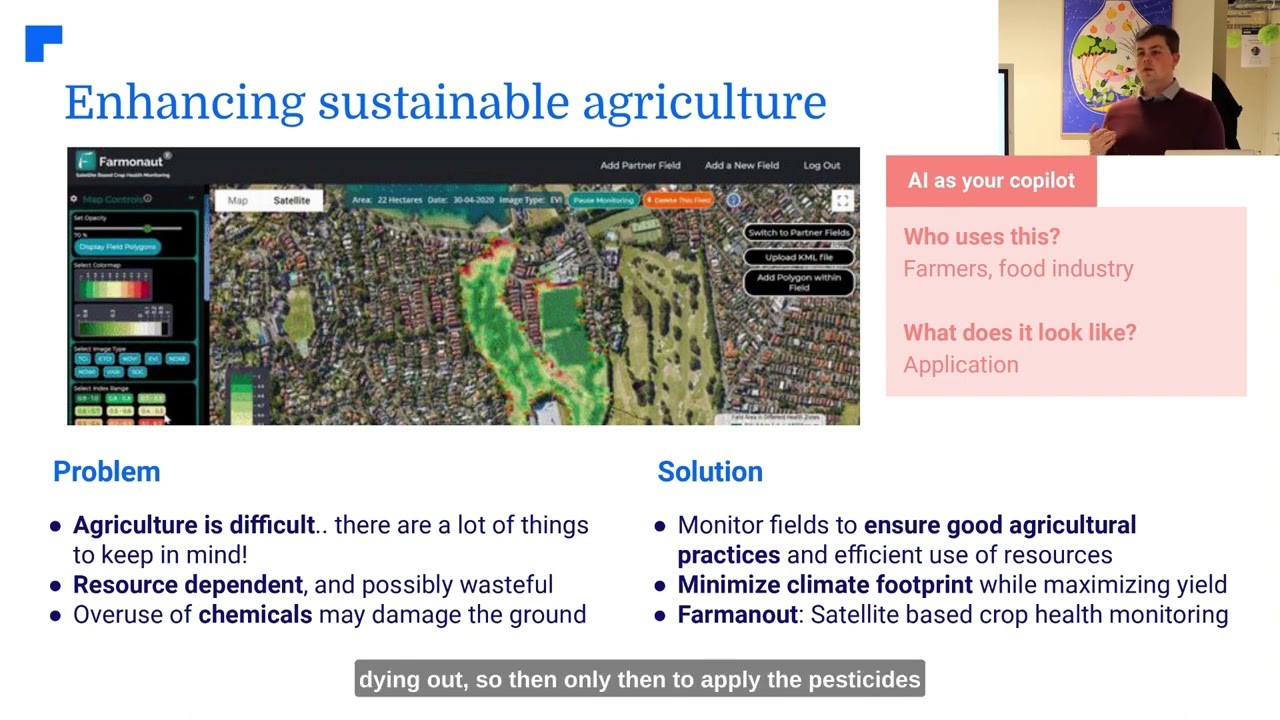
Satellite-based vegetation index monitoring — NDVI and related indices — flags canopy stress before it’s visible from the ground, letting growers scout suspect blocks first instead of walking every row. Platforms like Farmonaut pair this with soil moisture data so irrigation and fertilizer timing (relevant given the fertilizer price ranges above) can be adjusted per block rather than across the whole grove. Growers also use Farmonaut Carbon Footprinting to track the environmental footprint of input changes over time.
-
Biological Psyllid Control
Because the psyllid is the sole vector for HLB, suppressing it directly slows new infections. Parasitoid wasp releases and biopesticide programs are increasingly used alongside — not instead of — conventional insecticide rotations, reducing chemical load while keeping psyllid populations below outbreak thresholds.
-
Protective Covers for Young Trees
Individual mesh or plastic sleeves over newly planted resets physically block psyllid feeding during the tree’s first one to two years, the window when a new infection does the most long-term damage to eventual yield. This is now routine on new plantings across the affected counties.
-
Precision Irrigation and Nutrient Management
Because greening-damaged root systems absorb water and nutrients less efficiently, matching irrigation and fertilizer timing to actual tree demand — rather than a fixed calendar — reduces both waste and stress. This is where the DAP, urea, and MOP price ranges cited above matter most directly: variable-rate application driven by soil moisture and canopy data avoids paying full commodity price for fertilizer a stressed tree cannot use. Farmonaut Fleet Management is used by some operations to coordinate the equipment and routing behind these input schedules.
-
Mapped Tree Removal and Resetting
Dead and dying trees are marked, removed, and tracked to stop them from serving as an infection reservoir for neighboring healthy trees. Growers increasingly use geospatial mapping tools, including Farmonaut Large Scale Farm Management, to log removal locations and schedule resets efficiently across large acreage rather than tracking it on paper.
-
Storm and Freeze Response Planning
Hurricane and freeze events compound greening stress on an already weakened tree. Rapid post-storm field assessment, emergency nutrient applications, and weather-data-driven scheduling of critical grove operations around forecast threats reduce the combined damage from disease plus weather.
Comparison: Grower Tactics vs. Estimated Greening Reduction
The figures below are grower-reported estimates rather than a single controlled study, gathered from practices observed across affected Florida counties. Treat them as directional, not as a substitute for a block-by-block yield audit on your own grove.
| Practice | Estimated Adoption | Estimated Reduction in Greening Impact | Primary Cost Driver |
|---|---|---|---|
| Disease-tolerant rootstocks/resets | 60% | 35-45% | Nursery stock + multi-year establishment |
| Biological psyllid control | 35% | 20-30% | Beneficial insect releases, reduced spray program |
| Precision irrigation & nutrition | 70% | 15-20% | Fertilizer commodity price (see DAP/urea/MOP above) |
| Protective covers on resets | 55% | 25-35% | Sleeve/mesh materials per tree |
| Mapped tree removal/resetting | 85% | 50%+ | Labor (H-2A AEWR $16.23/hr, 2025) + replanting |
| Weather-adaptive storm response | 45% | 10-15% | Monitoring tools + emergency labor |
| Satellite crop health monitoring | 40% | 15-20% | Platform subscription |
Fertilizer Cost Calculator for Citrus Acreage
Use the Q2 2026 farmdoc daily commodity price ranges above to estimate a season’s DAP, urea, and MOP spend for your own acreage — adjust the per-acre application rates to match your grove’s actual program.
Run your own numbers
Assumptions: prices are FOB NOLA barge commodity prices for Q2 2026 (farmdoc daily, University of Illinois) — not delivered-to-grove retail, which typically adds freight and dealer margin. Excludes micronutrients, foliar sprays, application labor, and any greening-specific nutrition program. Application rates are placeholders you should replace with your own agronomic recommendation.
Where Florida Citrus Farming Goes From Here
The industry’s trajectory since HLB arrived is visible in the acreage numbers: 387,100 total bearing acres in 2023-24 against 143,650 orange acres alone forecast for 2025-26 — different measures (all citrus vs. oranges only) but both pointing at a smaller footprint than the pre-greening era. USDA NASS’s next Florida Citrus Forecast, due September 2026, will be the first read on whether the 2026-27 season holds acreage steady or continues the contraction.
- Continued rootstock research through university and USDA breeding programs remains the closest thing to a long-term structural fix, since no chemical or biological control eliminates HLB once a tree is infected.
- Wider access to monitoring tools — satellite imagery and mobile-accessible grove data through platforms like the Farmonaut platform — lowers the cost of the precision practices in the comparison table above for smaller family groves, not just large operations.
- Land-use stewardship stays a parallel fight: every acre converted to development after a grower gives up on a greening-damaged block is an acre the industry doesn’t get back.

How Farmonaut Supports Citrus Grove Management
Farmonaut provides satellite-based tools built for the precision practices described above, usable by individual growers and larger agribusinesses managing multiple grove blocks.
What the platform covers:
-
Satellite-Based Crop Health Monitoring:
Real-time NDVI, soil moisture, and stress indicators help flag greening-suspect blocks early, without hardware installation. Accessible via Android, iOS, and browser. -
AI-Driven Advisory:
Farmonaut’s Jeevn AI system delivers condition-specific guidance on irrigation and pest timing. Large Scale Farm Management tools handle multi-field and multi-vehicle logistics for larger operations. -
Blockchain Traceability:
Blockchain-enabled traceability supports food-safety documentation for buyers sourcing Florida citrus fruit or juice. -
Carbon Footprinting:
Farmonaut’s Carbon Footprinting Module tracks input-related emissions over time for compliance and buyer reporting. -
API Access:
Developers and agri-tech businesses can integrate the Farmonaut Satellite & Weather API, with full documentation at the developer docs site. -
Insurance and Loan Verification:
Lenders can verify crop health and field area using Farmonaut Crop Loan and Insurance Verification.
FAQ: Citrus Greening & Florida Citrus Farming
1. What is citrus greening?
Citrus greening (huanglongbing, or HLB) is a bacterial disease spread by the Asian citrus psyllid. It blocks nutrient flow in the tree, causing yellow blotchy leaves, bitter misshapen fruit, premature fruit drop, and eventually tree death. There is no cure for an infected tree.
2. How widespread is citrus greening in Florida?
A University of Florida IFAS grower survey (Publication FE983) found the disease affects an average of 90% of citrus acres and 80% of trees statewide, with an average 41% yield loss — 45% in Central Florida specifically.
3. What has citrus greening cost the Florida citrus industry?
A University of Florida study found $3.63 billion in cumulative lost revenue and 6,611 jobs lost between the 2006-07 and 2010-11 seasons alone. Florida’s citrus bearing acreage has continued to contract since — 387,100 acres in 2023-24 versus 143,650 orange acres forecast for 2025-26, per USDA NASS.
4. What are fertilizer alternatives for citrus farmers facing high input costs?
Q2 2026 barge prices for DAP, urea, and MOP ranged $345-660 per ton depending on the nutrient, per farmdoc daily. Rather than a cheaper substitute product, the documented approach among Florida growers is precision variable-rate application guided by soil moisture and satellite vegetation data, which targets the fertilizer a stressed tree can actually use instead of applying a flat rate across a block.
5. What H-2A solutions apply to citrus grove management?
Florida’s H-2A Adverse Effect Wage Rate was $16.23/hour for 2025. The rate updates roughly twice yearly under federal rule; check Citrus Industry Magazine or the U.S. Department of Labor for the current figure. Grove-side, H-2A crews are typically paired with mapped removal/reset schedules and monitoring data to make each labor hour more productive on smaller, greening-thinned canopies.
6. How does precision agriculture help fight citrus greening?
Satellite monitoring flags stressed blocks before visual symptoms are obvious, letting growers prioritize scouting and target irrigation/fertilizer to blocks that will actually use it — relevant given current fertilizer commodity prices. It doesn’t cure HLB, but it reduces waste and helps catch new infections earlier.
7. How can I access Farmonaut’s platform for my orange grove?
Sign up using Farmonaut’s Web App, or download the Android App or iOS App.
Florida’s citrus growers are managing an incurable disease with a documented 41-45% yield-loss average, contracting acreage, and rising input costs — but the acreage and forecast data USDA NASS publishes quarterly, and the price data farmdoc daily publishes each quarter, mean this is a situation you can track precisely rather than estimate. Check the sources cited above directly for the current season’s numbers before making a grove-level decision.

 Kubota
 Grow Indigo
 FFBS
FFBS Jontra
 Kalustyan
 Tucor
Tucor Geno
Geno Hayleys Agriculture
 Linx Agritech
 Adinet
 Save Your Soils
 Grandstream Algérie
 XOS Realty
 Geospatial Lab Africa
 Agro La Gándara
 HIPSAC
 ZOL Zimbabwe
 Juligerm
