

Farmonaut technologies
Satellite solutions for agriculture and mining
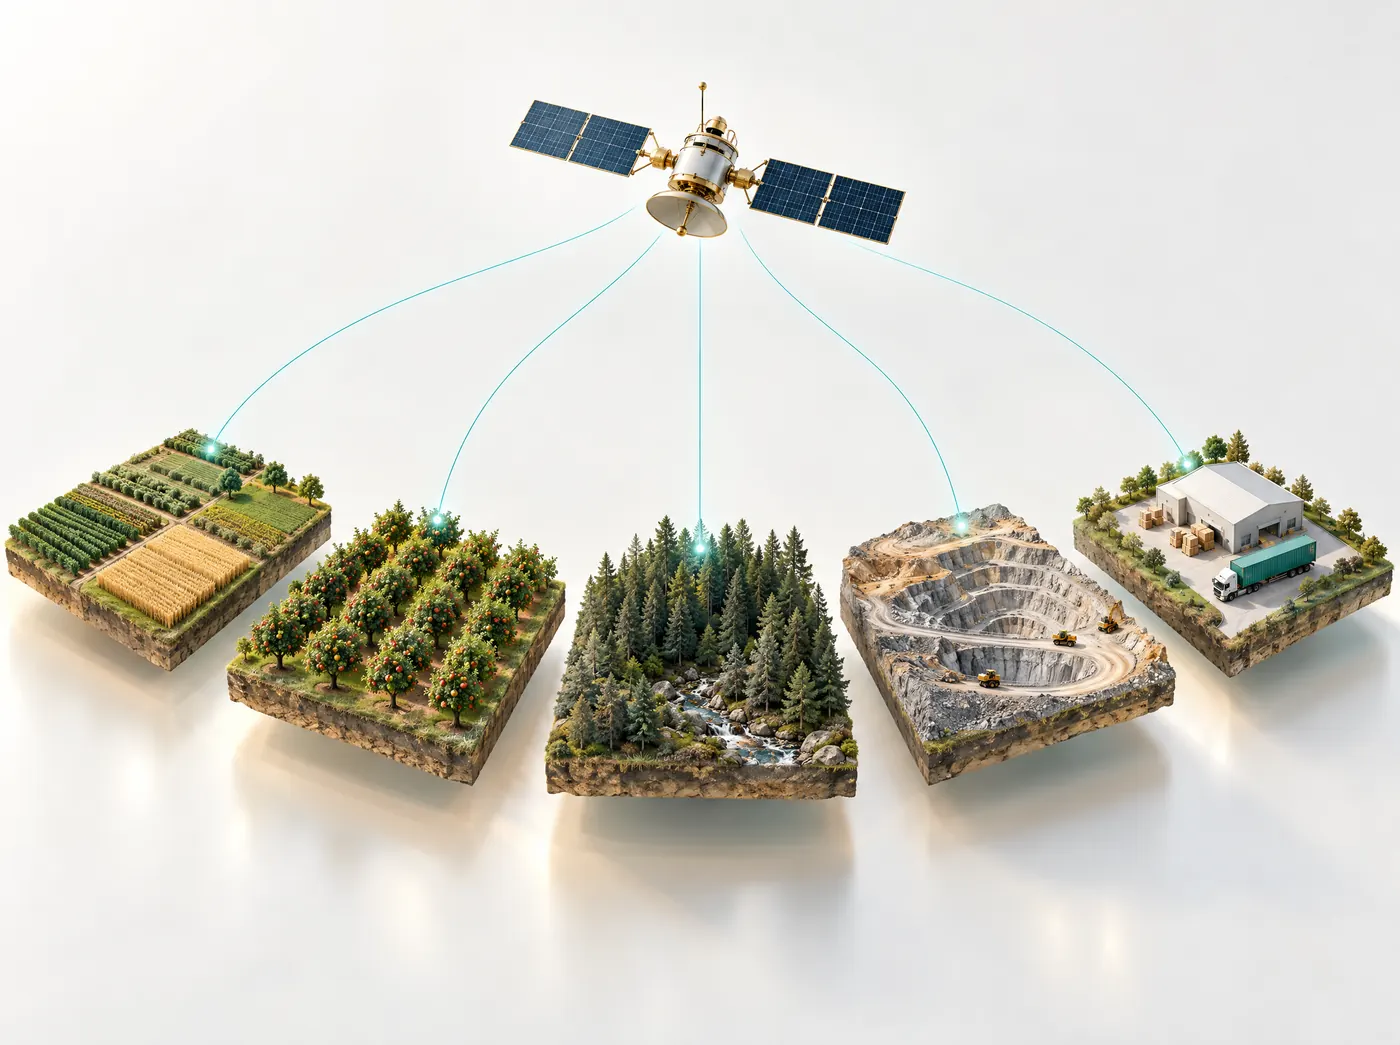
At Farmonaut we build satellite solutions for agriculture and mining on the same base: optical, radar and thermal satellite data, scored by our AI models. Farms get advice on water, fertilizer and pests for each field they map, and exploration teams get a ranked list of mineral targets across a license.
Farming and mining businesses on the platform
- John Deere
- SRK Consulting
- Kubota
- Riverside Resources
- BayWa
- NTS Group
- Elders
- Critica Metals
- CGIAR
- Tintina Mining Group
- Hayleys Agriculture
- Dalgety Minerals
- Sun Palm Australia
- Mine4Africa
For farms, plantations and agribusiness
Nine agriculture satellite services
These agritech solutions all work from the same field record, so a field you map once is available in each of them. Most people start with satellite crop monitoring and add the others later, if and when they need them.
Satellite crop monitoring
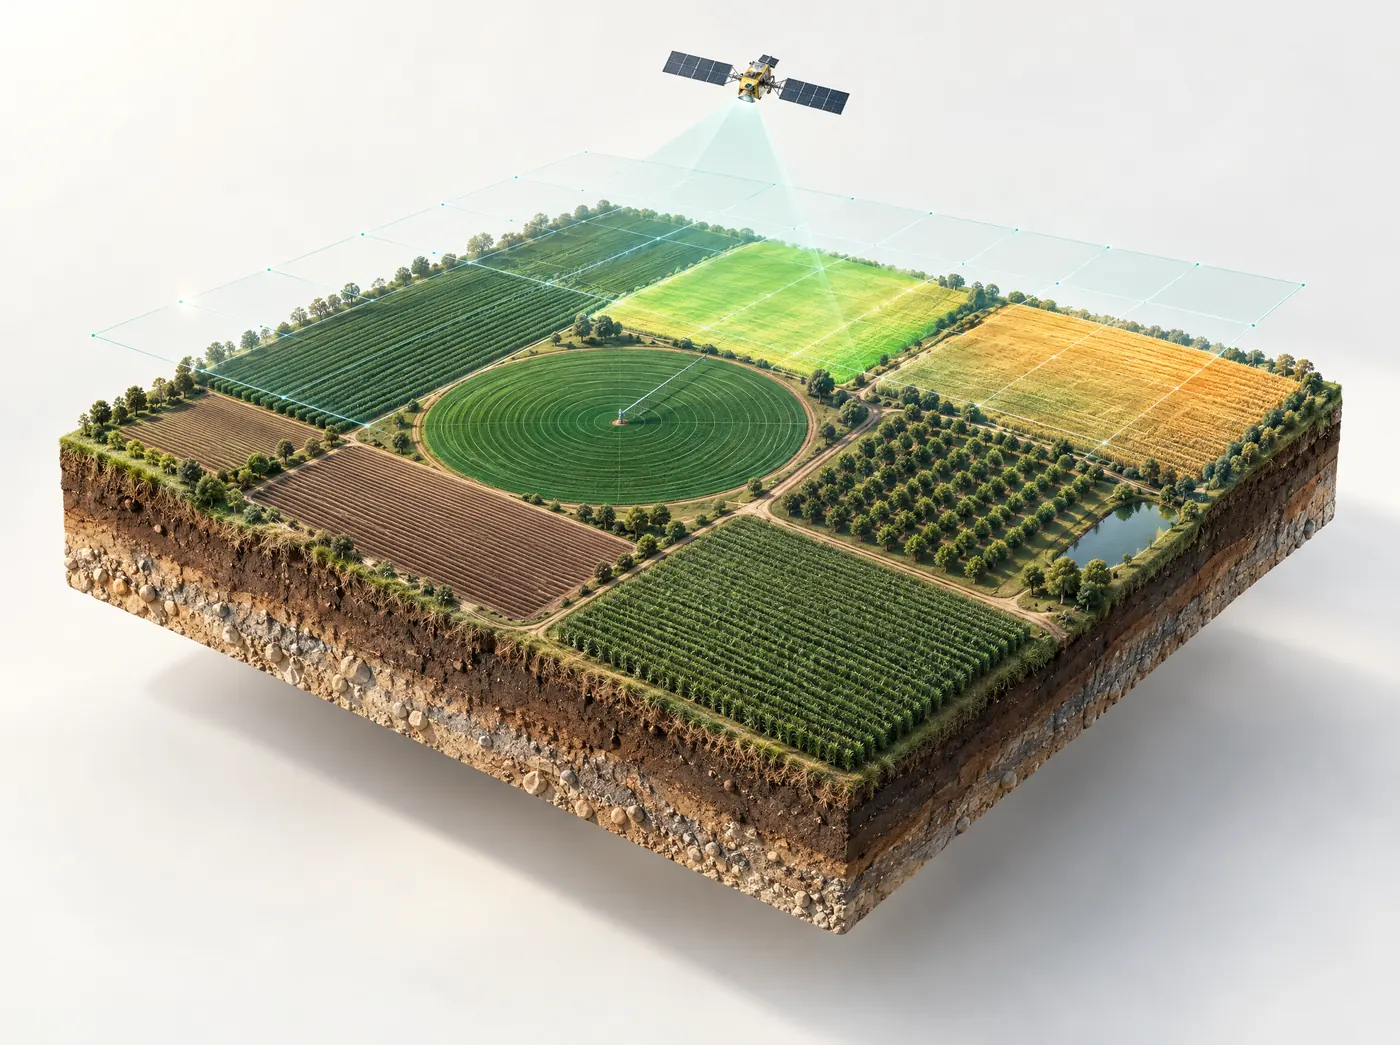
A field report on crop health, water need and pest risk each time a satellite passes over, which is every few days. It covers row crops, orchards and plantations, including 116,000+ acres of oil palm.
Explore crop monitoring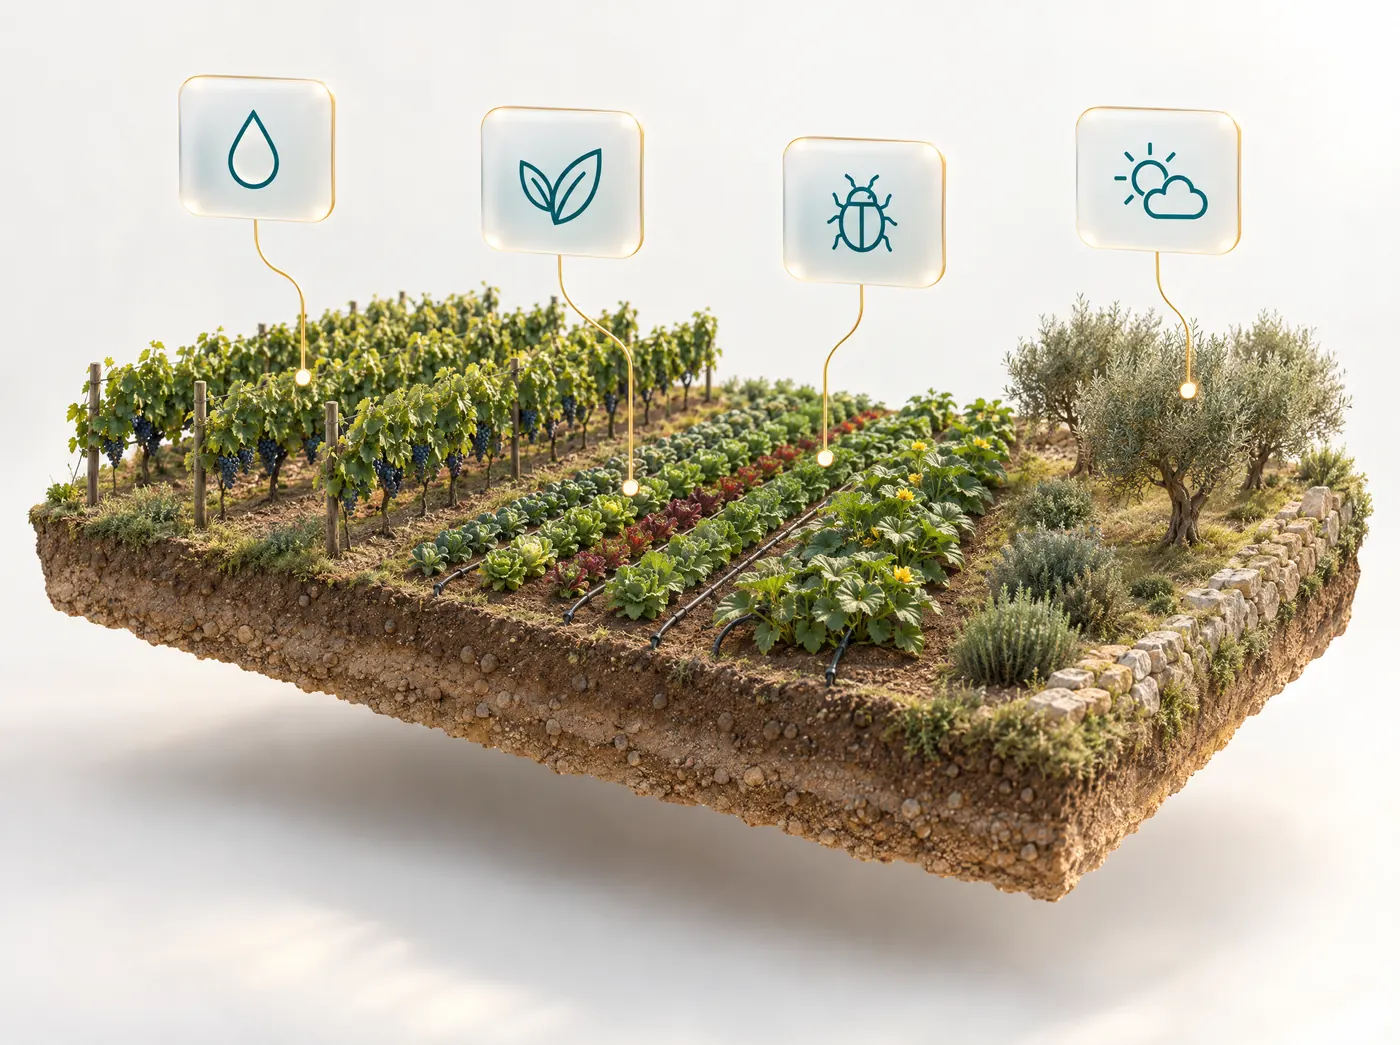
AI farm advisory
After each satellite pass, JEEVN AI works out how many millimeters of water and how many kilograms of fertilizer a field needs. Pest alerts come with an organic and a chemical option.
Explore AI farm advisory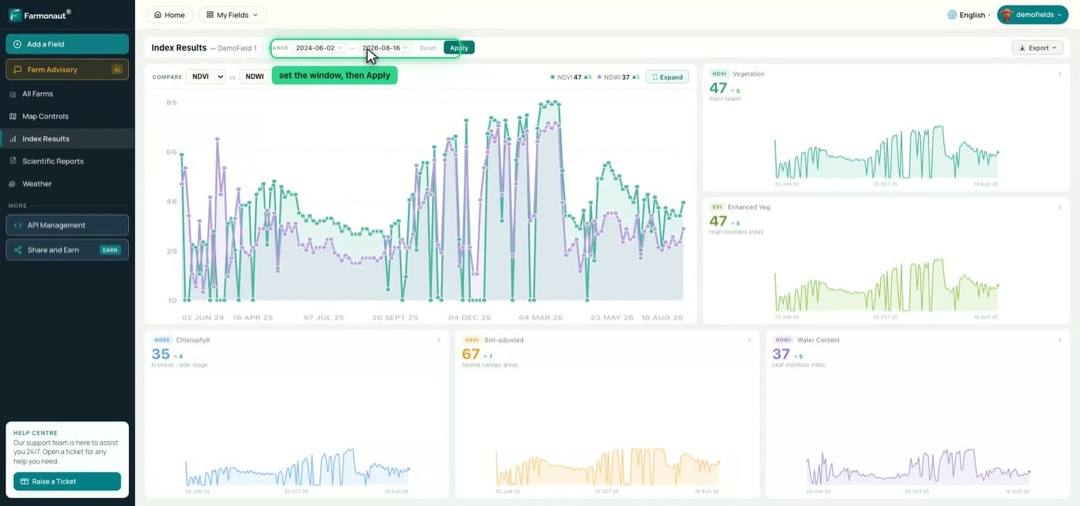
Agriculture data API
Returns all 16 satellite views, the values behind them and the field report as JSON. Developers use it to show Farmonaut readings in their own app, or to resell them under their own brand.
Read the API docs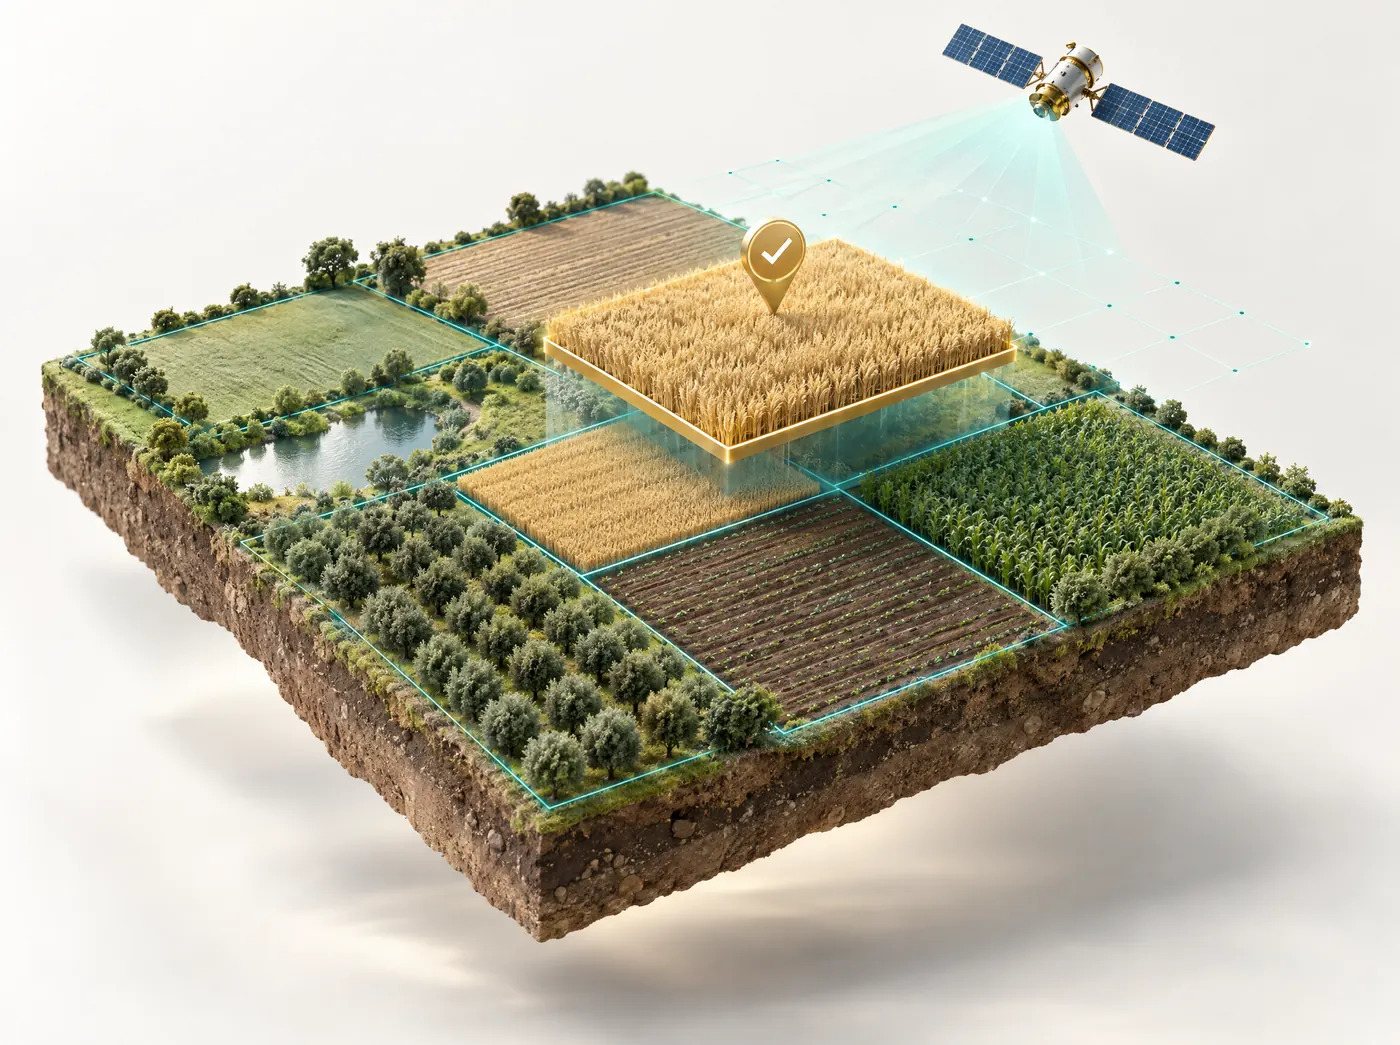
Crop loan & insurance
For lenders and insurers: yield prediction, a risk profile for each farm, and checks on land and claim data before a loan goes out or a claim is paid.
Explore crop loan & insurance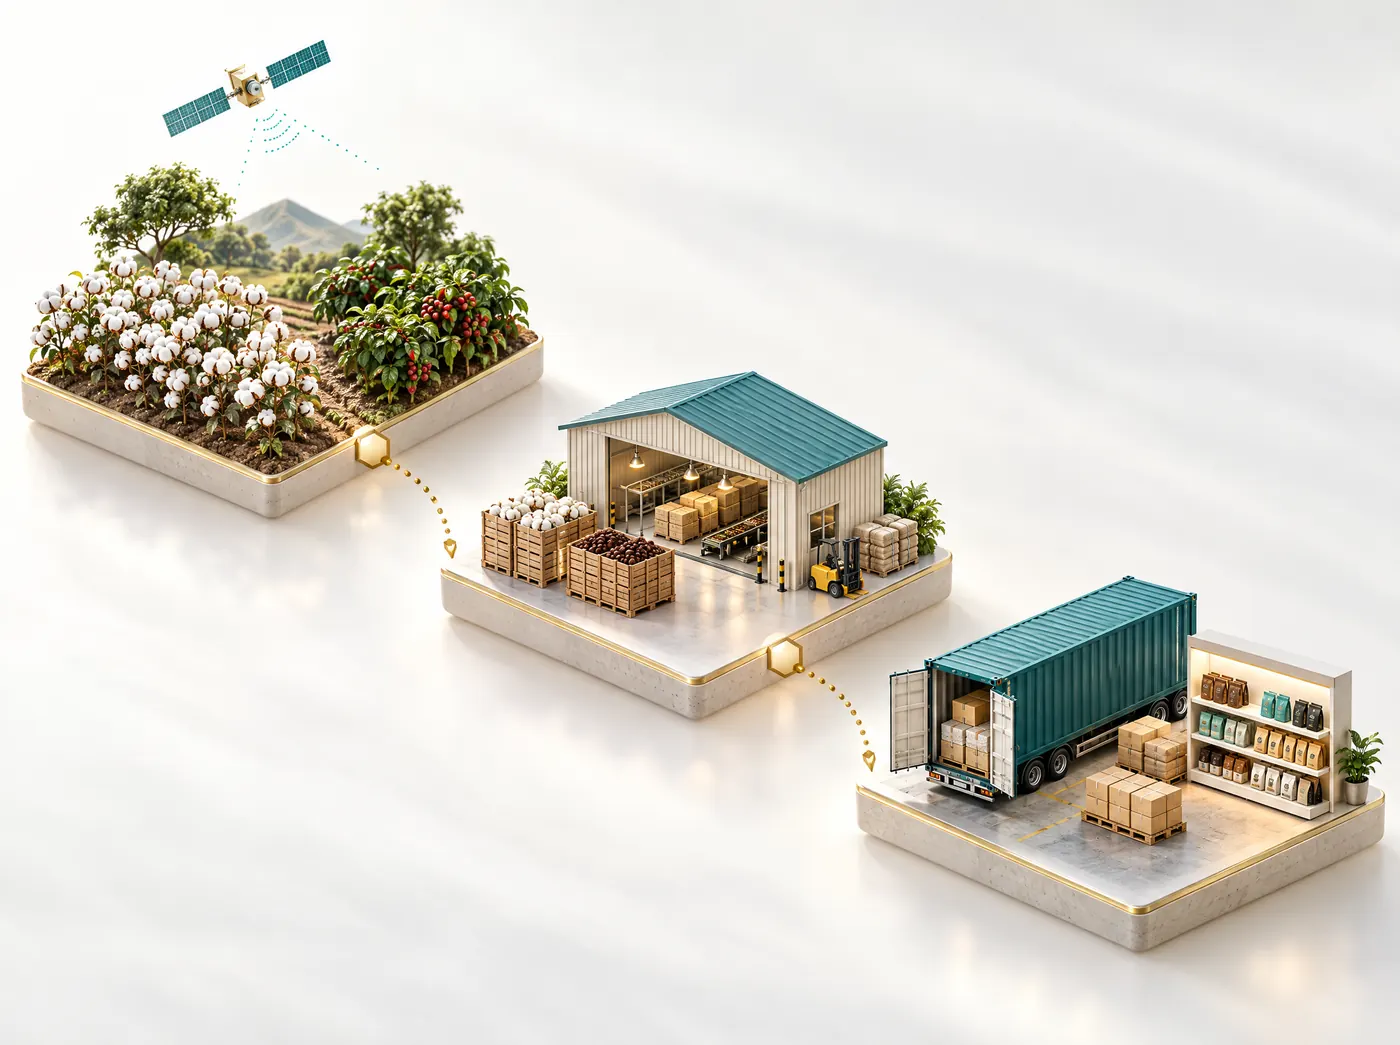
Product traceability
Links each product to the farm it came from using QR codes, RFID tags and a Hyperledger Fabric ledger. It also produces compliance reports for EUDR and for organic buyers.
Explore traceability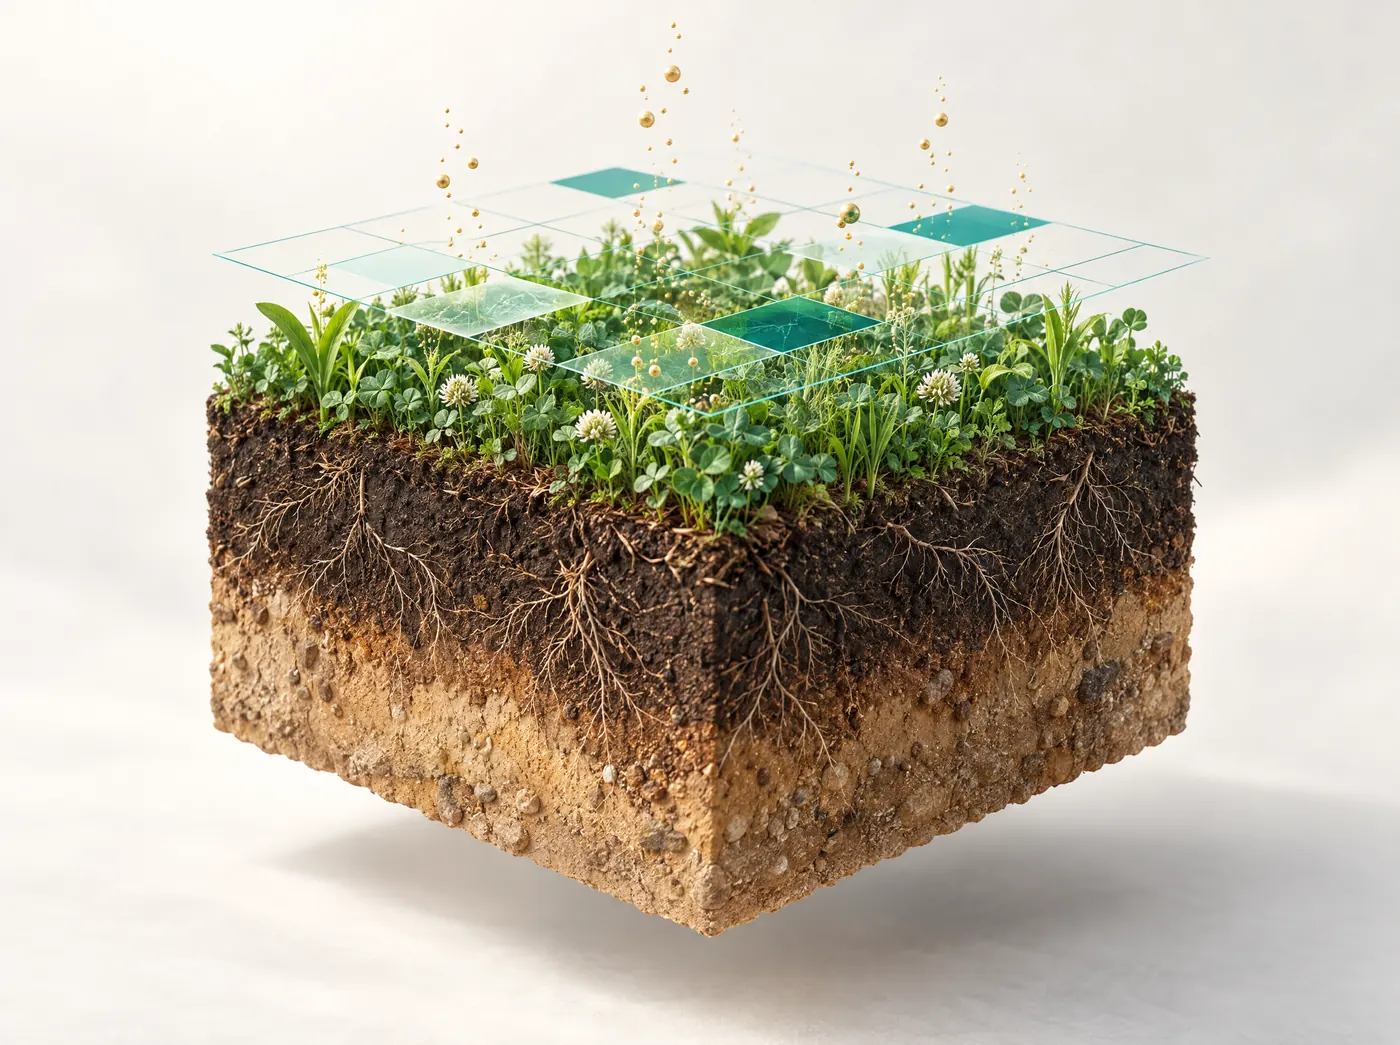
Carbon footprinting
Maps soil organic carbon by zone from satellite data and tracks how it changes over time. You also get baseline emissions and records you can use to support a carbon credit project.
Explore carbon footprinting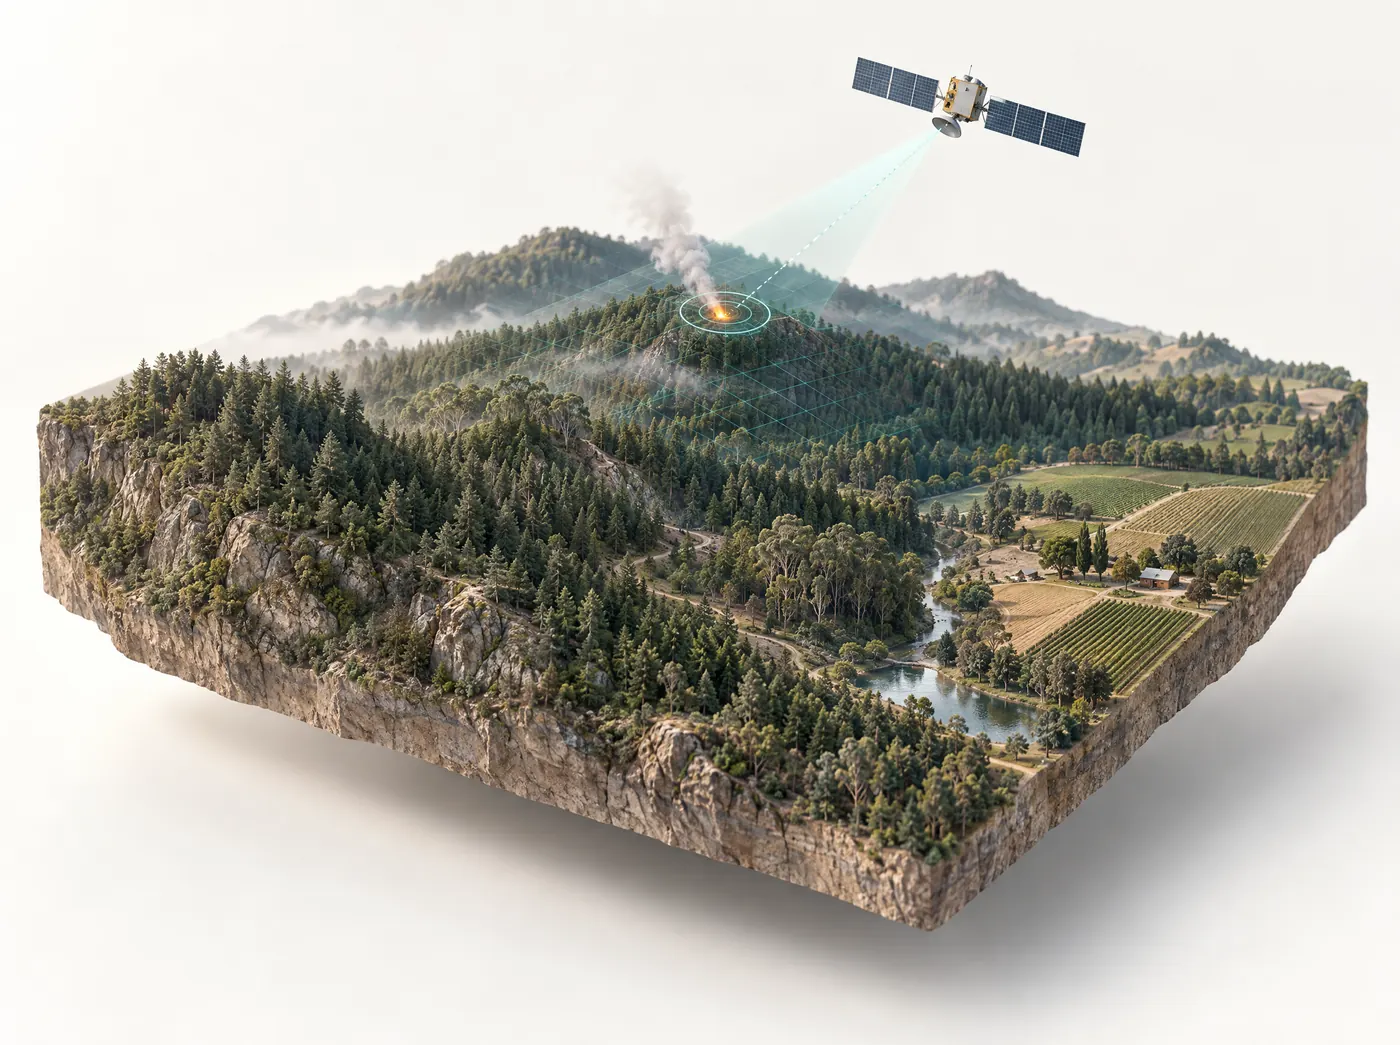
Wildfire monitoring
Checks the areas you choose every 2.5 minutes and can pick up fires as small as 1 hectare. Alerts go out by SMS, email and in the app, with a forecast of the spread 1, 3 and 6 hours ahead.
Explore wildfire monitoring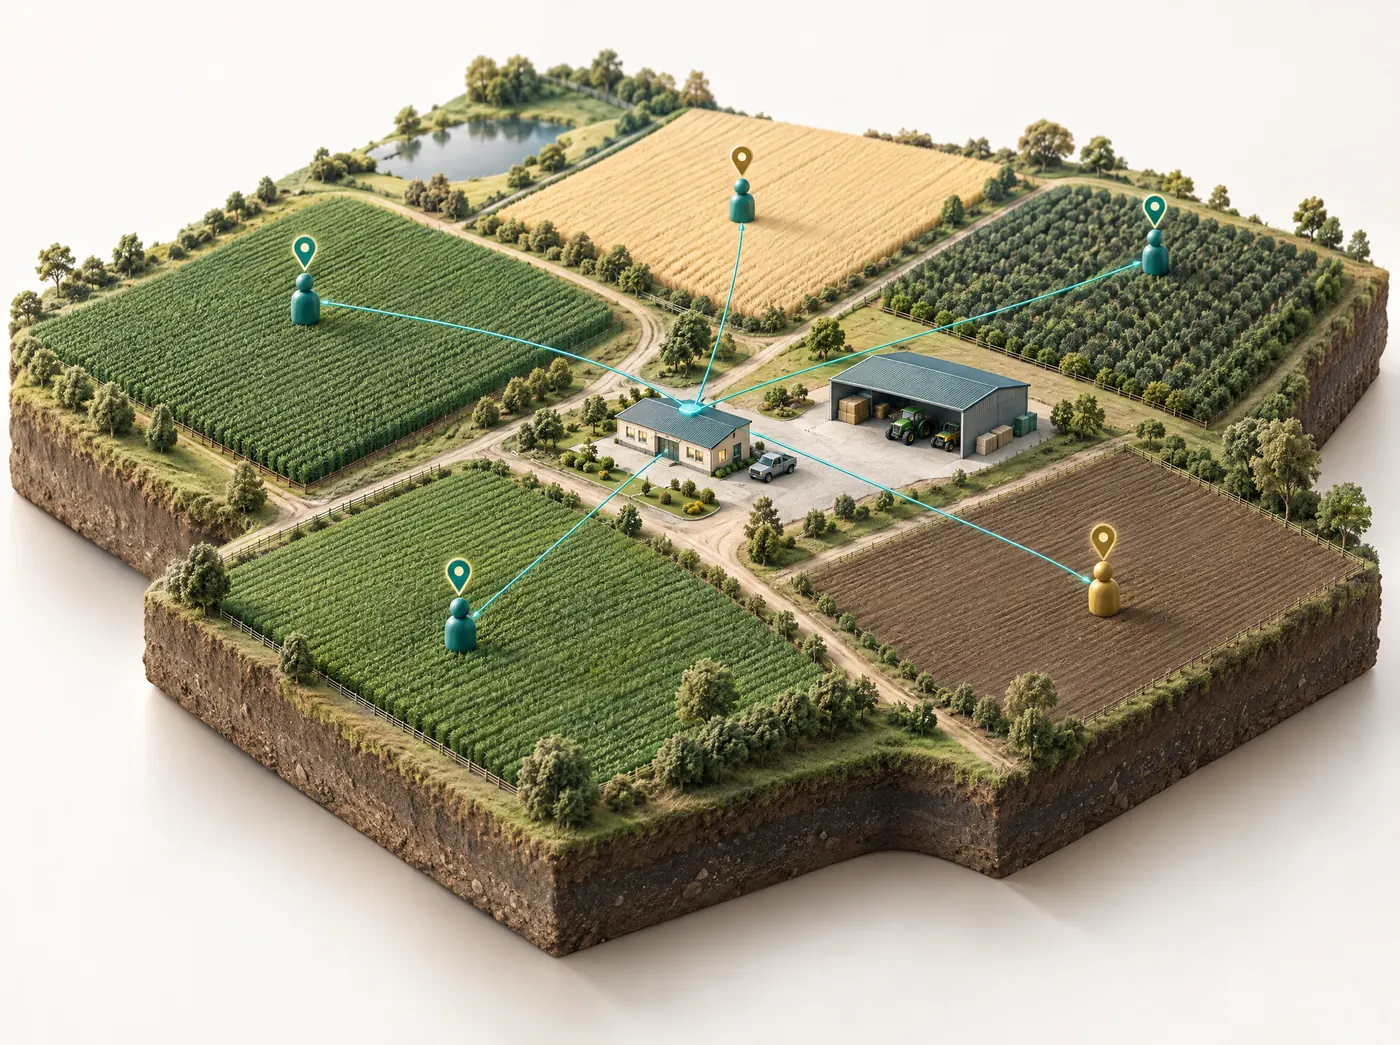
Agro Admin app
Give field staff tasks with instructions and deadlines, then check on one dashboard which jobs are done, still pending or running late.
Explore Agro Admin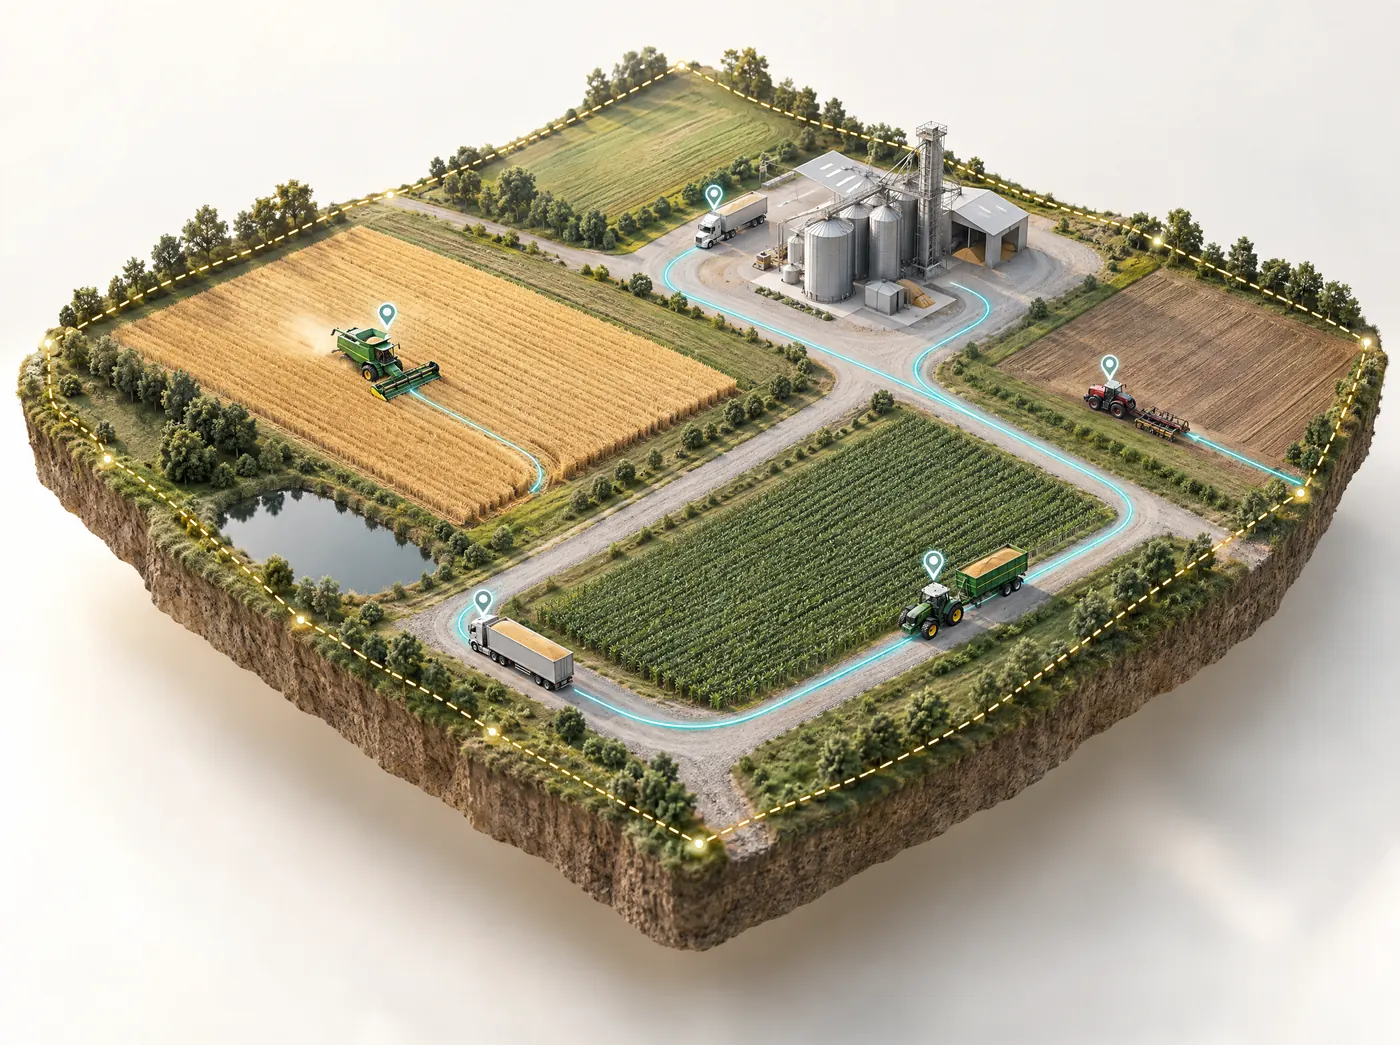
Fleet management
Real-time GPS tracking for tractors and trucks, with route planning, geofence alerts and maintenance reminders. It's linked to your crop data, so machine work can be scheduled around the crop calendar.
Explore fleet managementFor license holders and geologists
Satellite tools for mineral exploration
On the mining side we rank Exploration Targets across a license so you know where to sample and drill first. The ranking comes ahead of a JORC or NI 43-101 resource estimate, not as a replacement for one.

Satellite mineral detection
You send us the license boundary and the minerals you're after. In under 5 days we send back ranked targets with the location, depth and estimated quantity of each zone, worked out from eight sensor families. Clients have paid us to look for 23 minerals so far, including gold, copper, lithium and uranium.
Explore mineral detection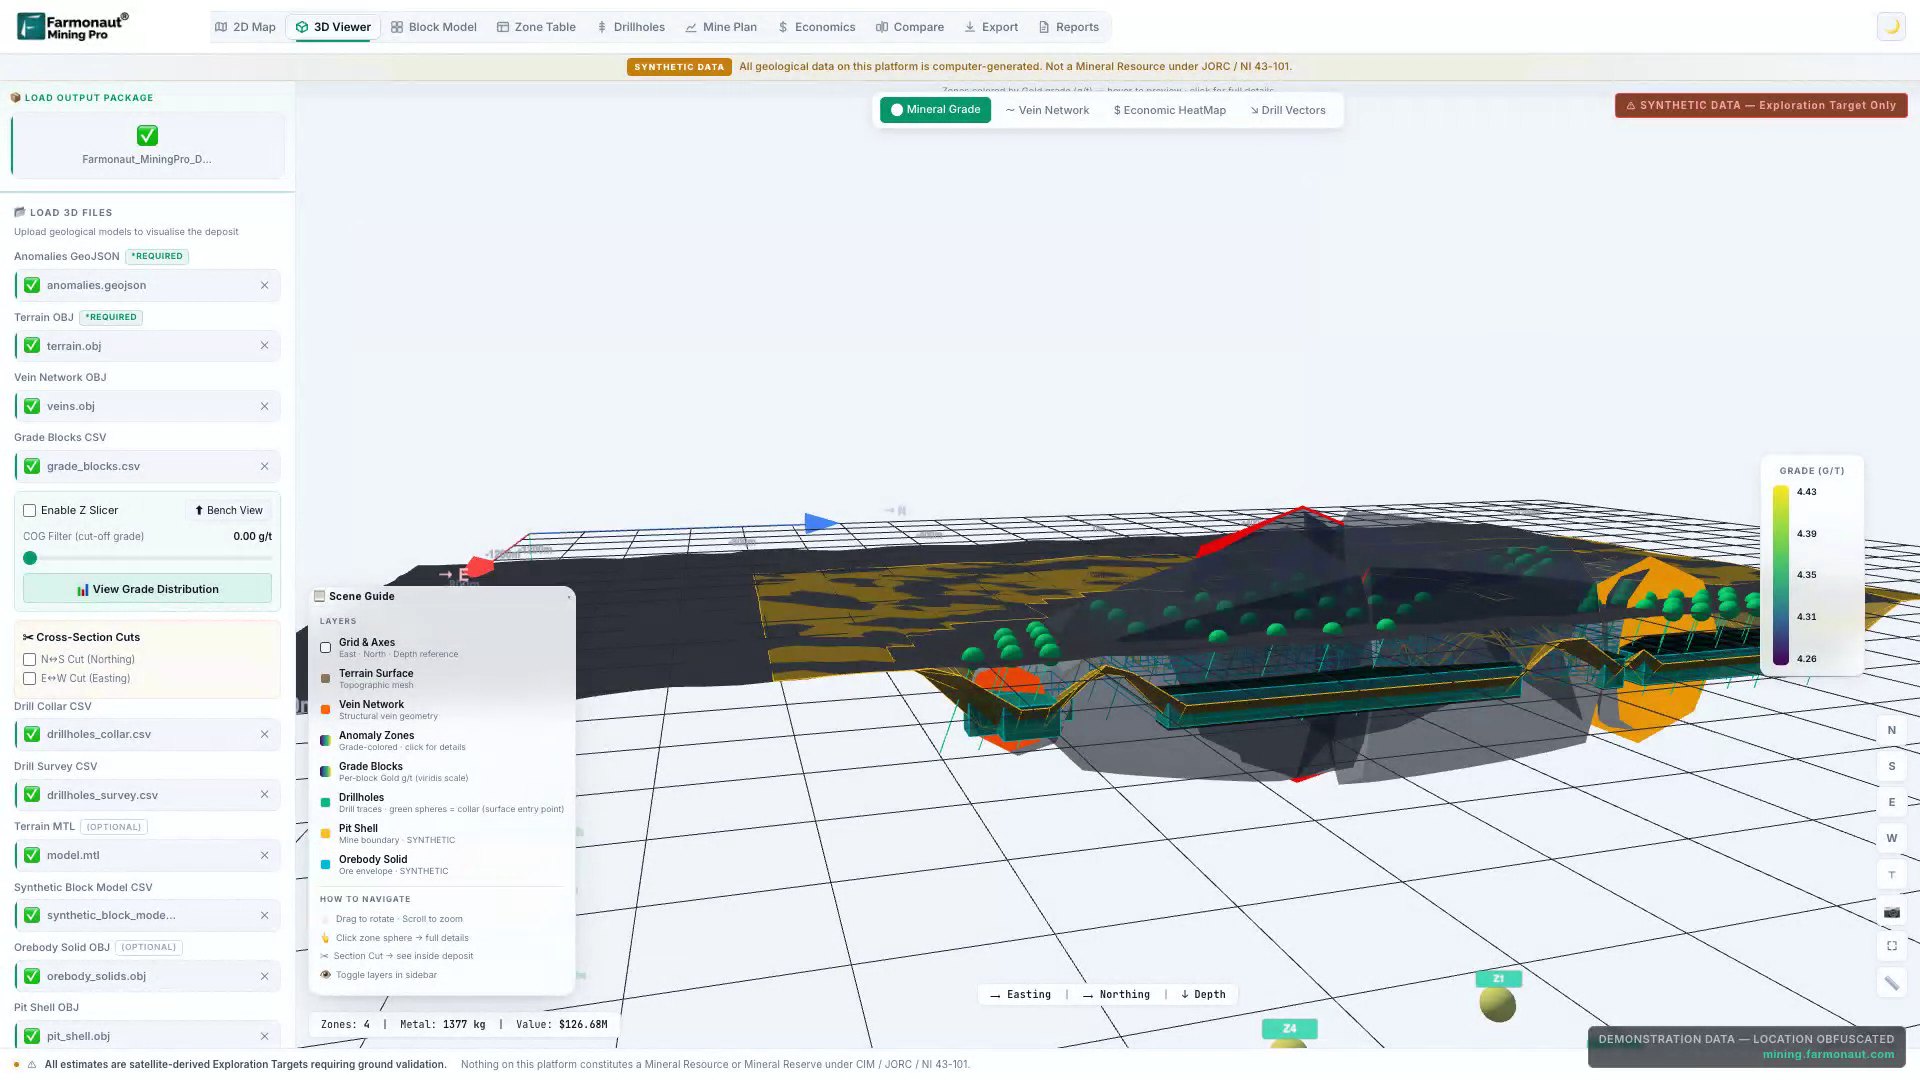
Farmonaut Mining Pro
Mineral exploration software that runs in the browser. Its nine tools go from a 2D map and 3D viewer through block models, mine plans and economics, and you can export the results to Leapfrog, Vulcan, Surpac and Datamine.
Explore Mining ProUnder the hood
What our satellite solutions for agriculture and mining have in common
Farmonaut technologies on both sides rest on one physical fact: a stressed crop and an altered rock each reflect light differently from what surrounds them, and satellites can measure that difference. Our models pick it up in satellite images and cross-check it against other data before a field or a zone gets a score.
| Layer | In agriculture | In mining |
|---|---|---|
| Optical satellites | Near-infrared shows crop stress before leaves change color | Visible and SWIR bands map alteration minerals and iron oxides |
| Radar | Keeps the field record going through cloud, smoke and haze | Maps the faults and lineaments that control where ore travels |
| Thermal, terrain, water | Evapotranspiration, slope and soil moisture shape the irrigation plan | Heat anomalies, elevation, magnetics and drainage are used to screen each target |
| AI scoring | Combines readings with weather, soil history and crop stage | A zone ranks high only when independent evidence agrees |
| What you get | Water in millimeters, fertilizer in kilograms, pest risk as a probability | Ranked Exploration Targets with location, depth and estimated quantity |
| Delivery | Web app, Android and iOS apps, PDF in 248 languages, API | PDF report, KML, GeoTIFF and GeoJSON, Mining Pro in the browser |
Neither side needs equipment on the ground. To get started, we only need the boundary of your field or your license.
Fields in 135 countries and licenses in 33
Agriculture
Mining
Which solution to start with
I grow crops
Start with satellite crop monitoring and the AI farm advisory. Drawing your field boundary on the map takes about a minute.
Satellite crop monitoringI run an agribusiness
You can monitor thousands of plots together. Agro Admin is for running field teams, and traceability shows your buyers which farm a product came from.
Agro Admin appI lend to or insure farmers
Before you approve a loan or pay a claim, check the field's crop, its yield outlook and its claim history.
Crop loan & insuranceI build software
Send a field boundary to the agriculture data API and you get every satellite view and the field report back as JSON.
Agriculture data APII hold an exploration license
Tell us which minerals you're after along with the boundary, and you'll have ranked targets before you've paid for a field crew.
Satellite mineral detectionI'm a geologist or consultant
Mining Pro lets you model targets in 3D and plan drillholes in the browser, then export the results to the mining software you already use.
Farmonaut Mining ProHow the satellite and AI stack works
Every one of our satellite solutions for agriculture and mining runs the same sequence. You give us a boundary. We pull the satellite archive for it, add each new image as satellites pass over, turn the raw bands into indices and layers, and run models that turn those layers into something you can act on. What changes from product to product is which satellites matter, which layers we compute and what question the model answers.
On a farm, we read every 10 meters of the field from optical and radar satellites. Radar keeps the record going when cloud, smoke or haze block the optical view. The images become 16 views of the field, including NDVI, NDRE, evapotranspiration, radar soil moisture and soil organic carbon, and our models combine them with weather and crop stage to give six answers: crop health, water need in mm per day for the next seven days, soil condition, a yield estimate with harvest date, pest and disease risk, and a fertilizer dose for five nutrients.
On a mining license, we combine eight sensor families, from optical and SWIR imagery to radar, thermal, terrain, magnetics, hydrology and land cover, and add hyperspectral data when a mineral needs narrow bands. A zone ranks high only when independent evidence agrees. The result is a ranked set of Exploration Targets with the location, depth and estimated quantity of each zone, to be used ahead of a JORC or NI 43-101 resource estimate.
Which agriculture solution fits your problem
Start from the decision you need to make. That points to the right one of our agritech solutions faster than reading the product list.
Growers and farm managers
If the question is which part of which field needs attention, start with satellite crop monitoring. If you want amounts, such as millimeters of water and kilograms of fertilizer per field, add the JEEVN AI farm advisory. Farms that run their own tractors and trucks can link them to the same crop data with fleet management.
Agribusinesses and plantations
Companies with many plots and field staff usually pair monitoring with the Agro Admin app, which assigns tasks and shows what's done, pending or late. Estates in fire country add wildfire monitoring for alerts inside their boundary.
Lenders and insurers
Crop loan and insurance tools give yield predictions, farm-level risk profiles built from crop history, weather and field condition, and checks on land and claim data, for use before a loan goes out or a claim is paid.
Food brands, traders and exporters
Product traceability maps source plots, checks them for deforestation against the EUDR cutoff and links each lot to its plots on a blockchain ledger. Teams reporting on sustainability can add carbon footprinting for soil organic carbon maps and baseline emissions.
Developers and agtech companies
The agriculture data API takes a field boundary and returns all 16 views, their values and the field report as JSON. Seven partners already run Farmonaut under their own brand.
Which mining solution fits your problem
License holders and exploration companies
Satellite mineral detection is a report on your license. You send the boundary and target minerals, and we deliver ranked targets in under 5 days. The Premium tier covers ranked targets, a prospectivity heatmap, structural and lithological mapping, confidence tiers and indicative economics. Premium+ adds drilling angles and depths, a 3D subsurface model, an economic block model, a conceptual pit shell and P10/P50/P90 estimates. Clients report saving USD 25,000 to 100,000 and up to 6 months per license.
Geologists and consultants
Farmonaut Mining Pro is browser-based exploration software with nine tools, from a 2D map to block models, mine plans and economics, with exports to Leapfrog, Vulcan, Surpac and Datamine. More than 100 mining businesses in 25+ countries use it.
Investors
If you're weighing a stake in a license, a report on that ground gives you an independent view of where the strongest targets are, with confidence tiers and indicative economics. It's an early screen ahead of a JORC or NI 43-101 resource estimate and a site visit, and doesn't replace either. Our mining case studies show what past reports looked like.
How the solutions combine
Agricultural solutions share one field record, so a plot mapped for one product is ready in the others. Some combinations that work well:
| Situation | Combination | What it adds |
|---|---|---|
| Brand sourcing cocoa or coffee from smallholders | Traceability, crop monitoring and advisory | Plots mapped for the EUDR also get field advice, which gives farmers a reason to share their data |
| Plantation company | Crop monitoring, Agro Admin, fleet and wildfire | A flagged block becomes a task for a field team and a job for a machine, and fires near the estate raise an alert |
| Lender or insurer | Crop loan and insurance with crop monitoring | Risk at approval, crop condition through the season and claim checks at the end |
| Sustainability program | Carbon footprinting and traceability | Soil carbon trends and lot origin from the same plots |
| Exploration company | Mineral detection and Mining Pro | Targets from the report explored in 3D, modeled and exported to your mining software |
Data and delivery formats
For farm products, you add a field by searching an address, drawing it, or uploading a KML, KMZ or shapefile. Results come through the web app, the Android and iOS apps, PDF reports in 248 languages, a share link that opens without a login, and JSON through the API. Wildfire alerts go out by SMS, email, app and API. Traceability adds compliance reports and QR pages, which brands can run under their own name.
For mining, we need the license boundary and the minerals you're after. Reports come as PDF with KML, GeoTIFF and GeoJSON layers, and the results open in Mining Pro. Premium+ adds files for Leapfrog, Vulcan, Surpac and Datamine, and add-ons cover white-label, translation, GIS and CSV delivery, Surpac STR/DTM and DXF/DWG.
None of this needs equipment in the field. A boundary is the only thing we need to start, whether it's a field, an estate or an exploration license.
Getting started
- If you farm, open the web app and add one field. The first report comes after the next satellite pass, and plans are priced by area on the pricing page.
- For agribusiness, lending, traceability, carbon or wildfire projects, talk to our team with your area, crops or commodities, and the decisions you need the data for.
- Developers can start with the API docs. Credits roll over when 2,470+ acres are kept under watch.
- For exploration, send your boundary and target minerals through the mining quote form. Projects are quoted by area, minerals and report tier, and multi-license portfolios are delivered in phases.
- Geologists who want to try the software first can watch the Mining Pro video course, 16 chapters and free to watch.
- Consultants and agronomists who'd rather refer clients can join the affiliate program.
Already a customer and something isn't working as expected? Open a ticket on our support page and include the field or license name, which lets us find it quickly.
What people ask before picking a solution
What satellite solutions for agriculture and mining does Farmonaut offer?
On the farming side there are nine: satellite crop monitoring, AI farm advisory, an agriculture data API, crop loan and insurance tools, product traceability, carbon footprinting, wildfire monitoring, the Agro Admin app and fleet management. For mining there are two: satellite mineral detection reports and the Farmonaut Mining Pro software.
Do the agriculture and mining products use the same technology?
Yes, at the core. Both use optical, radar, thermal and terrain satellite data, scored by AI models and checked against other evidence. What changes is what the models look for: crops, soil and water on a farm, and alteration minerals, rock structure and magnetics on a license.
Do I need drones, sensors or any hardware?
No. For the farm products you only need a field boundary. You can draw it on the map, find it by address, or upload a KML, KMZ or shapefile. For mineral detection we need the license boundary and the minerals you're targeting.
Where can I use Farmonaut?
Anywhere you have a field or a license, because satellite coverage is global. Farm customers have fields in 135 countries today. On the mining side, our exploration work in this and the last financial year spanned 33 countries, with Ghana, Tanzania, Senegal and Mauritania the busiest.
Does Farmonaut work for plantations and orchards?
Yes. Satellite crop monitoring handles plantations and orchards with the same field tools, and it's used on oil palm, apple and other estate crops. Oil palm alone accounts for 116,000+ acres across 35,300+ plots in 11 countries.
Is there a Farmonaut app?
Yes. Farm customers can use the web app or the Android and iOS apps, which show the same fields and reports. Mining Pro runs in the browser, so there's nothing to install for the mining side either.
Can I use more than one solution on the same fields?
Yes. The agriculture solutions work from the same field record, so a field you've mapped for crop monitoring can also be used for traceability, carbon footprinting, wildfire alerts or lending checks without mapping it again.
Does Farmonaut have an API for developers?
Yes. The agriculture data API takes a field boundary and returns all 16 satellite views, the values behind them and the field report as JSON. Wildfire events are also available through an API for control-room systems.
Can Farmonaut run under our own brand?
Yes. Seven partners already run Farmonaut under their own brand, traceability QR pages and dashboards can carry your logo, and white-label is an add-on for mining reports. Talk to our team about setup.
How reliable are Farmonaut's results?
On the farm side, customers have published their own results in our case studies, and independent research papers have named Farmonaut. On the mining side, 90% of ranked zones were confirmed by ground or drill evidence on engagements where clients tested them. Field checks still matter in both, and we encourage them.
Which solution should a food brand or exporter start with?
Usually product traceability, because it maps your source plots and links each lot to them, which is the base for EUDR support and for showing buyers where a product was grown. Many then add crop monitoring for the same plots.
How much do Farmonaut solutions cost?
Farm monitoring plans are priced by area, and you'll find them on the farm pricing page. Mineral detection is quoted per project, based on the area, the minerals and the report tier. For a quote, send your boundary through the mining quote form.
Next step
A field to map, or a license to screen?
If you farm, map a field in the web app and the first crop advice comes after the next satellite pass. For exploration, send us a license boundary and we'll deliver ranked mineral targets in under 5 days.
More from Farmonaut