Applications of Satellite Imagery Bands — Part 3: Near Infrared (B8), Water Vapor (B9), and Shortwave Infrared (B10, B11, B12)
With these series of articles, we wish to provide a comprehensive analysis of what, where and how the satellite imagery accessed through our system can be used. This is the third article of this series. You can read the first two articles on the links below:
B1, B2, B3, B4: https://farmonaut.com/applications-of-satellite-imagery-1/
B5, B6, B7, B8A: https://farmonaut.com/applications-of-satellite-imagery-2/
B8: Near Infrared
Near Infrared images can help us identify and monitor a plant’s health. At Farmonaut, we have developed our own Crop Health Monitoring system which processes Near Infrared Imagery in combination with several other spectral images to provide a health color-map of an agricultural land.
Though we cannot perceive it with our eyes, everything around us (including plants) reflect wavelengths of light in visible and non-visible spectrum. Taking into account how much amount of a certain wavelength is reflected, we can access the current status of plants.
Our system monitors how much sunlight is reflected by the plants. We know that, plants have chlorophyll which absorb sunlight for photosynthesis . If a plant is healthy, it will have large amount of chlorophyll on it’s leaves and will absorb good amount of sunlight and reflect quite less of it and vice-versa. We take into account this basic principle in identifying crop health status of an agricultural land.
Farmonaut provides satellite based crop health monitoring system, through which farmers can select their field and identify the regions of the field at which the crop growth is not normal. Upon identifying that region of their fields, they can simply pay a visit to that part of the field and identify if the problem has already started. If it has not, the farmer can take preventive remedies by applying more fertilizers, plant growth regulators etc. If the problem has already started, they can simply explain their problem to Farmonaut’s crop issue identification system and get real-time govt. approved remedies.
The app is available for android on Google PlayStore:
https://play.google.com/store/apps/details?id=com.farmonaut.android
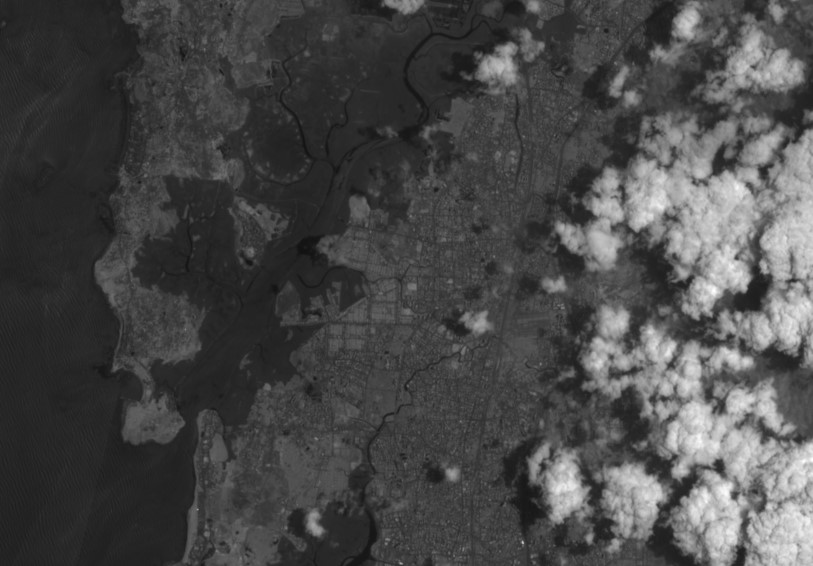
B9: Water Vapor
Water vapor imagery is used to analyze the presence and movement of water vapor moisture in the upper and middle levels of the atmosphere. Water vapor absorbs radiation in the wavelength from 6.7 to 7.3 microns. If there is a thick layer of moisture in the upper levels, the satellite receives less radiation in the 6.7 to 7.3 micron spectrum where there is a higher concentration of upper level moisture. We can interpret this greater absorption as a colder temperature and a higher concentration of water vapor. If the upper levels are dry then less radiation is absorbed by moisture in the 6.7 to 7.3 micron spectrum in the upper levels. We can interpret this lesser absorption as a warmer temperature and a lesser concentration of moisture.
Some of the major applications of the water vapor imagery are:
1. It can be used to detect dry slot precipitation intensity. Dry slots can happen when a mid-latitude cyclone or tropical system advects air from a dry air source into its circulation.
2. It can also allow the forecaster to see a complete atmospheric motion which can be used to point out troughs and ridges and where vertical motions are rising and sinking.
B10, B11, B12: Shortwave Infrared
There are so many applications of Short Wave Infrared Imagery. Some of the major applications of the Shortwave Infrared Satellite Imagery are:
Identification of Material
Due to the unique way that materials reflect data in the SWIR wavelengths, it is often possible to discriminate between materials that look similar to the naked eye, such as the rooftops made of plastic or polymer materials can be clearly differentiated from green vegetation and blue/gray asphalt and dirt.
Identifying Wildfires
Uncontrolled fires have a devastating impact on communities and natural resources. Wildfires can cover extensive areas, move at incredible speeds, and change direction without notice. Fast and effective detection is key to protecting infrastructure and ensuring communities’ safety. The SWIR band not only penetrate smoke, allowing for a clear view of the ground, but they also pinpoint sites of active burning so that response efforts can be directed most efficiently.
Estimating Soil Moisture
SWIR bands can used to assess crop moisture, as another health
indicator. Observing soil types and conditions before, during and after a crop
season is important for managing crop health. One of the agricultural community’s best management practices relates to how much post-harvest crop residue is left on a field. Crop residue preserves soil moisture and prevents soil erosion during rainy months. SWIR spectral bands can be used to map and quantify how much crop residue is left behind, predicting the soil quality for future crops.
Identifying Minerals
Based on the mineral content, different materials absorb specific wavelengths of light and reflect others. Electronic absorptions in the SWIR wavelengths can be used for detecting materials containing anion groups such as Al-OH, Mg-OH, Fe-OH, Si-OH, carbonates, ammonium, and sulphates – many of which are indicator minerals in the mining industry.
Mapping Volcanic Activity
In Novemember 2018, Mount Veniaminof had been in the news for it’s extreme volcanic activity wherein it ended up spewing ash as high as three miles in the air. The activity was so intense, that the region near it was declared as a no-fly zone. Furthermore, due to extreme clouds generated through ashes above it, it was difficult to analyze it’s volcanic activity.
We gathered True Color Images and the Short Wave Infrared images of the region surrounding Mount Veniaminof. If we can identify the activity of the volcano beforehand, we can take precautionary measures by evacuating the region at the earliest and take other preventive measures as well.
The analysis of the imagery is available on a dedicated article available on this link: https://farmonaut.com/mapping-volcanic-activity-mount-veniaminof/
Do you have an awesome idea for a landscape you think is worth exploring? Or are you looking for better resolution images for your work at affordable prices? Simply click on the link below and get a 100$ joining credit. https://farmonaut.com/satellite-imagery
Famonaut aims to provide the best service and satisfy your needs. Not sure what to do? Contact us at [email protected].
We have some more interesting articles coming up soon. Stay tuned!
Wait!!
Before that…
Follow us at:
Facebook: https://facebook.com/farmonaut
Instagram: https://instagram.com/farmonaut
Twitter: https://twitter.com/farmonaut
LinkedIn: https://www.linkedin.com/company/farmonaut/
Pinterest: https://in.pinterest.com/farmonaut/
Tumblr: https://farmonaut.tumblr.com/
Youtube: https://www.youtube.com/channel/UCYWOOPPKATLgh4L6YRlYFOQ
AppLink: https://play.google.com/store/apps/details?id=com.farmonaut.android
Website: https://farmonaut.com
Satellite Imagery: https://farmonaut.com/satellite-imagery
Satellite Imagery Samples: https://farmonaut.com/satellite-imagery-samples