In the ever-evolving world of agriculture, satellite imagery crop monitoring has emerged as a game-changing technology for farmers and agricultural professionals. This innovative approach to farm management leverages the power of satellite farms to provide unprecedented insights into crop health, soil conditions, and overall farm productivity. In this comprehensive guide, we’ll explore Farmonaut’s web app for satellite monitoring, a cutting-edge tool that’s transforming the way we approach satellite farming.
🌟 The Power of Satellite Imagery in Agriculture
Satellite imagery for farming has revolutionized the agricultural landscape, offering farmers a bird’s-eye view of their fields with unparalleled detail and frequency. This technology allows for precise monitoring of crop health, early detection of issues, and data-driven decision-making.
With satellite imagery agriculture, farmers can:
- Monitor crop health in real-time
- Identify problem areas quickly
- Optimize resource allocation
- Predict yields more accurately
- Reduce environmental impact
Let’s dive into how Farmonaut’s web app harnesses this powerful technology to benefit farmers across the United States.
🚀 Getting Started with Farmonaut’s Satellite Monitoring Web App

Farmonaut’s web app for satellite monitoring is designed with user-friendliness in mind, making it accessible even to farmers who may not be tech-savvy. The app’s intuitive interface allows users to easily navigate and interpret complex satellite data.
Adding Your Fields
To begin using the app, you’ll need to add your fields. This process is straightforward and can be done in several ways:
- Click the “Add a new field” button
- Search by address or coordinates
- Upload a KML or shape file
- Manually map the field boundaries

Once you’ve added your fields, you’ll be able to view them all in one place, complete with detailed information and analysis scales.
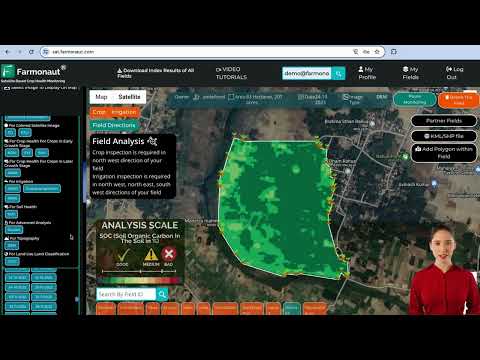
🌈 Understanding the Analysis Scale
Farmonaut’s web app uses a color-coded analysis scale to make it easy for farmers to interpret the satellite imagery crop monitoring data at a glance. This intuitive system helps even those new to satellite farming quickly understand the state of their crops.
- Green: Good condition
- Orange: Medium condition (requires attention)
- Dark Red: Poor condition (immediate action needed)

📊 Key Indices for Crop Monitoring
The app provides access to several crucial indices that give farmers a comprehensive view of their fields’ health and conditions. Let’s explore some of the most important ones:
NDVI (Normalized Difference Vegetation Index)
NDVI is a fundamental tool in satellite imagery agriculture, primarily used for assessing crop health. It’s particularly effective in the early growth stages or for crops with less dense canopies.

NDRE (Normalized Difference Red Edge)
For crops with denser canopies or in later growth stages, NDRE provides more accurate insights into crop health. This index is especially useful for crops like soybeans or corn.
Irrigation Indices
Farmonaut’s app offers three separate parameters for assessing irrigation needs:
- NDWI (Normalized Difference Water Index)
- Evapotranspiration
- NDMI (Normalized Difference Moisture Index)
These indices work together to provide a comprehensive view of your field’s water status, helping you optimize irrigation practices.

🌱 Soil Health Monitoring
Understanding soil health is crucial for successful farming, and satellite imagery farm technology can provide valuable insights. Farmonaut’s app includes a Soil Organic Carbon (SOC) index, which is particularly useful before sowing and after harvesting.
The SOC index helps farmers:
- Identify areas of low organic carbon
- Guide soil sampling for more efficient testing
- Predict potential nutrient deficiencies

🏞️ Digital Elevation Model (DEM)
The Digital Elevation Model feature is a unique aspect of Farmonaut’s satellite monitoring web app. This tool helps farmers understand the topography of their fields, which can have significant implications for water management and crop growth.
Benefits of the DEM include:
- Identifying high, medium, and low-lying areas
- Predicting potential water logging spots
- Guiding field leveling decisions
- Improving overall water management strategies

📅 Regular Reports and Updates
One of the most valuable features of Farmonaut’s satellite imagery crop monitoring system is the regular reporting. The app provides updates every 3-5 days, depending on your location, ensuring you always have the most current information about your fields.
These reports include:
- Detailed maps of your fields
- Color-coded sections indicating areas needing attention
- Comprehensive analysis of all monitored parameters
- Historical data for trend analysis

🌦️ Weather Forecasting Integration
To complement the satellite imagery data, Farmonaut’s app also includes a robust weather forecasting feature. This integration allows farmers to make more informed decisions by considering both current field conditions and upcoming weather patterns.
The weather section provides:
- Hourly forecasts for the next 2 days
- Daily forecasts for up to 8 days
- Precipitation predictions
- Temperature forecasts

🔄 Renewing and Managing Your Subscriptions
Farmonaut’s web app makes it easy to manage your subscriptions and keep your satellite monitoring active. The app provides clear information about your subscription status, including expiration dates and renewal options.
To renew your subscription:
- Navigate to the “Show all Farms” section
- Select the farms you wish to renew
- Click the “Renew” button
- Choose your desired subscription duration
- Complete the payment process

❓ Frequently Asked Questions
Q: How often is the satellite imagery updated?
A: Satellite visits occur every 3-5 days, depending on your location. Reports are generated within 24 hours of each visit.
Q: Can I use this app if I’m not tech-savvy?
A: Yes! The app is designed to be user-friendly and intuitive, with color-coded maps and clear explanations of all indices.
Q: What if there’s cloud cover over my fields?
A: The app uses radar data (SAR) when cloud cover prevents clear optical imagery, ensuring you always have up-to-date information.
Q: Can I access historical data for my fields?
A: Yes, you can request historical satellite data dating back to 2017, allowing for long-term trend analysis.
Q: Is the app suitable for all types of crops?
A: The app is versatile and can be used for various crop types, with different indices optimized for different growth stages and canopy densities.