NDVI Explained: What Is NDVI and How It Revolutionizes Precision Agriculture
In the ever-evolving world of agriculture, precision farming has become a game-changer. At the heart of this revolution lies a powerful tool known as NDVI. But what is NDVI, and how is it transforming the way we approach farming? In this comprehensive guide, we’ll delve deep into the world of NDVI, exploring its significance, applications, and impact on modern agriculture.
Understanding NDVI: The Basics
NDVI, or Normalized Difference Vegetation Index, is a simple yet powerful indicator used to assess the health and vigor of vegetation from satellite imagery. But what is the NDVI exactly, and how does it work?
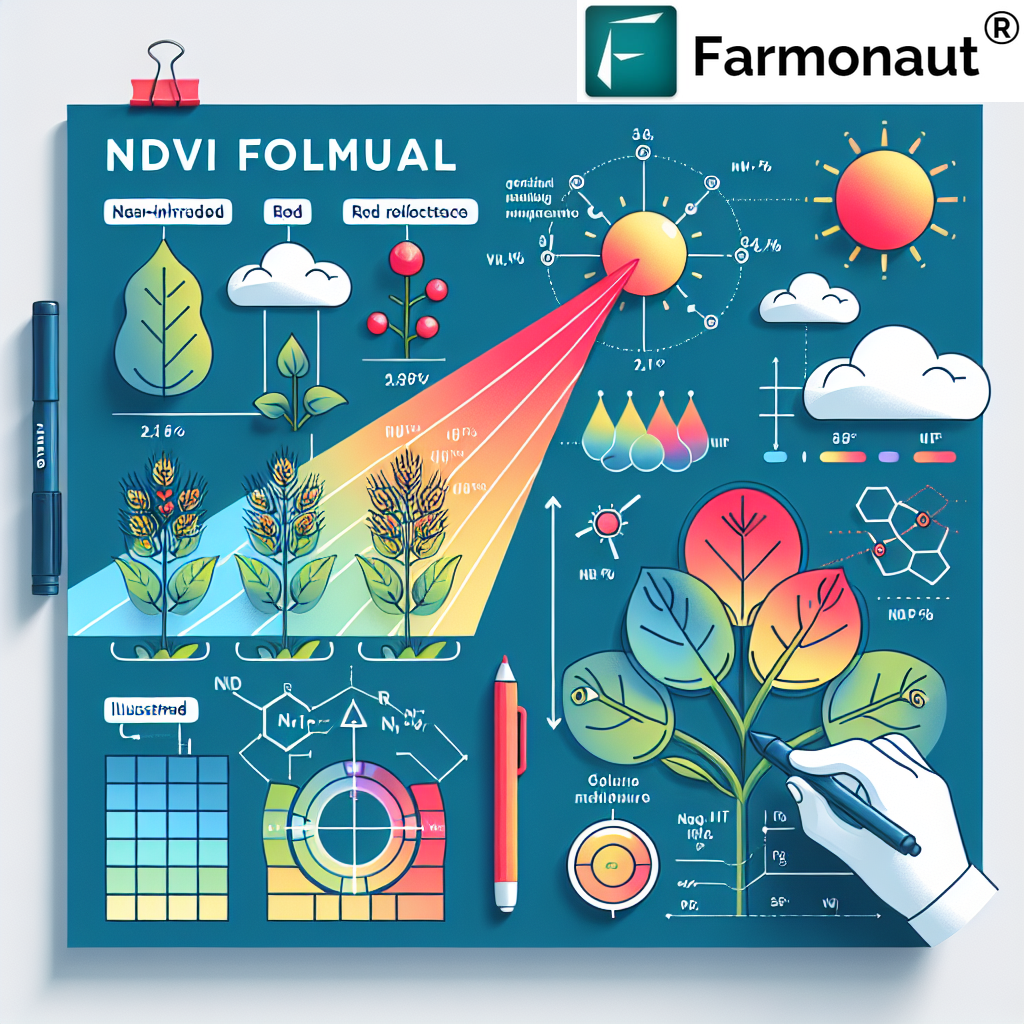
NDVI is calculated using the following formula:
NDVI = (NIR – Red) / (NIR + Red)
Where:
- NIR = Near-Infrared light reflected by vegetation
- Red = Red light reflected by vegetation
This formula produces values between -1 and 1, where:
- Negative values generally indicate water, snow, or clouds
- Values close to zero (-0.1 to 0.1) typically represent barren areas of rock or sand
- Low positive values (0.2 to 0.4) represent shrubs and grasslands
- High values (0.6 to 0.8) indicate dense vegetation like tropical forests
The Science Behind NDVI
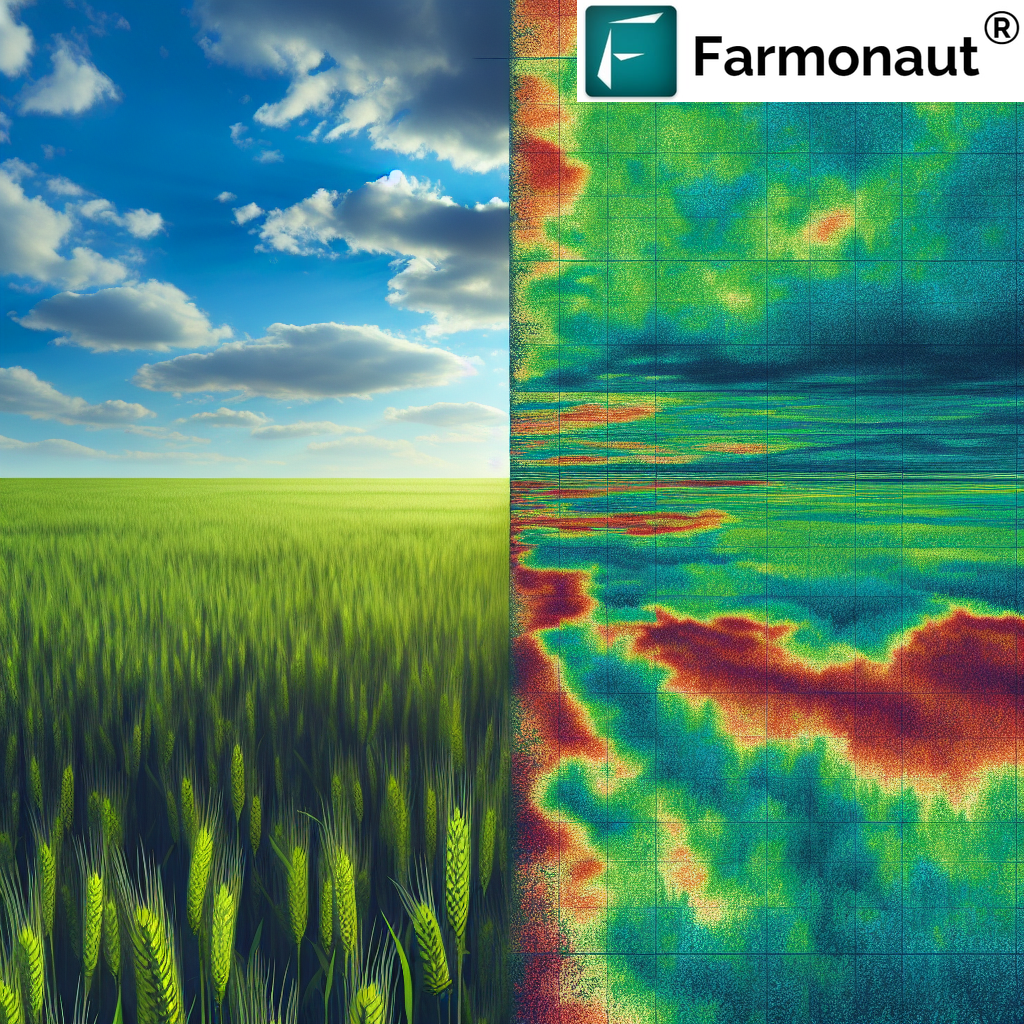
To truly understand what is NDVI, we need to delve into the science behind it. NDVI works on the principle that healthy vegetation absorbs most of the visible light that hits it and reflects a large portion of near-infrared light. Unhealthy or sparse vegetation, on the other hand, reflects more visible light and less near-infrared light.
This difference in light absorption and reflection allows us to distinguish between healthy and unhealthy vegetation using satellite imagery. The NDVI calculation takes advantage of these known differences in plant reflectance to provide a measure of vegetation health and density.
Applications of NDVI in Agriculture
Now that we’ve covered what is the NDVI, let’s explore its various applications in agriculture:
1. Crop Health Monitoring
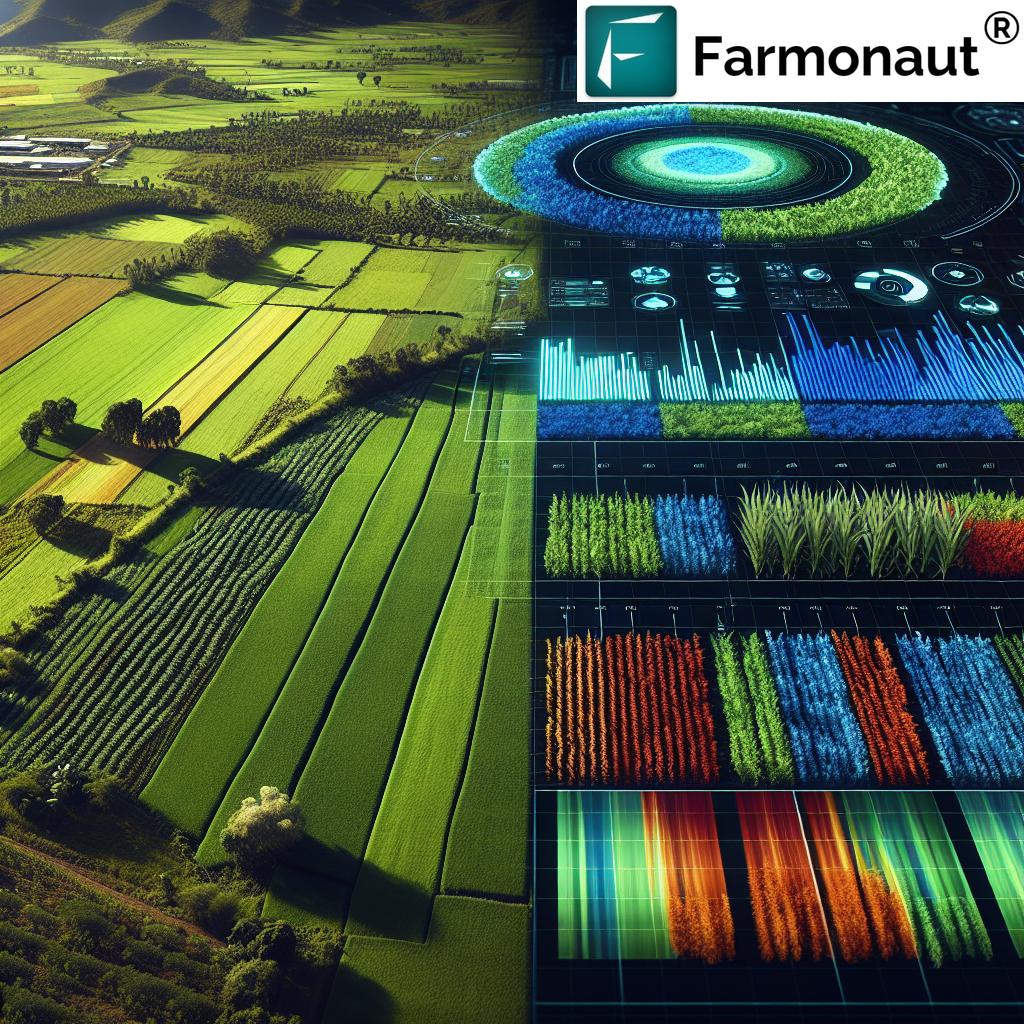
NDVI allows farmers to monitor crop health throughout the growing season. By analyzing NDVI maps, farmers can identify areas of stress in their fields, which may be due to factors such as:
- Nutrient deficiencies
- Pest infestations
- Disease outbreaks
- Water stress
2. Yield Prediction
NDVI values correlate strongly with crop yield potential. By analyzing NDVI data over time, farmers and agronomists can make more accurate yield predictions, helping with harvest planning and market forecasting.
3. Irrigation Management
NDVI can help identify areas of water stress in fields, allowing for more efficient irrigation practices. This is particularly valuable in regions facing water scarcity or during drought conditions.
4. Fertilizer Application
By identifying areas of low vegetation health, NDVI maps can guide precision fertilizer application. This targeted approach can lead to significant cost savings and reduced environmental impact.
5. Crop Insurance
Insurance companies are increasingly using NDVI data to assess crop damage and validate claims, making the process more efficient and accurate.
NDVI and Precision Agriculture: A Perfect Match
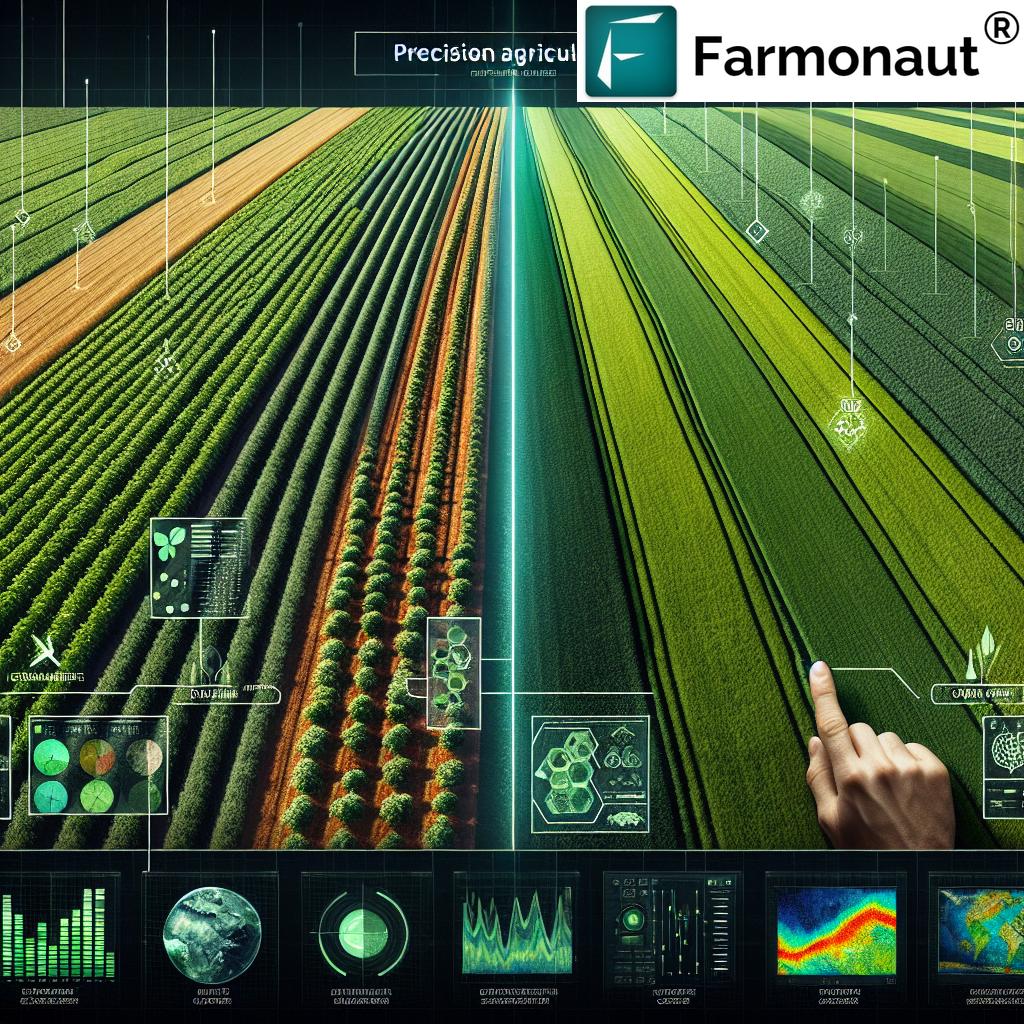
The integration of NDVI into precision agriculture practices has revolutionized farming in numerous ways:
1. Variable Rate Technology (VRT)
NDVI maps can be used to create prescription maps for variable rate application of inputs such as fertilizers, pesticides, and seeds. This ensures that resources are applied only where needed, optimizing input use and reducing waste.
2. Zone Management
NDVI data helps in delineating management zones within fields based on productivity levels. This allows for tailored management strategies for different areas of the field, maximizing overall productivity.
3. Temporal Analysis
By analyzing NDVI data over time, farmers can track crop development throughout the growing season. This temporal analysis can reveal patterns and trends that inform long-term management decisions.
4. Early Stress Detection
NDVI can detect plant stress before it becomes visible to the human eye. This early warning system allows farmers to address issues promptly, potentially saving crops and improving yields.
NDVI and Sustainable Agriculture
Understanding what is NDVI and its applications is crucial for promoting sustainable agriculture practices:
1. Resource Optimization
By enabling precise application of inputs, NDVI helps reduce overuse of water, fertilizers, and pesticides, minimizing environmental impact.
2. Biodiversity Conservation
NDVI can be used to monitor natural habitats and assess the impact of agricultural practices on surrounding ecosystems.
3. Carbon Sequestration
NDVI data can help in estimating biomass and carbon sequestration potential of agricultural lands, contributing to climate change mitigation efforts.
Limitations and Challenges of NDVI
While NDVI is a powerful tool, it’s important to understand its limitations:
1. Saturation
NDVI can saturate in dense vegetation, making it less effective for distinguishing variations in very healthy or dense canopies.
2. Atmospheric Effects
Clouds, haze, and atmospheric particles can affect NDVI readings, necessitating careful image selection and processing.
3. Soil Background
In areas with sparse vegetation, soil reflectance can influence NDVI values, potentially leading to misinterpretation.
4. Species Differences
Different plant species can have varying NDVI responses, which needs to be considered when interpreting data across diverse landscapes.
Beyond NDVI: Other Vegetation Indices
While NDVI is widely used, there are other vegetation indices that can complement or sometimes outperform NDVI in specific situations:
1. Enhanced Vegetation Index (EVI)
EVI is designed to be more sensitive in high biomass regions and less susceptible to atmospheric effects.
2. Soil Adjusted Vegetation Index (SAVI)
SAVI is useful in areas with low vegetation cover, as it minimizes soil brightness influences.
3. Normalized Difference Red Edge (NDRE)
NDRE is particularly effective for assessing nitrogen status in crops.
4. Leaf Area Index (LAI)
LAI provides information about the amount of leaf material in an ecosystem, which is crucial for understanding vegetation structure and function.
The Future of NDVI and Precision Agriculture
As technology continues to advance, the future of NDVI and precision agriculture looks promising:
1. Integration with AI and Machine Learning
AI algorithms can analyze NDVI data along with other variables to provide even more accurate and actionable insights for farmers.
2. Hyperspectral Imaging
Advanced sensors capable of capturing data across hundreds of spectral bands will allow for more detailed vegetation analysis beyond NDVI.
3. Real-time Monitoring
Improvements in satellite technology and data processing will enable near real-time NDVI monitoring, allowing for faster response to changing field conditions.
4. Integration with IoT and Robotics
NDVI data will increasingly be used to guide autonomous farm equipment and integrated with IoT sensors for comprehensive farm management.
Farmonaut: Pioneering NDVI-Based Precision Agriculture
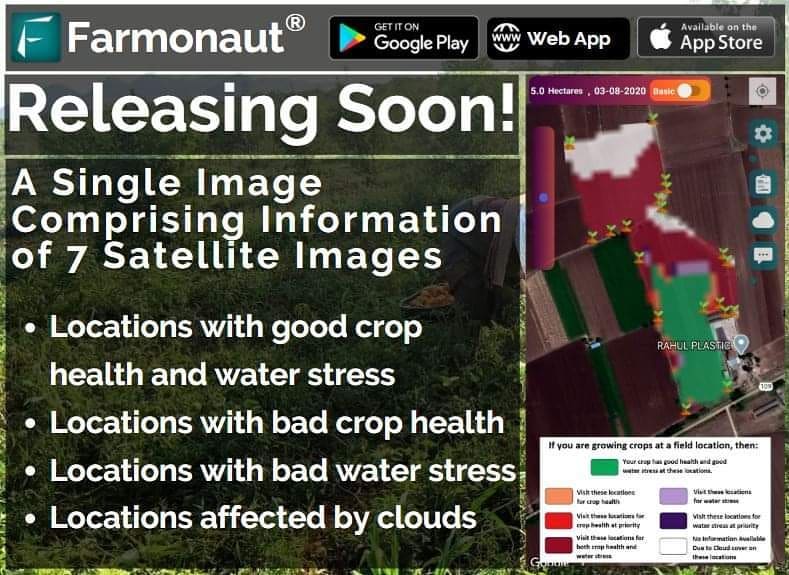
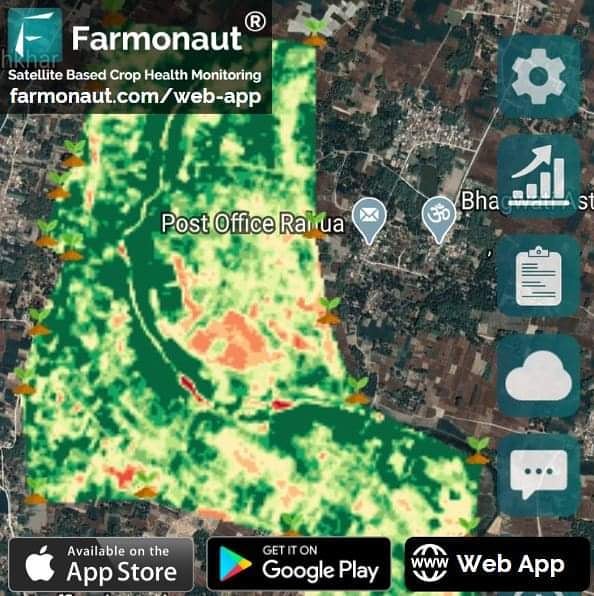
At Farmonaut, we’re at the forefront of leveraging NDVI and other advanced technologies to revolutionize agriculture. Our satellite-based farm management solutions provide farmers with real-time crop health monitoring, including NDVI analysis, to optimize their operations.
Here’s how Farmonaut’s Satellite System compares to drone and IoT-based farm monitoring:
| Feature | Farmonaut Satellite System | Drone-based Monitoring | IoT-based Monitoring |
|---|---|---|---|
| Coverage Area | Large scale (entire farms) | Limited by flight time and regulations | Limited by sensor placement |
| Frequency of Updates | Regular (every few days) | As needed, but labor-intensive | Continuous, but localized |
| Cost-effectiveness | High (no hardware required) | Moderate (equipment and operator costs) | Variable (depending on sensor density) |
| Ease of Use | High (cloud-based platform) | Moderate (requires training) | Moderate (setup and maintenance required) |
| Data Integration | Comprehensive (weather, soil, etc.) | Limited to visual and multispectral data | Specific to sensor types |
Our platform not only provides NDVI data but also integrates it with other crucial information such as weather forecasts, soil moisture levels, and historical trends. This comprehensive approach allows farmers to make informed decisions that optimize crop yields while minimizing resource use.
To experience the power of NDVI and precision agriculture for yourself, we invite you to try Farmonaut:
- Download our mobile app:
Android |
iOS - Explore our Satellite API for developers
- Learn more about our Weather API
Ready to revolutionize your farming practices with NDVI and precision agriculture? Subscribe to Farmonaut today:
Conclusion
NDVI has undoubtedly revolutionized precision agriculture, providing farmers with valuable insights into crop health and enabling more efficient resource management. As we’ve explored in this comprehensive guide, understanding what is NDVI and what is the NDVI formula is crucial for leveraging this powerful tool effectively.
From crop health monitoring to yield prediction, irrigation management, and beyond, NDVI has proven to be an invaluable asset in modern farming practices. Its integration with other technologies and its role in promoting sustainable agriculture make it a cornerstone of precision farming.
As we look to the future, the continued evolution of NDVI technology, coupled with advancements in AI, machine learning, and satellite imaging, promises even greater potential for optimizing agricultural practices and addressing global food security challenges.
At Farmonaut, we’re committed to harnessing the power of NDVI and other cutting-edge technologies to empower farmers and revolutionize agriculture. Join us in this exciting journey towards a more efficient, sustainable, and productive future for farming.
FAQ Section
Q1: What is NDVI and how does it work?
A: NDVI (Normalized Difference Vegetation Index) is a numerical indicator that uses the visible and near-infrared bands of the electromagnetic spectrum to analyze remote sensing measurements and assess whether the target being observed contains live green vegetation or not. It works by calculating the difference between near-infrared (which vegetation strongly reflects) and red light (which vegetation absorbs).
Q2: How is NDVI calculated?
A: NDVI is calculated using the formula: NDVI = (NIR – Red) / (NIR + Red), where NIR is the near-infrared reflectance and Red is the red reflectance. The result is a value between -1 and 1, with higher values indicating healthier vegetation.
Q3: What do different NDVI values mean?
A: NDVI values typically range from -1 to 1. Negative values usually indicate water or snow, values close to zero represent barren areas like rocks or sand, low positive values (0.2 to 0.4) indicate shrubs and grasslands, while high values (0.6 to 0.8) represent dense vegetation like forests.
Q4: How often should NDVI data be collected for effective crop monitoring?
A: The frequency of NDVI data collection depends on the crop type and growth stage. Generally, collecting data every 1-2 weeks during the growing season is beneficial for most crops. However, more frequent monitoring may be necessary during critical growth stages or when dealing with fast-growing crops.
Q5: Can NDVI detect specific plant diseases?
A: While NDVI can detect general plant stress, it cannot identify specific diseases. However, it can alert farmers to areas of potential concern, which can then be investigated further through field visits or more detailed analysis.
Q6: How does cloud cover affect NDVI readings?
A: Cloud cover can significantly affect NDVI readings as clouds obstruct the satellite’s view of the ground. Most NDVI products use cloud-masking techniques to remove cloud-contaminated pixels from the final output. It’s important to use clear-sky images for accurate NDVI analysis.
Q7: Can NDVI be used for all types of crops?
A: NDVI can be used for most types of crops, but its effectiveness may vary. It works particularly well for broadleaf crops but may be less sensitive for some narrow-leaf crops or during certain growth stages. In some cases, other vegetation indices might be more suitable.
Q8: How does Farmonaut incorporate NDVI data into its platform?
A: Farmonaut integrates NDVI data from satellite imagery into our comprehensive farm management platform. We process this data to provide farmers with easy-to-understand crop health maps, temporal analysis of vegetation health, and actionable insights for precision agriculture practices.
Q9: Is special equipment needed to use NDVI in farming?
A: When using satellite-based NDVI like Farmonaut provides, no special on-farm equipment is needed. Farmers can access NDVI data and insights through our web and mobile applications. However, for very high-resolution NDVI, some farmers use drones equipped with multispectral cameras.
Q10: How does NDVI contribute to sustainable farming practices?
A: NDVI contributes to sustainable farming by enabling precise application of resources like water and fertilizers. By identifying areas of stress or low productivity, farmers can target their interventions, reducing overall input use while maintaining or improving yields. This leads to more efficient resource use and lower environmental impact.
We hope this comprehensive guide has helped you understand what is NDVI and its crucial role in modern agriculture. At Farmonaut, we’re dedicated to making this powerful technology accessible to farmers worldwide. To learn more about how you can leverage NDVI and other precision agriculture tools, visit our website or contact us today.


