Mastering NDVI: A Comprehensive Guide to Interpreting Values and Their Meaning in Agriculture

In the ever-evolving world of precision agriculture, understanding and interpreting key vegetation indices has become crucial for farmers, agronomists, and agricultural researchers. Among these indices, the Normalized Difference Vegetation Index (NDVI) stands out as a powerful tool for assessing crop health, vigor, and productivity. In this comprehensive guide, we at Farmonaut will delve deep into the intricacies of NDVI interpretation, exploring its significance, methodology, and practical applications in modern farming.
Table of Contents
- Introduction to NDVI
- Understanding NDVI Values
- NDVI Value Interpretation: A Detailed Breakdown
- Factors Influencing NDVI Values
- Practical Applications of NDVI in Agriculture
- NDVI and Farmonaut: Revolutionizing Precision Agriculture
- Comparing Satellite, Drone, and IoT-based Farm Monitoring
- Advanced NDVI Analysis Techniques
- Challenges and Limitations of NDVI
- Future Trends in Vegetation Indices
- Conclusion
- FAQ Section
1. Introduction to NDVI
The Normalized Difference Vegetation Index (NDVI) is a standardized index that allows us to generate an image displaying vegetation greenness, also known as relative biomass. This index capitalizes on the contrast between red and near-infrared reflection of solar radiation by vegetation. Healthy vegetation absorbs most of the visible light that hits it and reflects a large portion of near-infrared light. Unhealthy or sparse vegetation reflects more visible light and less near-infrared light.
2. Understanding NDVI Values
The NDVI value is calculated using the following formula:
NDVI = (NIR – RED) / (NIR + RED)
Where:
- NIR = Near-infrared reflection
- RED = Red light reflection
The resulting NDVI value is always between -1 and +1. However, the absence of green leaves gives a value close to zero. A zero means no vegetation and close to +1 (0.8 – 0.9) indicates the highest possible density of green leaves.
3. NDVI Value Interpretation: A Detailed Breakdown
Understanding the NDVI value meaning is crucial for effective agricultural management. Let’s break down the NDVI value interpretation in detail:
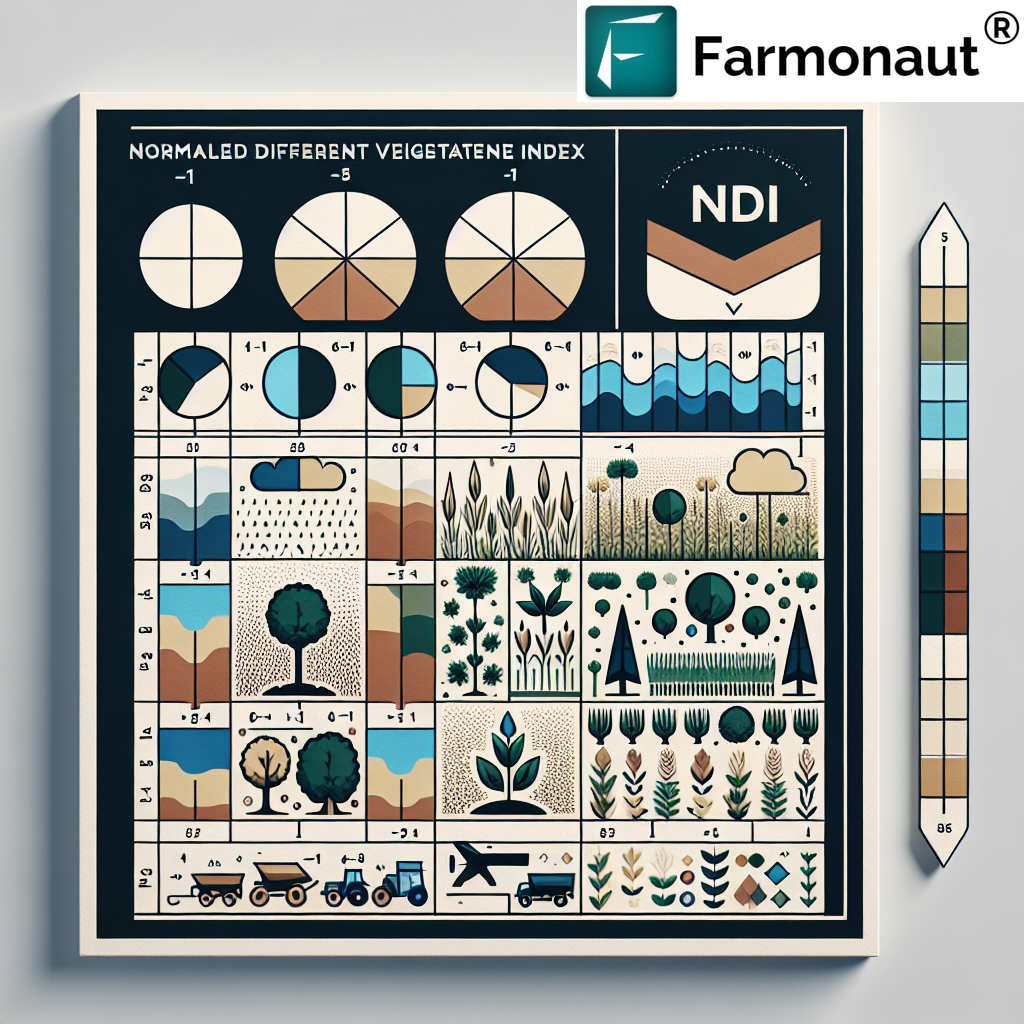
- -1 to 0: These values typically represent water bodies, snow, ice, or barren areas with little to no vegetation.
- 0 to 0.1: These values often indicate bare soil, rock, or urban areas.
- 0.1 to 0.2: This range usually represents areas with very sparse vegetation, such as shrubs or grasslands in arid regions.
- 0.2 to 0.4: These values indicate moderate vegetation, typical of grasslands or senescing crops.
- 0.4 to 0.6: This range represents dense vegetation, often found in temperate and tropical forests or crops at their peak growth stage.
- 0.6 to 0.8: These high values indicate very healthy and dense vegetation, typical of rainforests or crops with a high leaf area index.
- 0.8 to 1.0: The highest NDVI values, often indicating exceptionally vigorous vegetation or possibly oversaturated images.
It’s important to note that NDVI value interpretation can vary depending on the specific ecosystem, crop type, and time of year. For instance, a value of 0.3 might indicate healthy vegetation in a semi-arid environment but could suggest stress in a typically lush agricultural field.
4. Factors Influencing NDVI Values
Several factors can influence NDVI values, and understanding these is crucial for accurate interpretation:
- Seasonal Changes: NDVI values naturally fluctuate with the seasons as vegetation grows and senesces.
- Soil Background: In areas with sparse vegetation, soil reflectance can significantly affect NDVI values.
- Atmospheric Conditions: Clouds, aerosols, and water vapor can alter the NDVI signal received by satellites.
- Viewing Angle and Sun Position: These factors can affect the amount of reflected light captured by sensors.
- Plant Stress: Various stressors like drought, pests, or diseases can lower NDVI values.
- Crop Type and Growth Stage: Different crops have varying NDVI signatures throughout their growth cycle.
5. Practical Applications of NDVI in Agriculture
NDVI has numerous practical applications in agriculture, including:
- Crop Health Monitoring: Regular NDVI measurements can help detect early signs of crop stress or disease.
- Yield Prediction: NDVI values correlate strongly with biomass, allowing for yield estimations.
- Irrigation Management: NDVI can indicate water stress, helping optimize irrigation schedules.
- Fertilizer Application: By identifying areas of low vegetation vigor, NDVI maps can guide variable-rate fertilizer applications.
- Pest and Disease Detection: Sudden changes in NDVI can alert farmers to potential pest infestations or disease outbreaks.
- Crop Insurance: NDVI data can provide objective evidence of crop damage for insurance claims.
6. NDVI and Farmonaut: Revolutionizing Precision Agriculture
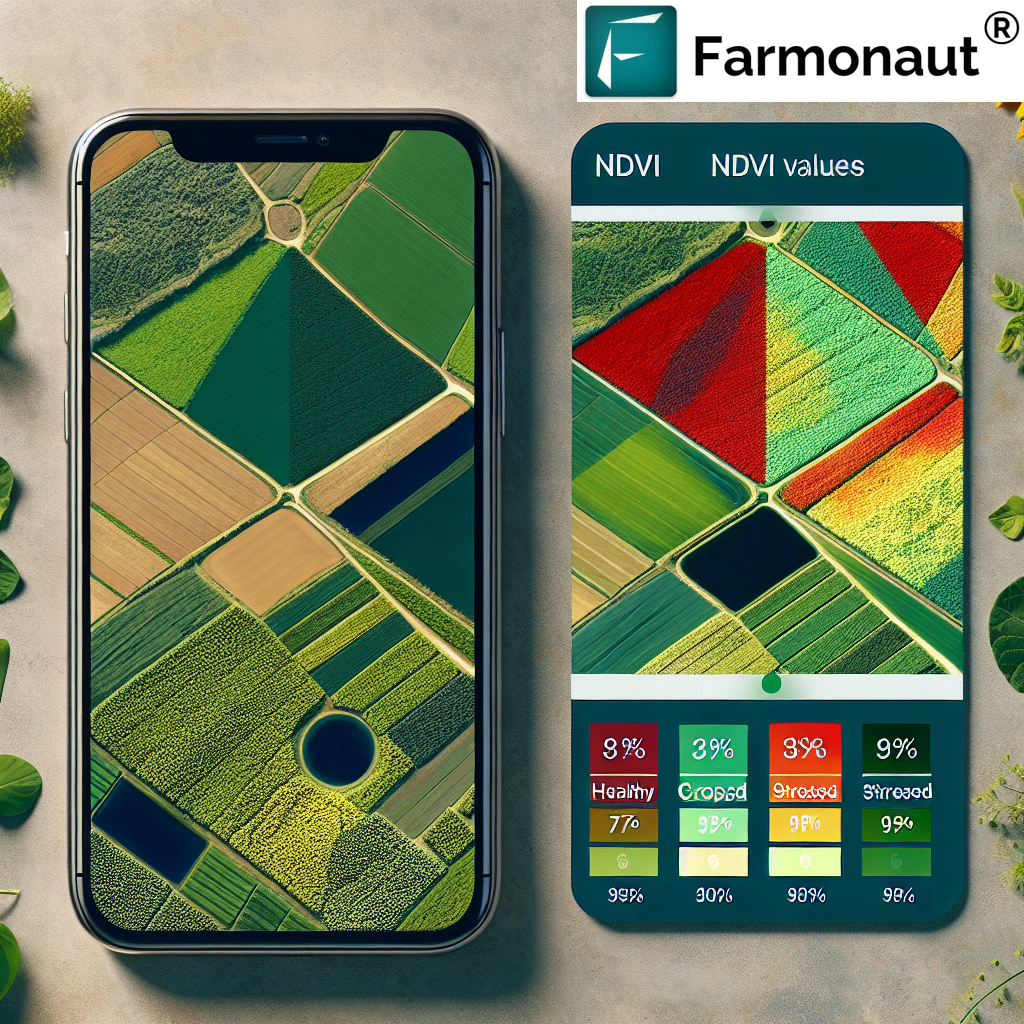
At Farmonaut, we’ve integrated advanced NDVI analysis into our satellite-based farm management solutions. Our platform provides farmers with regular, high-resolution NDVI maps of their fields, allowing for precise monitoring of crop health and development. By combining NDVI data with other metrics and our AI-powered advisory system, we offer actionable insights that help farmers optimize their operations and increase yields.
Our Jeevn AI Advisory System takes NDVI interpretation to the next level by considering factors such as crop type, growth stage, local climate conditions, and historical data to provide highly accurate and context-specific recommendations. This advanced NDVI value interpretation helps farmers make informed decisions about irrigation, fertilization, and pest management.
To experience the power of Farmonaut’s NDVI analysis and farm management tools, visit our app page or download our mobile app for Android or iOS.
7. Comparing Satellite, Drone, and IoT-based Farm Monitoring
While there are various methods for farm monitoring, satellite-based systems like Farmonaut offer distinct advantages. Here’s a comparison:
| Feature | Farmonaut Satellite System | Drone-based Monitoring | IoT-based Monitoring |
|---|---|---|---|
| Coverage Area | Large (entire farms) | Medium | Limited (point-based) |
| Frequency of Data | Regular (every few days) | On-demand | Continuous |
| Cost | Low | Medium to High | High (initial setup) |
| Ease of Use | High (no equipment needed) | Medium (requires piloting skills) | Medium (requires installation) |
| Data Processing | Automated | Manual or semi-automated | Automated |
| Weather Independence | Medium (affected by cloud cover) | Low (affected by wind, rain) | High |
| Scalability | High | Medium | Low to Medium |
8. Advanced NDVI Analysis Techniques
While basic NDVI interpretation is valuable, advanced analysis techniques can provide even deeper insights:
- Time-Series Analysis: By examining NDVI values over time, we can detect trends, anomalies, and seasonal patterns in vegetation health.
- Multi-Index Approach: Combining NDVI with other vegetation indices like EVI (Enhanced Vegetation Index) or SAVI (Soil-Adjusted Vegetation Index) can provide a more comprehensive view of plant health.
- Machine Learning Integration: At Farmonaut, we use machine learning algorithms to analyze NDVI data alongside other parameters, enabling more accurate predictions of crop yields and early detection of potential issues.
- Hyperspectral Analysis: While not widely available, hyperspectral imaging allows for the calculation of more precise vegetation indices that can detect subtle changes in plant physiology.
9. Challenges and Limitations of NDVI
While NDVI is a powerful tool, it’s important to be aware of its limitations:
- Saturation: NDVI can saturate in areas of dense vegetation, making it less sensitive to changes in very healthy crops.
- Atmospheric Effects: Cloud cover, aerosols, and water vapor can interfere with NDVI measurements from satellites.
- Soil Background Influence: In areas with sparse vegetation, soil reflectance can significantly affect NDVI values.
- Non-Specificity: NDVI doesn’t provide information about the specific cause of vegetation stress (e.g., water stress vs. pest damage).
- Temporal Resolution: Depending on the satellite system used, there may be gaps between available images, potentially missing short-term changes.
At Farmonaut, we address these limitations by combining NDVI with other data sources and advanced analysis techniques to provide more robust and accurate insights.
10. Future Trends in Vegetation Indices
The field of remote sensing and vegetation analysis is rapidly evolving. Some exciting trends to watch include:
- Higher Resolution Imagery: Advancements in satellite technology are enabling more detailed NDVI maps.
- AI and Deep Learning: These technologies are improving the interpretation of NDVI and other vegetation indices.
- Integration with IoT: Combining satellite-based NDVI with ground-based sensors for more comprehensive monitoring.
- Custom Indices: Development of crop-specific or region-specific vegetation indices for more targeted analysis.
- Real-Time Processing: Faster data processing and delivery systems for near-real-time NDVI updates.
11. Conclusion
Understanding and effectively interpreting NDVI values is crucial for modern precision agriculture. As we’ve explored in this comprehensive guide, NDVI provides valuable insights into crop health, vigor, and potential yield. However, it’s important to consider NDVI as part of a broader toolset for farm management.
At Farmonaut, we’re committed to harnessing the power of NDVI and other advanced technologies to provide farmers with actionable insights. Our satellite-based monitoring system, combined with AI-driven analytics, offers a cost-effective and scalable solution for precision agriculture.
We invite you to explore how Farmonaut can transform your farming practices. Visit our website to learn more about our services, or check out our API documentation for developers interested in integrating our data into their own applications.
For those ready to take the next step in precision agriculture, consider subscribing to Farmonaut:
12. FAQ Section
Q1: What does NDVI stand for?
A: NDVI stands for Normalized Difference Vegetation Index. It’s a standardized index used to measure vegetation health and density using satellite imagery.
Q2: How is NDVI calculated?
A: NDVI is calculated using the formula: NDVI = (NIR – RED) / (NIR + RED), where NIR is the near-infrared reflection and RED is the red light reflection.
Q3: What is a good NDVI value?
A: Generally, NDVI values above 0.6 indicate dense, healthy vegetation. However, “good” NDVI values can vary depending on the crop type, growth stage, and local environment.
Q4: Can NDVI detect crop diseases?
A: While NDVI can’t directly identify specific diseases, it can detect changes in plant health that may be caused by diseases. Sudden drops in NDVI values can alert farmers to potential issues.
Q5: How often should I check NDVI values for my crops?
A: The frequency depends on your specific needs, but many farmers find weekly or bi-weekly NDVI updates useful. With Farmonaut, you can access regular NDVI updates for your fields.
Q6: Can NDVI be used for all types of crops?
A: NDVI can be used for most crops, but its effectiveness may vary. Some crops, particularly those with unique leaf structures or growth patterns, may require additional indices for comprehensive monitoring.
Q7: How does Farmonaut use NDVI data?
A: Farmonaut integrates NDVI data with other metrics and AI analysis to provide comprehensive insights on crop health, potential yield, and management recommendations.
Q8: Is satellite-based NDVI monitoring better than drone-based monitoring?
A: Both have their advantages. Satellite-based monitoring, like that offered by Farmonaut, provides broader coverage and is more cost-effective for large areas, while drone-based monitoring can offer higher resolution for smaller areas.
Q9: Can NDVI help with irrigation management?
A: Yes, NDVI can indicate water stress in crops, helping farmers optimize their irrigation schedules and conserve water.
Q10: How accurate is NDVI for yield prediction?
A: NDVI has a strong correlation with biomass and can be a good indicator of potential yield. However, for the most accurate predictions, it’s best to combine NDVI with other data sources and analysis techniques, as we do at Farmonaut.

We hope this comprehensive guide has deepened your understanding of NDVI interpretation and its crucial role in modern agriculture. Remember, while NDVI is a powerful tool, it’s most effective when used as part of a comprehensive farm management strategy. At Farmonaut, we’re dedicated to helping farmers leverage NDVI and other advanced technologies to optimize their operations and increase yields sustainably.
For more information on how Farmonaut can help you implement NDVI analysis and other precision agriculture techniques on your farm, please visit our website or contact our team of experts. Together, we can cultivate a more productive and sustainable future for agriculture.