Satellite data obtained for the vegetation are based on what actually has been seen. For example, for the land which is sown, the soil is exposed to the satellite and based on which the satellite images are generated. Similarly the height of the vegetation also plays an important role in knowing the crop health and condition. Interpretation of such data requires different color coding or analysis. The accuracy of crop health will help farmers in managing their farms better.
Problem:
Vegetation at an early stage seems like the soil is more exposed to the satellite and hence the indices obtained would be based on the default analysis scale. However for taller vegetation the data images obtained are much more accurate.
The issues faced at an early stage of vegetation would not be recognised and hence the decision to be made would be unidentified. To clear such circumstances Farmonaut has introduced 2 types of colormap.
Colormap
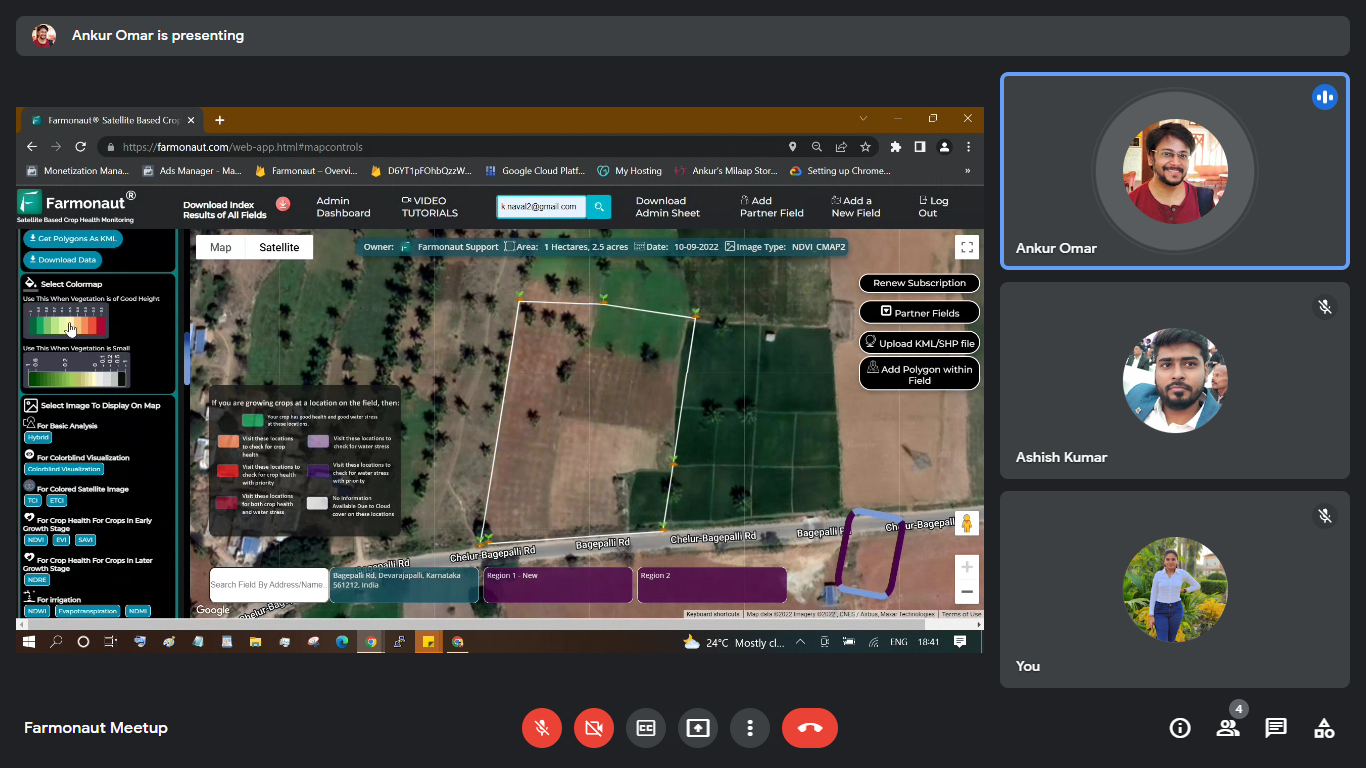
Colormaps helps to recognised the condition of vegetation at early stages.The two kinds of colomaps are:
- Colormap 1: It ranges from 0.1 to 1. It can also be called as the default color map which is shown at first for all indices. Its color ranges from green to red stating green as good vegetation and red as danger. The color map is as shown in the figure below.
![]()
- Colormap 2: It ranges from -1 to 1. It is basically used for the early growth stages or for low heighted vegetation. The color ranges from different shades of green. It is recommended to use colormap 2 during the early growth stages. The colormap 2 is shown in the figure below.
![]()
The colormap 2 states the accuracy and sensitivity of the crops. The color map 1 range 0.1 to 0.2 is magnified and shown as the colormap 2 in different shades of green. When a whole farmland is sown on a particular day still there may be growth issues in some areas which cannot be identified with the colormap 1 and hence colormap 2 can be used. However, the colormaps are available for NDVI, NDRE, NDMI, NDWI, SAVI, EVI, VARI and RVI. The colormaps are not required for the TCI, ETCI, Hybrid image, DEM and Colorblind Visualization.
![]()
![]()
How to Access Color maps?
Step 1: Login to your account on the Farmonaut application.

Step 2: Select the field you have sown recently or it at an early growth stage.
Step 3: Select the image you want such as NDVI.
Step 4: Click on the colormap 1 or 2 as per the vegetation.

Step 5: Analyze the image shown as per the scale.
