Radar Vegetation Index (RVI)
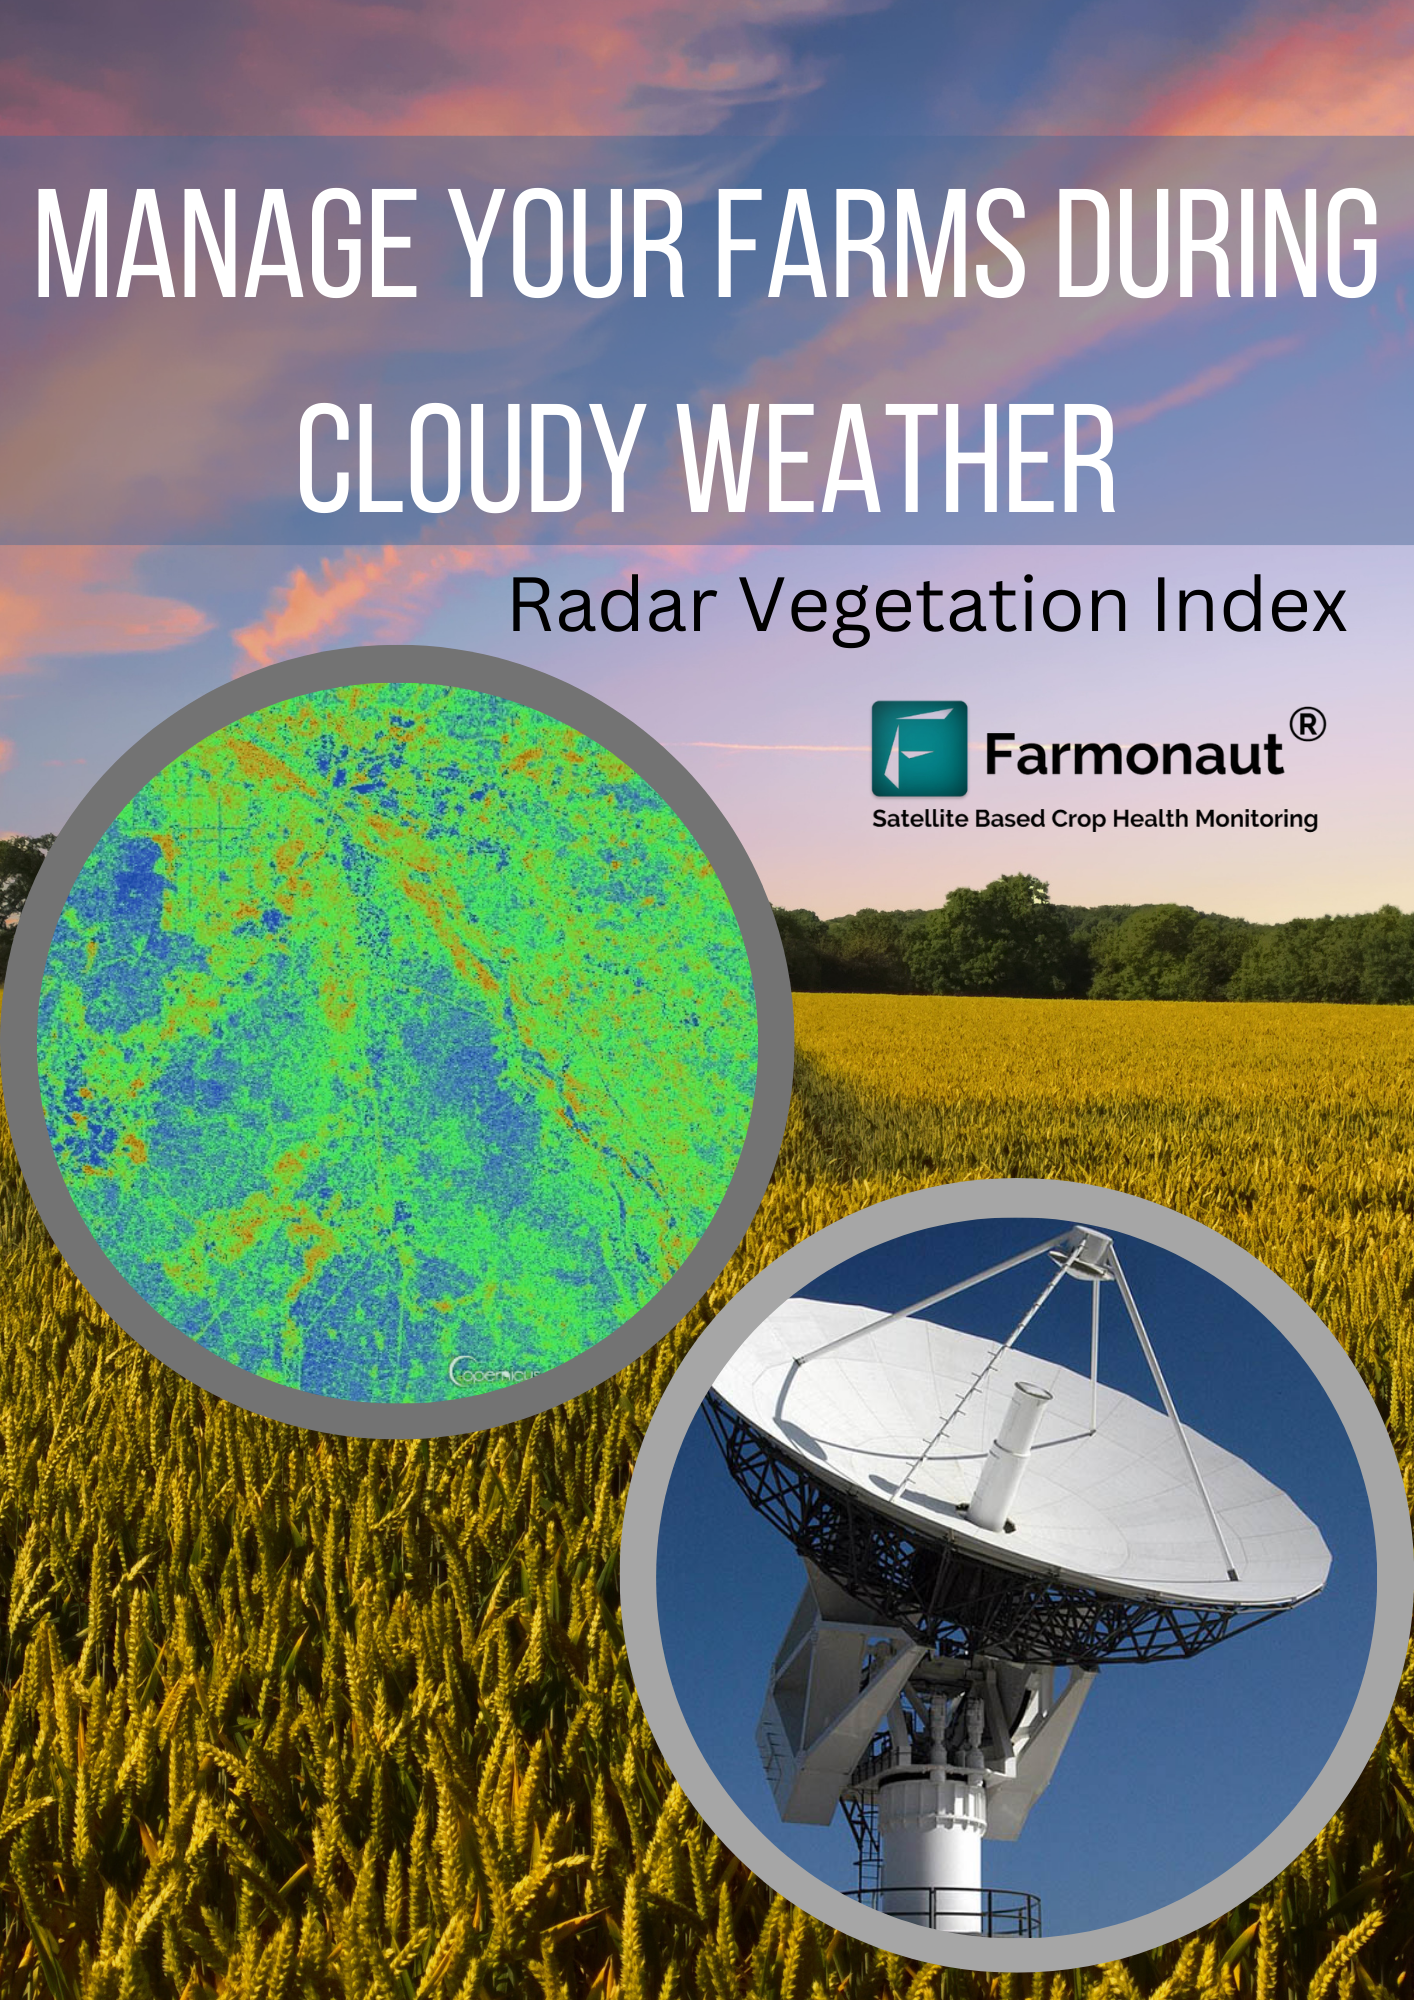
Radar data is obtained by a detection system with the use of radio waves which helps in determination of some parameters such as altitude, height, etc. Radar vegetation Index is used in agriculture for knowing the condition of the vegetation by measuring the linear scattering intensities. The radar data are obtained by the usage of Synthetic Aperture Radar. RVI can also be known as the alternative to NDVI (Normalized Difference Vegetation Index).
Problem caused:
Different satellite data has been collected for knowing crop health, soil health and irrigation. Obtaining data through satellite can cause issues during cloud cover. Cloud cover specially occurring in monsoon season makes it infeasible to collect data of crop health during the satellite visit.
“To deal with the cloud cover and to solve the issues faced in collecting data through satellite during cloudy weather, Farmonaut provides Radar Vegetation index in time series analysis.”
Farmonaut offers:
The satellite data is captured when the satellite passes through the field. The satellite visit occurs every 5 days to capture the crop health data. Monsoon season generally faces cloud cover everyday which makes it difficult for the satellite to capture the data during every visit. Not only during monsoon but also during regular days cloud cover can be seen on the field. The satellite visibility gets blocked and hence results in no data.
Not compromising on the data and to overcome the inconvenience caused by cloud cover to capture the data, Farmonaut has introduced RVI which helps get crop health data during the cloud cover. The data obtained can be visualized in the time series by selecting the date on which farmers need the data. The Radar data recorded assure that during any condition the crop health data would be provided to the farmers.
How to Access RVI Data?
Step 1: Login to your account on the Farmonaut application.
Step 2: Select the farm you want the data for.
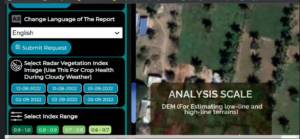
Step 3: When there is cloudy weather, Go to Radar Vegetation Index in the Controls.

Step 4: Select the date for which you want to visualize the data.
Step 5: The crop health image appears, analyze it using the scale provided.
