Mastering Normalized Difference Indices: From NDBI to NDMI – A Comprehensive Guide for Remote Sensing in Agriculture
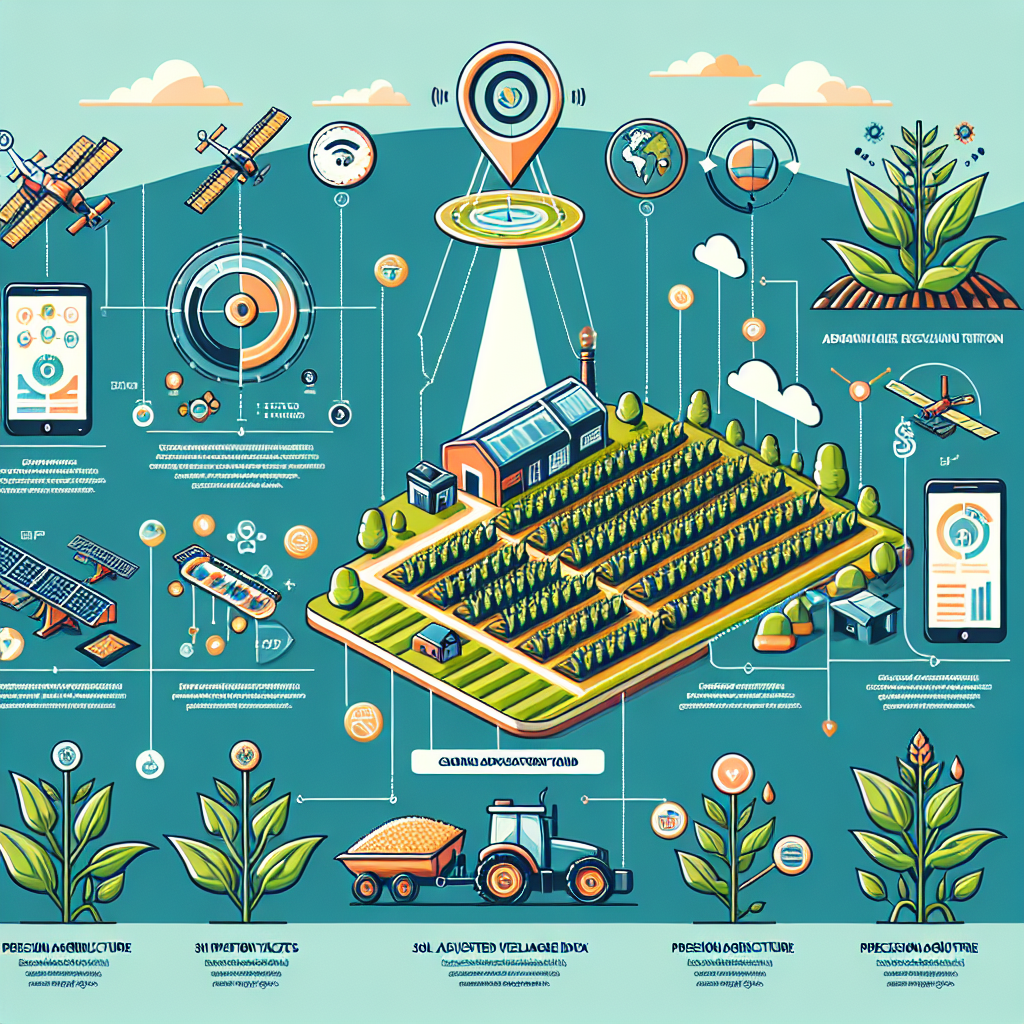
In the ever-evolving landscape of precision agriculture, remote sensing techniques have become indispensable tools for farmers, agronomists, and researchers alike. At Farmonaut, we leverage these cutting-edge technologies to provide our users with invaluable insights into crop health, soil conditions, and overall farm management. One of the most powerful tools in our arsenal is the family of Normalized Difference Indices. In this comprehensive guide, we’ll explore the various types of these indices, their applications, and how they can revolutionize your agricultural practices.
Table of Contents
- Introduction to Normalized Difference Indices
- Normalized Difference Built-up Index (NDBI)
- Normalized Difference Chlorophyll Index (NDCI)
- Normalized Difference Drought Index (NDDI)
- Normalized Difference Moisture Index (NDMI)
- Normalized Difference Soil Index (NDSI)
- Farmonaut’s Satellite System vs. Drone and IoT-based Monitoring
- Implementing Normalized Difference Indices in Your Farm Management Strategy
- FAQs
1. Introduction to Normalized Difference Indices
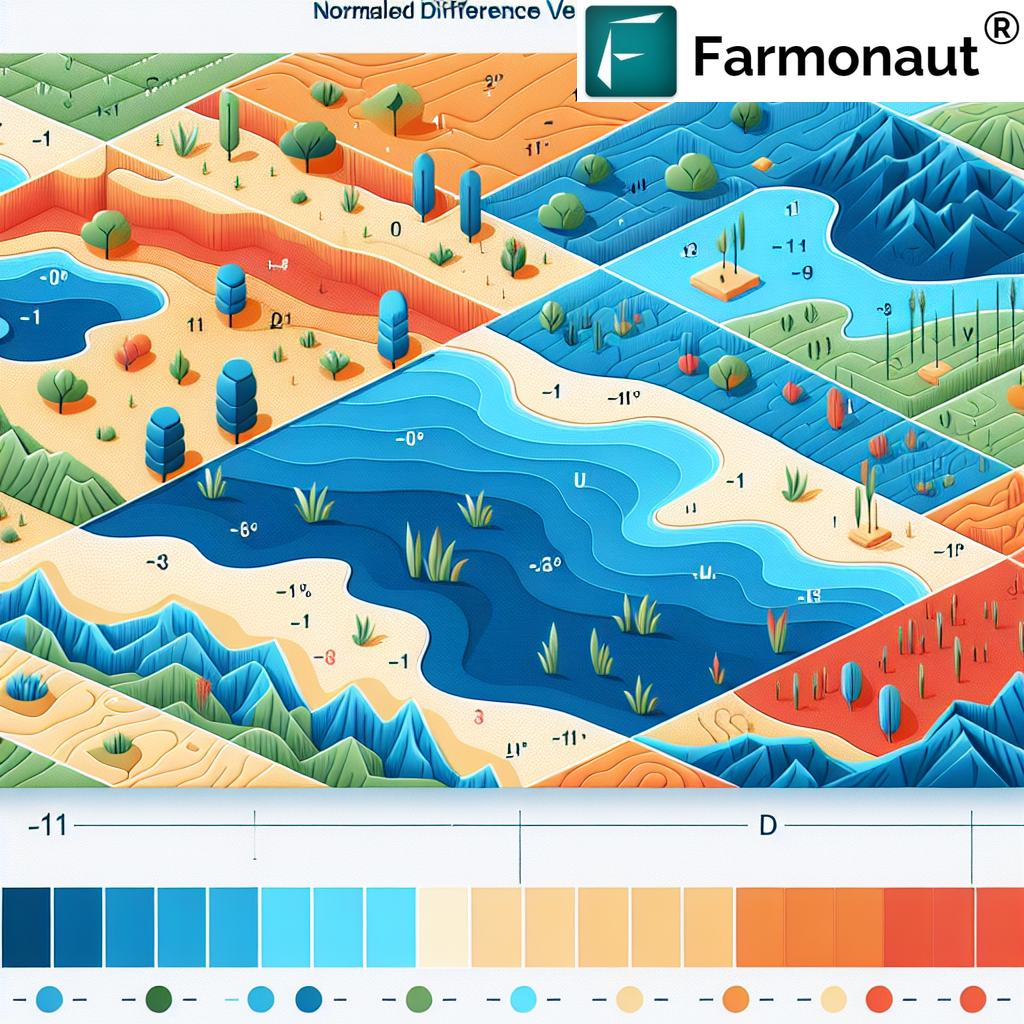
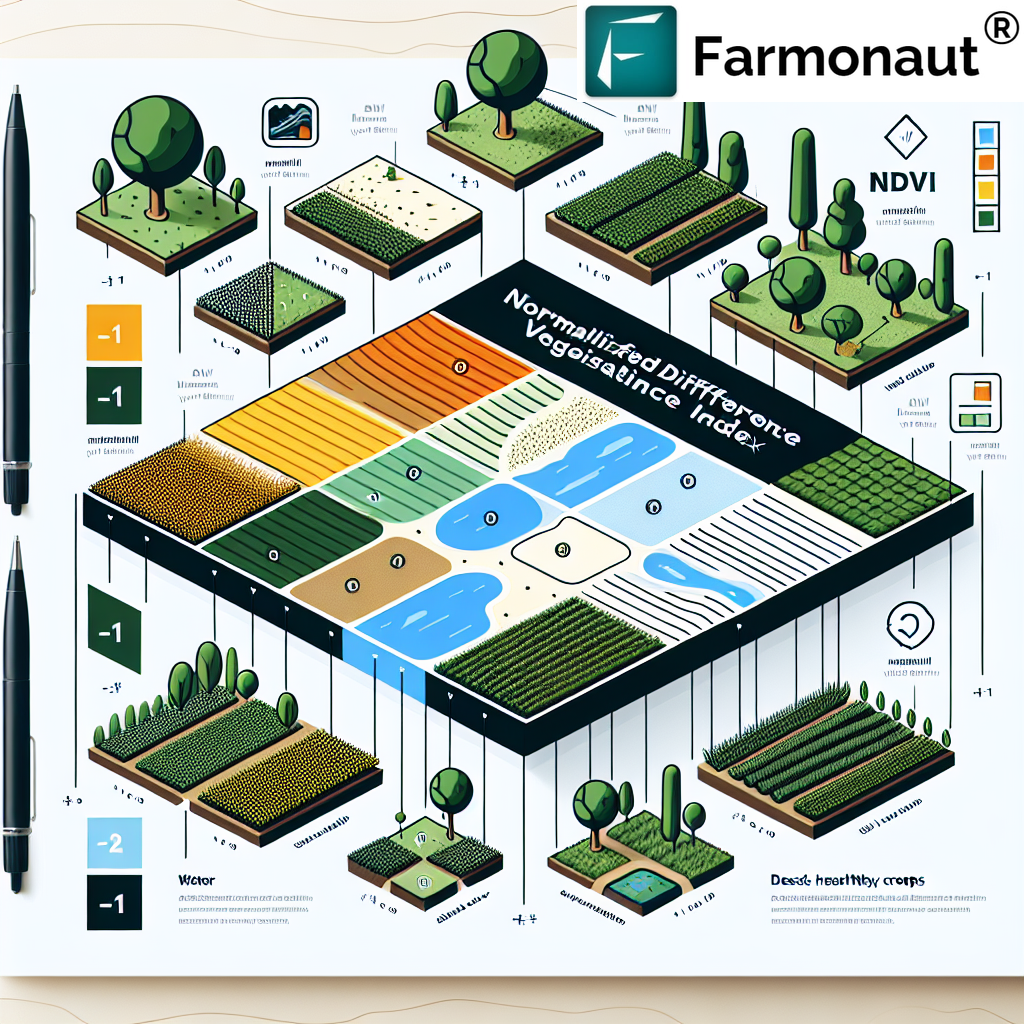
Normalized Difference Indices are mathematical formulas used in remote sensing to analyze various aspects of the Earth’s surface. These indices are calculated using different spectral bands from satellite or aerial imagery. The general formula for a normalized difference index is:
ND = (Band A – Band B) / (Band A + Band B)
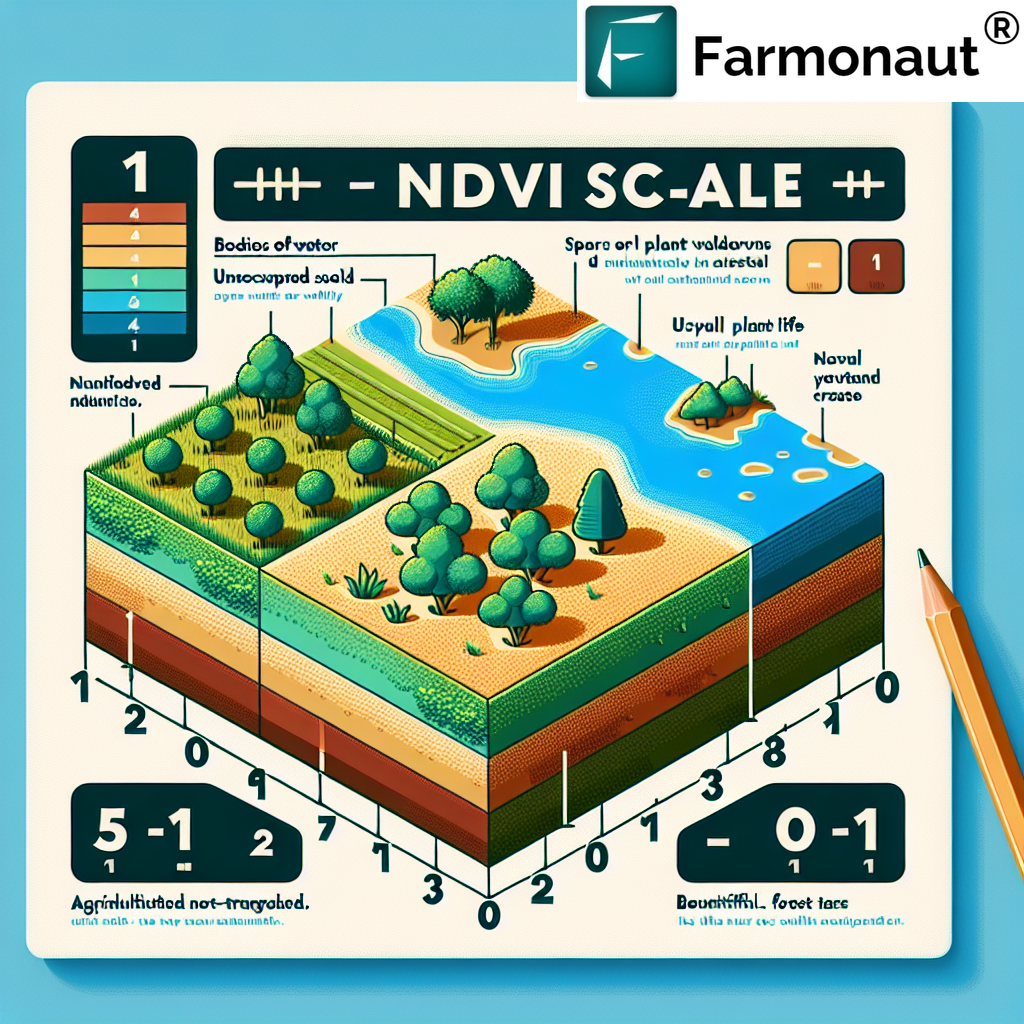
Where Band A and Band B are reflectance values from different parts of the electromagnetic spectrum. The resulting values typically range from -1 to +1, with each index having its own interpretation based on the specific bands used.
At Farmonaut, we utilize a range of these indices to provide our users with comprehensive insights into their agricultural operations. Let’s dive into some of the most important indices we use and how they can benefit your farming practices.
2. Normalized Difference Built-up Index (NDBI)
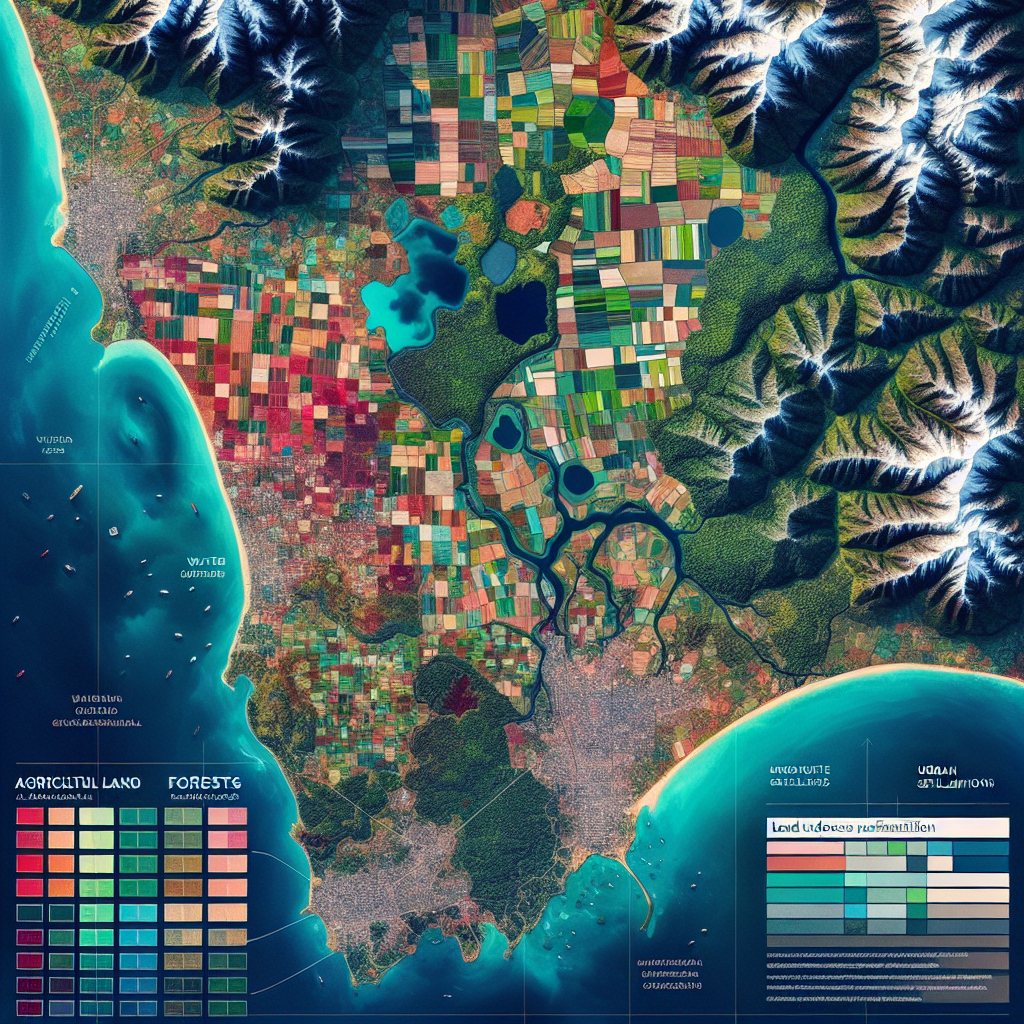
The Normalized Difference Built-up Index (NDBI) is primarily used to identify urban areas and built-up land. While it may seem unrelated to agriculture at first glance, understanding urban expansion and its impact on agricultural land is crucial for long-term farm planning and land use management.
Formula and Interpretation
NDBI = (SWIR – NIR) / (SWIR + NIR)
- SWIR: Short-Wave Infrared
- NIR: Near-Infrared
Positive NDBI values typically indicate built-up areas, while negative values are associated with vegetation and water bodies.
Agricultural Applications
- Monitoring urban sprawl and its encroachment on agricultural land
- Assessing the impact of urbanization on local microclimates and farming conditions
- Planning for sustainable land use and preserving prime agricultural areas
At Farmonaut, we incorporate NDBI data into our long-term agricultural planning tools, helping farmers and policymakers make informed decisions about land use and conservation.
3. Normalized Difference Chlorophyll Index (NDCI)
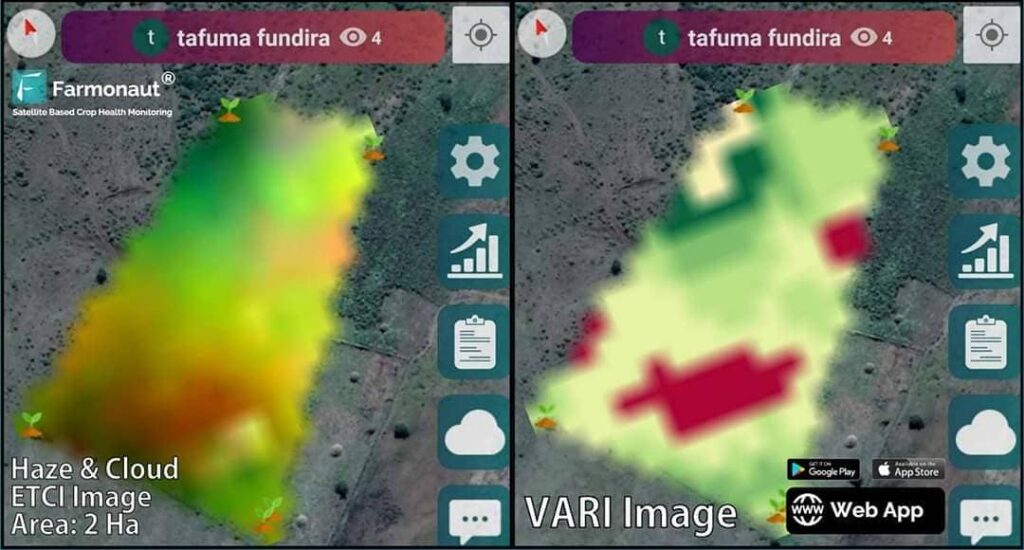
The Normalized Difference Chlorophyll Index (NDCI) is a powerful tool for assessing plant health and productivity. By measuring chlorophyll content, we can gain valuable insights into crop vigor and potential yield.
Formula and Interpretation
NDCI = (NIR – Red Edge) / (NIR + Red Edge)
- NIR: Near-Infrared
- Red Edge: Spectral band sensitive to chlorophyll content
Higher NDCI values indicate greater chlorophyll content and, consequently, healthier vegetation.
Agricultural Applications
- Early detection of crop stress and nutrient deficiencies
- Optimizing fertilizer application through precision agriculture
- Monitoring crop growth stages and predicting yield potential
- Identifying areas of pest or disease infestation
Farmonaut’s satellite-based crop monitoring system uses NDCI data to provide real-time insights into crop health, allowing farmers to take prompt action when issues arise. Our AI-powered advisory system, Jeevn AI, integrates NDCI data with other parameters to deliver personalized recommendations for optimal crop management.
4. Normalized Difference Drought Index (NDDI)
In an era of climate change and increasing water scarcity, monitoring drought conditions is crucial for sustainable agriculture. The Normalized Difference Drought Index (NDDI) helps us assess moisture stress in vegetation and soil, enabling proactive drought management strategies.
Formula and Interpretation
NDDI = (NDVI – NDWI) / (NDVI + NDWI)
- NDVI: Normalized Difference Vegetation Index
- NDWI: Normalized Difference Water Index
Higher NDDI values indicate more severe drought conditions, while lower values suggest adequate moisture levels.
Agricultural Applications
- Early drought detection and monitoring
- Optimizing irrigation schedules and water resource management
- Assessing crop vulnerability to water stress
- Supporting crop insurance and risk assessment
At Farmonaut, we integrate NDDI data into our comprehensive farm management platform, providing farmers with timely alerts and recommendations for drought mitigation. Our satellite-based monitoring system allows for large-scale drought assessment, benefiting individual farmers and supporting regional agricultural planning.
5. Normalized Difference Moisture Index (NDMI)
The Normalized Difference Moisture Index (NDMI) is a valuable tool for assessing vegetation water content and overall ecosystem health. This index is particularly useful for monitoring forest health, wetland dynamics, and agricultural water stress.
Formula and Interpretation
NDMI = (NIR – SWIR) / (NIR + SWIR)
- NIR: Near-Infrared
- SWIR: Short-Wave Infrared
Higher NDMI values indicate greater vegetation water content, while lower values suggest drier conditions.
Agricultural Applications
- Monitoring crop water stress and irrigation needs
- Assessing soil moisture levels for optimal planting and harvesting times
- Detecting and monitoring wetland areas within agricultural landscapes
- Supporting precision agriculture practices for water conservation
Farmonaut’s platform incorporates NDMI data to provide farmers with detailed insights into their crops’ water status. This information is crucial for optimizing irrigation schedules, reducing water waste, and ensuring optimal crop growth conditions.
6. Normalized Difference Soil Index (NDSI)
The Normalized Difference Soil Index (NDSI) is an essential tool for assessing soil characteristics and their impact on crop growth. This index helps in understanding soil composition, moisture content, and overall quality.
Formula and Interpretation
NDSI = (SWIR – NIR) / (SWIR + NIR)
- SWIR: Short-Wave Infrared
- NIR: Near-Infrared
Higher NDSI values typically indicate bare soil or areas with sparse vegetation, while lower values suggest denser vegetation cover.
Agricultural Applications
- Assessing soil quality and composition for crop suitability
- Monitoring soil erosion and degradation
- Identifying areas for targeted soil conservation practices
- Supporting precision agriculture for optimized fertilizer application
At Farmonaut, we integrate NDSI data into our comprehensive soil analysis tools, helping farmers make informed decisions about crop selection, soil management, and conservation practices. This information is crucial for sustainable agriculture and long-term farm productivity.
7. Farmonaut’s Satellite System vs. Drone and IoT-based Monitoring
While drone and IoT-based monitoring systems have their merits, Farmonaut’s satellite-based approach offers several distinct advantages for agricultural monitoring and management:
| Feature | Farmonaut Satellite System | Drone-based Monitoring | IoT-based Monitoring |
|---|---|---|---|
| Coverage Area | Large-scale (regional to global) | Limited (local) | Limited (point-based) |
| Frequency of Data Collection | Regular (daily to weekly) | On-demand (requires manual flights) | Continuous (limited by battery life) |
| Cost-effectiveness | High (no hardware investment) | Medium (requires drone purchase and maintenance) | Low (requires multiple sensors and maintenance) |
| Ease of Use | High (cloud-based platform) | Medium (requires pilot training) | Medium (requires technical setup and maintenance) |
| Data Processing | Automated (AI-powered) | Semi-automated (requires post-processing) | Automated (limited by sensor capabilities) |
| Regulatory Compliance | Straightforward (satellite data) | Complex (drone flight regulations) | Moderate (depending on sensor type) |
| Scalability | Highly scalable | Limited by operational capacity | Scalable but costly |
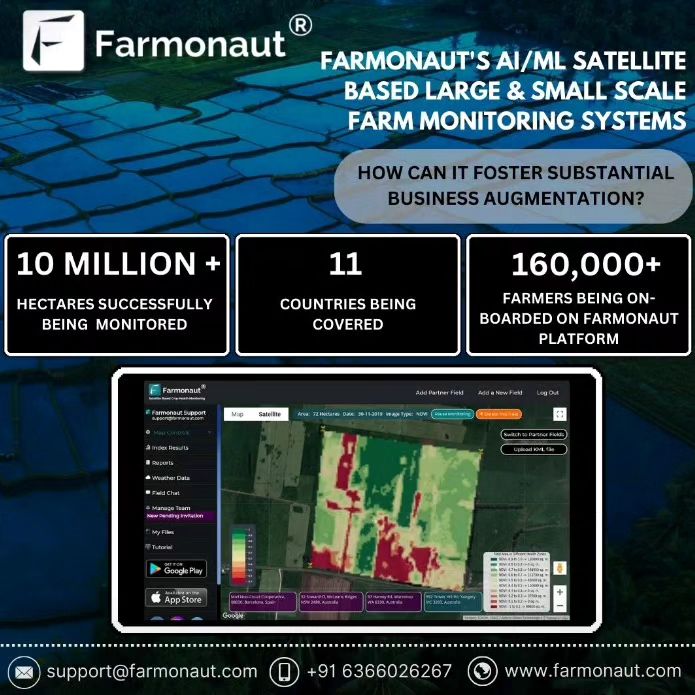
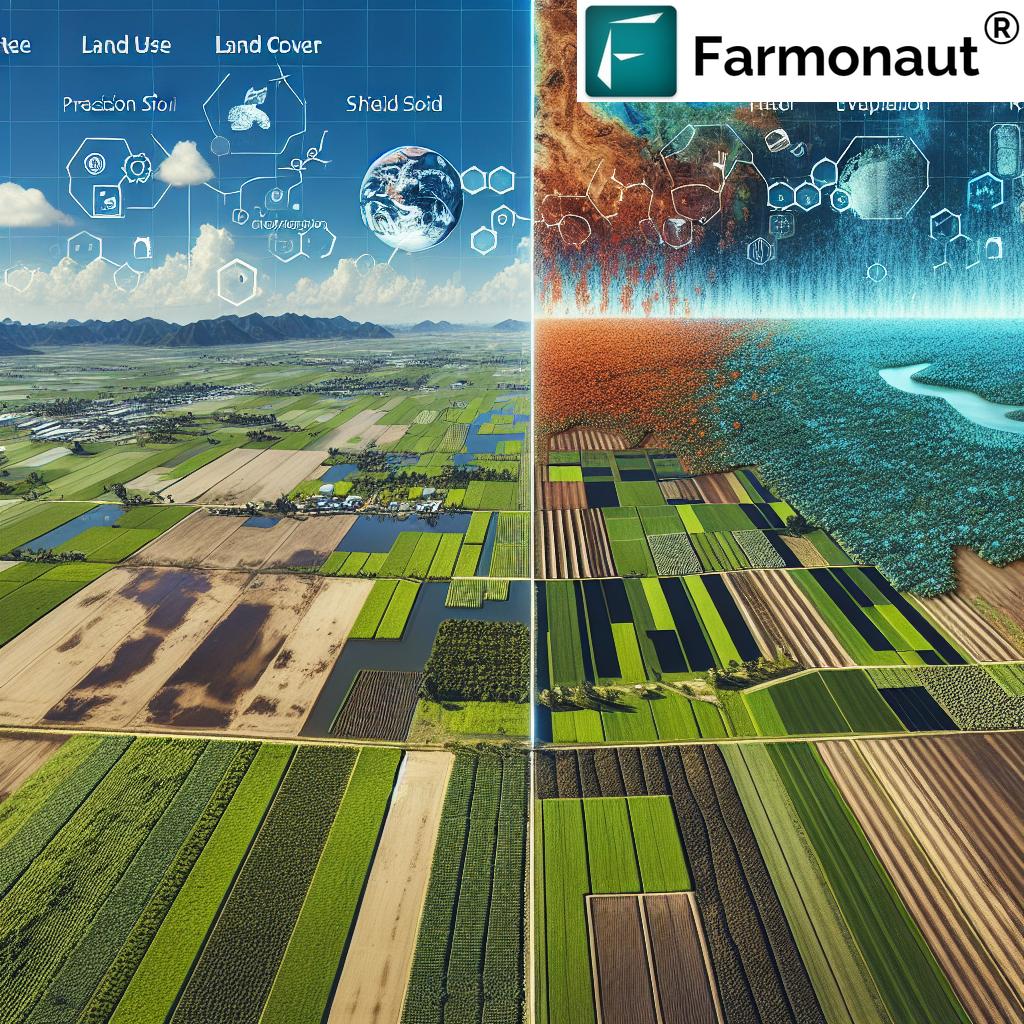
As demonstrated in the comparison above, Farmonaut’s satellite-based system offers unparalleled coverage, cost-effectiveness, and ease of use for agricultural monitoring. Our platform integrates multiple normalized difference indices to provide comprehensive insights into crop health, soil conditions, and environmental factors.
8. Implementing Normalized Difference Indices in Your Farm Management Strategy
Incorporating normalized difference indices into your farm management strategy can significantly enhance your decision-making process and overall farm productivity. Here’s how you can leverage these powerful tools with Farmonaut:
- Sign up for Farmonaut: Visit our website to create your account and get started with our satellite-based monitoring system.
- Define your farm boundaries: Use our intuitive mapping tools to outline your fields and areas of interest.
- Access real-time data: Our platform provides regularly updated satellite imagery and calculated indices for your farm.
- Interpret the data: Use our AI-powered Jeevn advisory system to get personalized recommendations based on the index values and other factors.
- Take action: Implement targeted interventions based on the insights provided, such as adjusting irrigation, applying fertilizers, or addressing pest issues.
- Monitor progress: Continuously track changes in index values to assess the effectiveness of your interventions and make further adjustments as needed.
By integrating these indices into your daily farm management practices, you can optimize resource use, reduce costs, and improve overall farm productivity. Farmonaut’s platform makes it easy to access and interpret this valuable data, empowering you to make informed decisions for your agricultural operations.
9. FAQs
- Q: How often is the satellite data updated on Farmonaut’s platform?
A: Our satellite data is typically updated every 3-5 days, depending on the specific satellite constellation and weather conditions. - Q: Can Farmonaut’s system detect specific crop diseases?
A: While our system can identify areas of stress or anomalies in crop health, precise disease identification often requires additional on-ground verification. However, our AI advisory system can suggest potential causes based on patterns in the data. - Q: Is Farmonaut’s platform suitable for small-scale farmers?
A: Absolutely! We offer scalable solutions that cater to farms of all sizes. Our platform is designed to be cost-effective and user-friendly, making precision agriculture accessible to small-scale farmers. - Q: How does weather data integrate with the normalized difference indices?
A: Our platform combines satellite-derived indices with local weather data to provide more comprehensive insights. This integration allows for better understanding of how weather patterns affect crop health and soil conditions. - Q: Can I access Farmonaut’s data through my own farm management software?
A: Yes, we offer API access to our satellite and weather data. You can find more information in our API documentation. - Q: Is Farmonaut available as a mobile app?
A: Yes, we have mobile apps available for both Android and iOS devices. You can download them from the Google Play Store or the Apple App Store.
Conclusion
Normalized difference indices are powerful tools that have revolutionized agricultural monitoring and management. At Farmonaut, we’re committed to making these advanced technologies accessible and actionable for farmers of all scales. By leveraging our satellite-based monitoring system and AI-powered advisory tools, you can take your farm management to the next level, optimizing resource use, improving crop yields, and promoting sustainable agricultural practices.
Ready to transform your farming operations with the power of normalized difference indices? Subscribe to Farmonaut today and experience the future of precision agriculture!
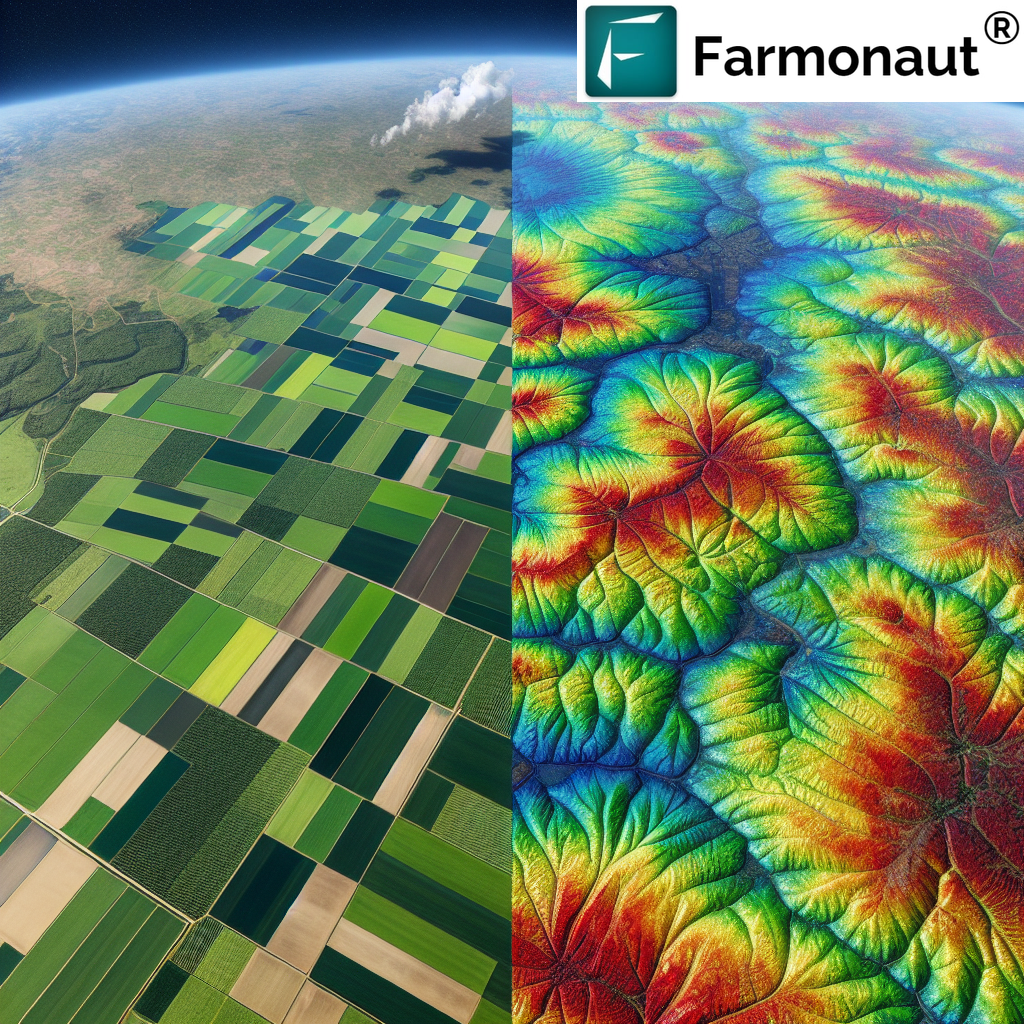
Join the agricultural revolution with Farmonaut and harness the power of satellite technology for smarter, more sustainable farming. Together, we can cultivate a brighter future for agriculture worldwide.


