

Farm data · Explainer
What Is Cloud Farming? Meaning, SAVI and Satellite Data
Cloud farming means managing a farm with data and software that run online, so growers and advisers see the same field maps anywhere. 85% of US farms had internet access in 2025 (USDA NASS). SAVI is a soil-adjusted satellite vegetation index, not a farm type.
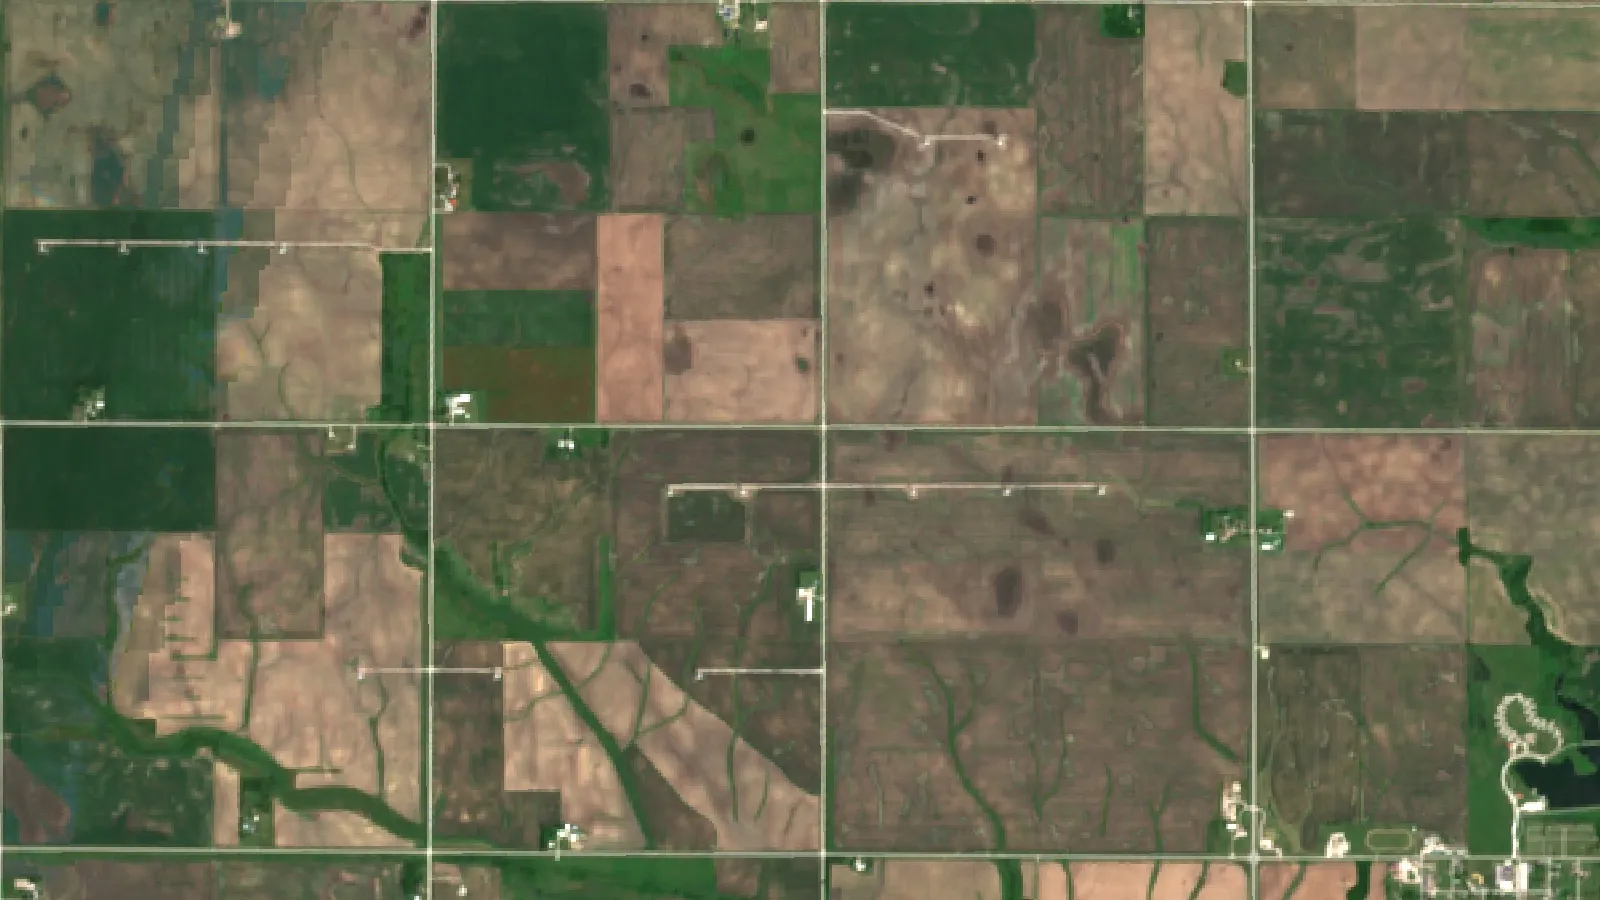
Key takeaways
- Cloud farming is farm management with records, maps and satellite images stored and processed on online servers.
- SAVI is the Soil Adjusted Vegetation Index; USGS describes it as NDVI corrected for soil brightness where plant cover is low, with L set at 0.5.
- In 2025, 85% of US farms had internet access, 74% used a cellular data plan and 50% bought inputs online, up from 32% in 2023 (USDA NASS).
- Sentinel-2 is designed for a 5-day revisit at the Equator, Landsat 8 and 9 have 16-day cycles offset by 8 days, and NASA’s HLS product gives 2-3 days.
- Satellite maps show where a crop differs, not why; a scout still checks each zone.
In this article
- What is cloud farming?
- Cloud farming meaning vs SAVI farms
- How satellite data feeds cloud farming
- Who uses cloud farming in the US
- Benefits of cloud farming and satellite monitoring
- Satellite, drone and IoT monitoring compared
- Does a cloud farming subscription pay?
- How to start cloud farming in 6 steps
- Is agricultural data secure in cloud platforms?
- Challenges and limits of cloud farming
- The future of cloud farms and SAVI monitoring
- Cloud farming with Farmonaut
- FAQ
- Conclusion
Cloud farming means running a farm with software and data that live on the internet (“the cloud”) instead of on one office computer. Field maps, satellite images, weather, scouting notes and records sit on remote servers, so the farmer, the agronomist and the crew can see the same field data from a phone anywhere. In the USA, 85% of farms had internet access in 2025, according to the USDA NASS Farm Computer Usage and Ownership report (August 2025), which is the base that cloud farming needs.
This guide explains what a “cloud farm” is, what “SAVI farms” really refers to (a satellite vegetation index, not a type of farm), how satellite data feeds cloud farm tools, and what to check before you sign up. It also has a calculator to test whether a monitoring subscription pays for itself on your own acres.
What is cloud farming?
The term borrows its meaning from cloud computing. The US National Institute of Standards and Technology describes cloud computing as on-demand network access to a shared pool of computing resources, such as servers, storage and applications, that a provider can set up and release quickly. That is the NIST definition of cloud computing (SP 800-145). Apply it to a farm and you get cloud farming: the farm’s data and the programs that analyse it run on rented servers, and people reach them through a browser or an app.
A cloud farm, then, is not a place. It is a farm, a field or a group of fields that is managed through a cloud platform. The word is also used loosely in a few other ways:
- Cloud-based farm management software: records, task lists, input plans and field maps kept online. This is the main meaning when people search for cloud farming.
- Remote crop monitoring: satellite or drone images processed on servers and sent to the grower as maps and alerts.
- Connected sensors: soil probes, weather stations and machine data that upload readings to a cloud account.
- Data sharing: one account that a grower, a consultant, a lender or a buyer can each see, with the access the grower allows.
What links them is simple. Data is collected in the field, stored and processed online, and turned into a decision a person can act on.
Key features of a cloud farm setup
- Field boundaries saved once: every map, image and note is tied to the same field outline.
- Images and maps on a schedule: new satellite scenes arrive as the satellites pass, cloud cover allowing.
- Access from any device: the same field view on a phone in the truck and on a laptop in the office.
- History in one place: past seasons stay on file for comparison.
- Shared views: an agronomist can review fields for many clients without driving to each one first.
Cloud farming meaning vs SAVI farms
Searches often pair cloud farms with “SAVI farms”. SAVI is not a farm type. It stands for the Soil Adjusted Vegetation Index, a formula applied to satellite images. The US Geological Survey page on the Landsat Soil Adjusted Vegetation Index says SAVI corrects the common NDVI for soil brightness where plant cover is low.
So “SAVI farms” is best read as farms monitored with the SAVI index. That index is one of the layers a cloud farming platform can compute. The two ideas sit at different levels:
| Point | Cloud farming | SAVI |
|---|---|---|
| What it is | A way to run a farm with online data and software | A vegetation index computed from red and near-infrared light |
| Where it lives | Servers and apps | Inside the satellite image analysis |
| Main use | Records, maps, alerts, shared access | Crop cover and vigour where bare soil shows |
| Best stage | All year | Early season, sparse crops, dry land, orchards |
| Who uses it | Growers, agronomists, farm managers | The software, then the person reading the map |
How SAVI is calculated
USGS gives the formula as SAVI = ((NIR − Red) / (NIR + Red + L)) × (1 + L), where NIR is near-infrared reflectance, Red is red reflectance and L is a soil brightness factor. USGS sets L at 0.5 for its Landsat product to fit most land cover types. On Landsat 8 and 9, that means bands 5 and 4.
Why it matters: on a field with small plants, much of what the satellite sees is soil. Bright or dark soil can push NDVI up or down even when the crop is the same. SAVI damps that effect, so early-season maps of row crops, vines, orchards and rangeland are easier to compare. The University of Nebraska–Lincoln extension guide on vegetation indices lists SAVI and OSAVI next to NDVI, NDRE and GNDVI, and notes that each index has uses it suits best. Once the canopy closes, NDVI and red-edge indices such as NDRE often carry more of the useful detail.
How satellite data feeds cloud farming
Satellites are the main source of field images for cloud farm tools, because one platform can cover thousands of fields without anyone visiting them. Public satellites set the basic pace and detail:
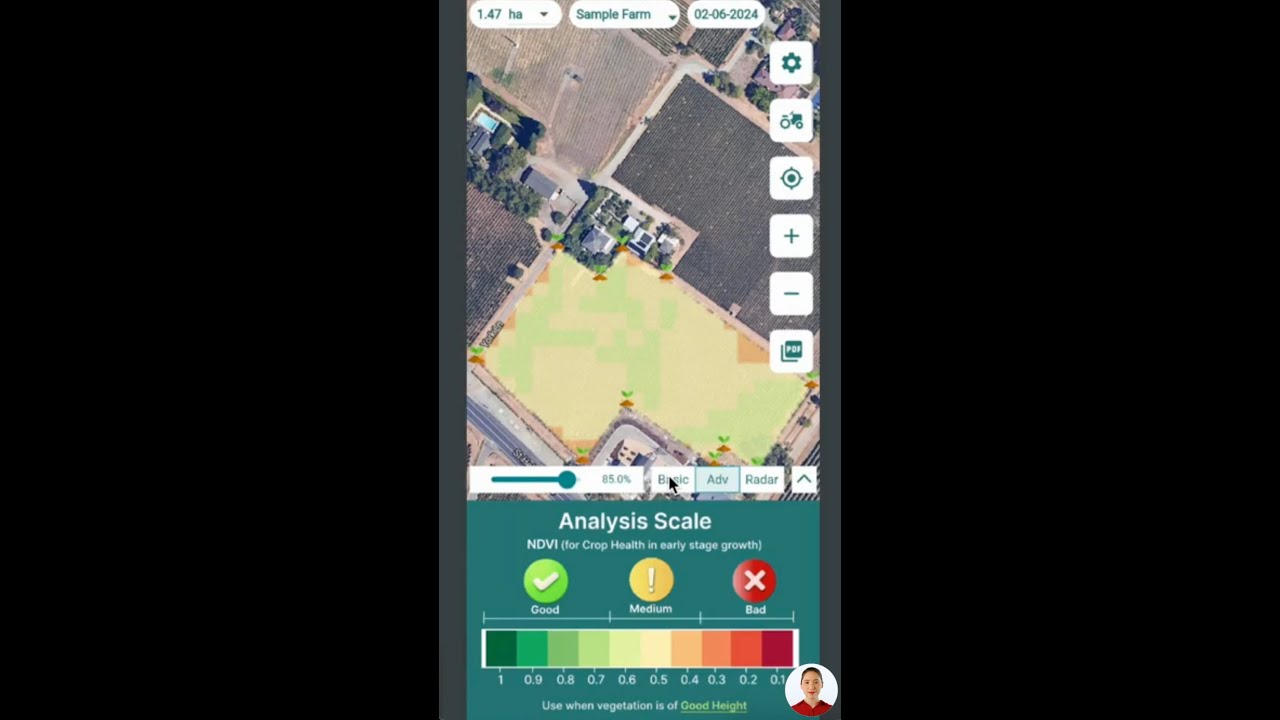
▶ How to read satellite crop maps in the Farmonaut mobile apps. · 4:01
- Sentinel-2 (European Union, Copernicus): the twin-satellite mission is designed for a revisit every 5 days at the Equator, with four bands at 10 m and six at 20 m, per the Copernicus SentiWiki Sentinel-2 mission overview.
- Landsat 8 and 9 (NASA and USGS): each has a 16-day repeat cycle, with an 8-day offset between the two, per the USGS Landsat 9 mission page.
- Harmonized Landsat Sentinel-2 (HLS): NASA combines Landsat 8 and 9 with Sentinel-2A, 2B and 2C into one product with a global observation frequency of 2–3 days, according to the NASA Harmonized Landsat Sentinel-2 project.
Clouds in the sky are the catch. An optical satellite cannot see through cloud, so a 5-day revisit can mean a gap of two or three weeks in a wet spell. Good cloud farming tools flag cloudy scenes, mask them and tell you the date of the last clear image.
What satellite layers show in a cloud farm account
- Crop vigour maps (NDVI, SAVI, EVI): where plants are greener and denser than the rest of the field.
- Red-edge maps (NDRE): changes in leaf chlorophyll, useful later in the season.
- Water stress indices (such as NDWI or NDMI): how much moisture the canopy holds.
- Time series: a line per field or zone, so a sudden dip stands out.
- Zone maps: high, medium and low areas that can guide scouting or variable-rate plans.
A satellite map shows where the crop differs. It does not name the cause. A low patch can be a pest, a disease, a drainage problem, a nutrient gap or a planter skip. Someone still has to walk to the spot and look.
Chart
Days between satellite images
Design revisit or repeat cycle, days (lower is more frequent); HLS shown at the midpoint of NASA’s 2–3 day range
Who uses cloud farming in the US
Cloud tools need the farm to be online. The NASS report for 2025 shows that 85% of US farms had internet access, 74% reached it through a cellular data plan and 55% used a broadband connection. 82% had a smartphone and 68% had a desktop or laptop computer. Half of farms (50%) bought farm inputs online in 2025, up from 32% in 2023.
Chart
Technology use on US farms
Share of US farms, 2025, percent
The spread between states is wide. In the NASS tables, farms buying inputs online rose from 21% to 51% in Texas and from 26% to 47% in Pennsylvania between 2023 and 2025, while Kansas moved from 46% to 47%.
Precision tools that produce the data cloud platforms store are older and more common on large row-crop farms. The USDA Economic Research Service report Precision Agriculture in the Digital Era (EIB-248, 2023) found auto-steer and guidance on 5.3% of planted corn acres in 2001 and 58% in 2016. The same report says yield maps, soil maps and variable-rate technology were used on only 5% to 25% of planted acres of winter wheat, cotton, sorghum and rice. It also names subscription fees, training and maintenance among the costs that slow adoption.
Best fit by farm and user type
- Agronomists and crop consultants: best for screening many client fields each week and sending scouts to the right spots.
- Large row-crop farms: best for tying satellite maps to yield maps and variable-rate plans already in use.
- Orchards, vineyards and dryland crops: best for SAVI-type maps where soil shows between rows.
- Absentee owners and farm managers: best for checking crop progress on land they rarely visit.
- Small mixed farms: best for simple records and weather; the value of imagery depends on field size, since a 10 m pixel covers 100 m².
Chart
Farms buying inputs online, 2023 vs 2025
Share of farms, selected states, percent
Benefits of cloud farming and satellite monitoring
The gains come from seeing problems sooner and spending field time where it counts. The sources above support these points:
- Wide coverage: one satellite scene covers a large area, and the same image serves every field in it.
- Regular updates: 5-day Sentinel-2 revisits, or 2–3 days for the combined HLS product, cloud cover allowing.
- History: Landsat archives go back decades and HLS starts in 2013 for Landsat 8 and 2015 for Sentinel-2, so a field can be compared with past seasons.
- No disturbance: imaging from orbit does not touch the crop or the soil.
- Shared work: growers and consultants mark the same map, so notes do not get lost between phone calls.
Precision agriculture
Cloud data makes precision farming easier to run. Zone maps built from several seasons of imagery can guide soil sampling, seeding rates and fertilizer plans. Fertilizer and crop protection choices still need a soil test, the product label and local rules; if in doubt, ask a certified crop adviser.
Early problem detection
A field-level time series can show a drop in vigour before it is easy to see from the road. Typical causes to check on the ground include:
- Pest or disease pressure
- Water stress or waterlogging
- Nutrient deficiency
- Hail, wind or frost damage
- Planting gaps or equipment faults
For field steps once a stress zone appears, see our guide on ways to deal with crop stress.
Resource use and records
When irrigation, input and harvest records sit next to imagery, it is easier to see which actions paid off. Sustainability reporting, lender requests and buyer audits also draw on the same records. For a wider view of the practices involved, read about the main pillars of sustainable agriculture and other technology in sustainable agriculture.
Satellite, drone and IoT monitoring compared
Cloud farm platforms can take data from satellites, drones and field sensors. Each source has a different job. The table compares them in plain terms.
| Factor | Satellite | Drone | IoT sensors |
|---|---|---|---|
| Area covered | Whole farms and regions | A few fields per flight | The point where each sensor sits |
| How often | Every few days, cloud cover allowing | When someone flies it | Every few minutes |
| Detail | 10–30 m pixels on public satellites | Centimetres | One reading per sensor |
| Set-up work | Draw field boundaries | Pilot, aircraft, flight plans | Install, power and maintain units |
| Weather limits | Clouds block optical images | Wind and rain stop flights | Few |
| Best for | Screening many fields over time | Close looks at problem spots | Soil moisture and microclimate |
Many farms combine them: satellites to screen, a drone or a scout to confirm, and sensors where irrigation timing matters. For a wider look at pros and cons, see our post on the advantages and disadvantages of modern farming.
Does a cloud farming subscription pay?
Most of the return comes from two places: scouting hours saved by going straight to problem zones, and input or yield gains on areas fixed sooner. Neither is guaranteed. The calculator below lets you test your own numbers against the yearly cost. The defaults are round examples set close to break-even, not benchmarks; replace each one with your own figure.
Try the numbers for your own farm below.
Calculator
Does satellite monitoring pay on your acres?
Enter your own acres, costs and expected savings.
- Yearly subscription, US$: $500
- Value of time saved, US$: $500
- Value of input or yield gain, US$: $0
- Net per acre, US$: 0.00
All defaults are round example values set near break-even, not benchmarks or forecasts. Replace the example fee with today’s quote and use your own labour cost. No sourced constants are built in.
How to start cloud farming in 6 steps
- Check your connection. Make sure the office and the field have enough mobile signal to load maps.
- List the decisions you want help with. Scouting routes, irrigation timing, nitrogen, harvest order or crop insurance records.
- Map your fields. Draw or import boundaries once, with crop and planting dates.
- Pick the indices you need. SAVI early or on sparse crops, NDVI and NDRE later, a water index for irrigated land.
- Set a weekly routine. Look at new images, mark zones, scout them and log what you found.
- Review at season end. Compare maps with yield and costs, and keep what earned its place.
Infographic
From satellite image to field decision
- 1Map fieldsSave boundaries, crop and planting date once.
- 2Get imagesNew scenes arrive as satellites pass, cloud cover allowing.
- 3Read the indexSAVI early, NDVI or NDRE later, a water index if irrigated.
- 4Scout the zonesWalk to low or changing areas and find the cause.
- 5Log and reviewRecord actions and compare with yield at season end.
If you build your own tools, satellite data can also come through an API. Developers can see how field data is added and pulled in the satellite and weather API developer docs and the satellite data API page.
▶ Adding and managing farm fields through the Farmonaut API. · 6:06
Is agricultural data secure in cloud platforms?
Security depends on the provider and on the contract. Before you upload records, read who owns the data, who it may be shared with and how to take it back out.
- US: the Ag Data Transparent core principles grew out of the Privacy and Security Principles for Farm Data that the American Farm Bureau Federation helped set up in 2014, and were updated in 2024.
- Australia: the National Farmers’ Federation publishes the Australian Farm Data Code to give farmers confidence in how providers handle their data.
- Checklist: ownership stays with you, export in standard formats, clear sharing settings, two-step login and a named contact for data requests.
For contracts and privacy law in your country, get professional advice.
Challenges and limits of cloud farming
- Cloud cover: optical satellites miss cloudy days, so wet seasons leave gaps.
- Pixel size: 10 m pixels blur small plots, narrow strips and single trees.
- Connectivity: 15% of US farms had no internet access in 2025 (NASS), and field signal can be weak even where the office is online.
- Learning time: maps need a person who knows the field to read them.
- Costs: EIB-248 names subscription fees, training and maintenance among adoption costs.
- Data handling: terms differ between providers.
The future of cloud farms and SAVI monitoring
More satellites mean more frequent images. Sentinel-2C has joined the Sentinel-2 series, and NASA’s HLS already blends Landsat and Sentinel-2 for 2–3 day coverage. Machine learning is being used to flag unusual fields and to sort zones, but a scout’s check is still the step that turns a map into a decision. Demand for people who can run these tools is also growing; see our note on agricultural science careers in Australia.
Cloud farming with Farmonaut
The Farmonaut Satellite + AI Farm Monitoring System is one cloud-based option. It processes satellite images into vegetation, water and other index maps for each field and shows them in web and mobile apps. Try it on your own fields through the web and mobile app, or compare it with AI-powered crop monitoring options.
Related pages on our site: types of farming, agricultural cooperation in Africa (Russian).
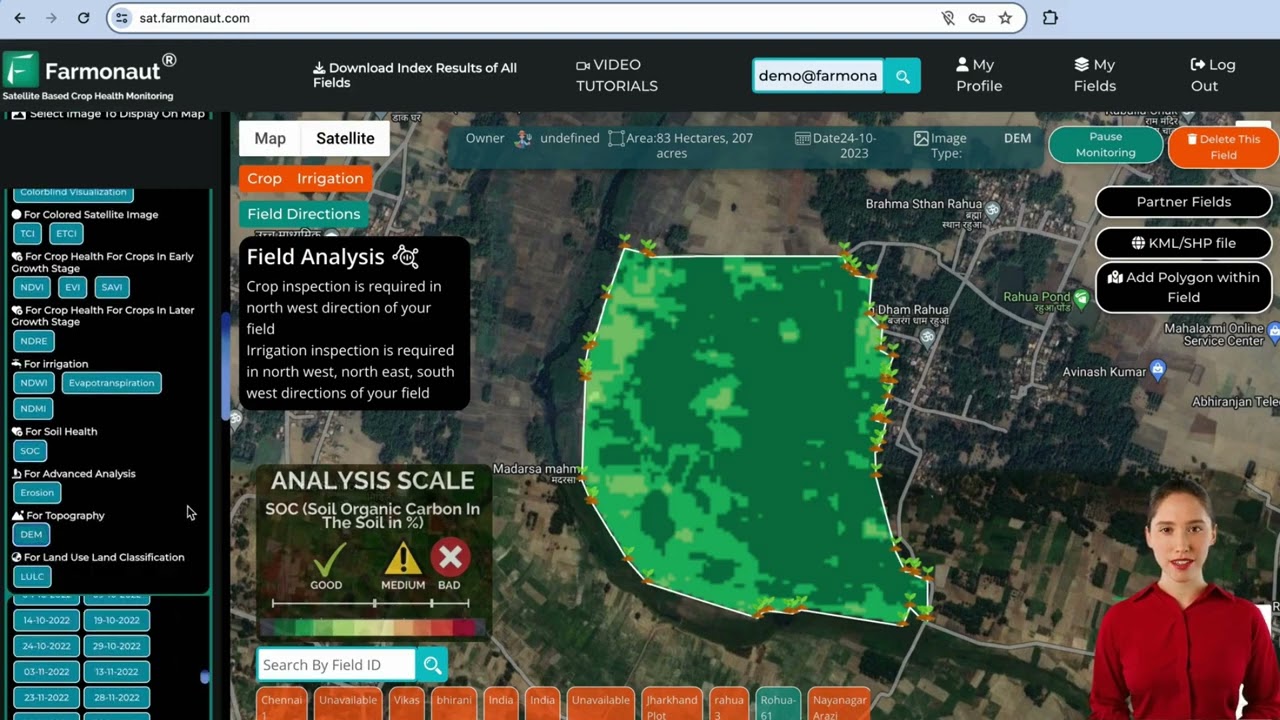
▶ Tutorial for the Farmonaut web app for satellite field monitoring. · 8:02
FAQ
What is cloud farming in simple words?
It is farming with your records, maps and satellite images stored online, so you and your advisers can see the same field data from any phone or computer.
What does a cloud farm mean?
A cloud farm is a farm or field managed through an online platform. The land is real; “cloud” refers to where the data and software run.
What are SAVI farms?
The phrase refers to fields monitored with SAVI, the Soil Adjusted Vegetation Index. USGS describes SAVI as NDVI corrected for soil brightness where plant cover is low.
How often do satellites update a cloud farm map?
Sentinel-2 is designed for a 5-day revisit at the Equator, Landsat 8 and 9 together give 8 days, and NASA’s combined HLS product gives 2–3 days. Clouds can delay a clear image.
Do I need fast internet for cloud farming?
A mobile data plan is often enough to view maps. In 2025, 74% of US farms reached the internet through a cellular plan (USDA NASS).
Conclusion
Cloud farming is less about new hardware and more about putting field data where everyone who makes decisions can see it. SAVI is one useful layer in that data, mainly early in the season and on sparse crops. Start with clear field boundaries, a weekly look at new images and a scout on the ground, and judge the service by the hours and inputs it saves you.
Farmonaut crop monitoring
Put your fields in the cloud
Agronomists and growers can map fields and get satellite vegetation and water index maps for each one.




Keep reading
Sources
- USDA NASS, Farm Computer Usage and Ownership (August 2025): esmis.nal.usda.gov
- NIST, SP 800-145 The NIST Definition of Cloud Computing (2011): csrc.nist.gov
- USGS, Landsat Soil Adjusted Vegetation Index: usgs.gov
- University of Nebraska-Lincoln Extension, vegetation indices guide G2296: extensionpublications.unl.edu
- Copernicus SentiWiki, Sentinel-2 mission overview: sentiwiki.copernicus.eu
- USGS, Landsat 9 mission page: usgs.gov
- USGS, Landsat 8 mission page: usgs.gov
- NASA, Harmonized Landsat Sentinel-2 (HLS) project: hls.gsfc.nasa.gov
- USDA ERS, Precision Agriculture in the Digital Era, EIB-248 (2023): ers.usda.gov
- Ag Data Transparent, Core Principles (updated 2024): agdatatransparent.com
- National Farmers’ Federation, Australian Farm Data Code: nff.org.au
Discussion
Questions, corrections or field experience? Share them below. First-time comments are reviewed before they appear, and your email is never published.
No comments yet. Be the first to add a question or your experience.

 Clubhouse OS
 John Deere
 Progenseed
 SkyHarvest
 Polaris Digitech
 Teledarbas
 Wild Oak Farm
 SFX
 BACF Africa
 Doodlakine
 Exurbia Geospatial
 FieldZero
 Indico Company
 Kubota

 Licence holder · Niger · Gold
 Client · Tanzania · Gold
 Client · Somalia · Gold
 Client & affiliate partner · Ghana · Gold










